An official website of the United States government
 United States Department of Labor
Conduct investigations related to suspected violations of federal, state, or local laws to prevent or solve crimes. Excludes “Private Detectives and Investigators” (33-9021).
Employment estimate and mean wage estimates for Detectives and Criminal Investigators:
| Employment (1) | Employment RSE (3) |
Mean hourly wage |
Mean annual wage (2) |
Wage RSE (3) |
|---|---|---|---|---|
| 107,400 | 0.2 % | $ 44.04 | $ 91,610 | 0.2 % |
Percentile wage estimates for Detectives and Criminal Investigators:
| Percentile | 10% | 25% | 50% (Median) |
75% | 90% |
|---|---|---|---|---|---|
| Hourly Wage | $ 23.07 | $ 29.44 | $ 41.48 | $ 53.14 | $ 72.39 |
| Annual Wage (2) | $ 47,990 | $ 61,240 | $ 86,280 | $ 110,530 | $ 150,570 |
Industries with the highest published employment and wages for Detectives and Criminal Investigators are provided. For a list of all industries with employment in Detectives and Criminal Investigators, see the Create Customized Tables function.
Industries with the highest levels of employment in Detectives and Criminal Investigators:
| Industry | Employment (1) | Percent of industry employment | Hourly mean wage | Annual mean wage (2) |
|---|---|---|---|---|
| Local Government, excluding schools and hospitals (OEWS Designation) | 44,300 | 0.82 | $ 37.88 | $ 78,800 |
| Federal Executive Branch (OEWS Designation) | 40,130 | 1.92 | $ 56.05 | $ 116,590 |
| State Government, excluding schools and hospitals (OEWS Designation) | 22,060 | 1.04 | $ 34.56 | $ 71,880 |
| Postal Service (federal government) | 490 | 0.08 | $ 51.70 | $ 107,530 |
| Colleges, Universities, and Professional Schools | 350 | 0.01 | $ 35.19 | $ 73,200 |
Industries with the highest concentration of employment in Detectives and Criminal Investigators:
| Industry | Employment (1) | Percent of industry employment | Hourly mean wage | Annual mean wage (2) |
|---|---|---|---|---|
| Federal Executive Branch (OEWS Designation) | 40,130 | 1.92 | $ 56.05 | $ 116,590 |
| State Government, excluding schools and hospitals (OEWS Designation) | 22,060 | 1.04 | $ 34.56 | $ 71,880 |
| Local Government, excluding schools and hospitals (OEWS Designation) | 44,300 | 0.82 | $ 37.88 | $ 78,800 |
| Postal Service (federal government) | 490 | 0.08 | $ 51.70 | $ 107,530 |
| Psychiatric and Substance Abuse Hospitals | 50 | 0.02 | $ 38.69 | $ 80,480 |
Top paying industries for Detectives and Criminal Investigators:
| Industry | Employment (1) | Percent of industry employment | Hourly mean wage | Annual mean wage (2) |
|---|---|---|---|---|
| Federal Executive Branch (OEWS Designation) | 40,130 | 1.92 | $ 56.05 | $ 116,590 |
| Postal Service (federal government) | 490 | 0.08 | $ 51.70 | $ 107,530 |
| Psychiatric and Substance Abuse Hospitals | 50 | 0.02 | $ 38.69 | $ 80,480 |
| Local Government, excluding schools and hospitals (OEWS Designation) | 44,300 | 0.82 | $ 37.88 | $ 78,800 |
| Colleges, Universities, and Professional Schools | 350 | 0.01 | $ 35.19 | $ 73,200 |
States and areas with the highest published employment, location quotients, and wages for Detectives and Criminal Investigators are provided. For a list of all areas with employment in Detectives and Criminal Investigators, see the Create Customized Tables function.
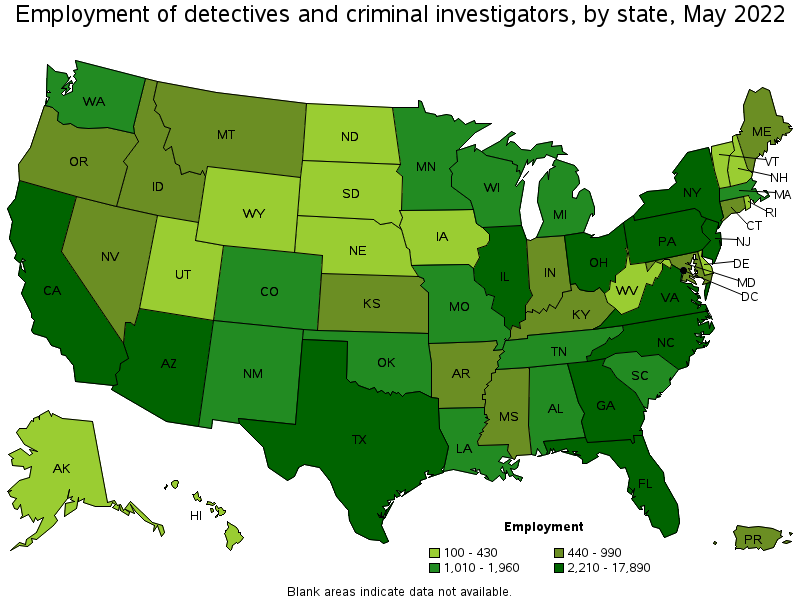
States with the highest employment level in Detectives and Criminal Investigators:
| State | Employment (1) | Employment per thousand jobs | Location quotient (9) | Hourly mean wage | Annual mean wage (2) |
|---|---|---|---|---|---|
| Texas | 17,890 | 1.38 | 1.90 | $ 39.90 | $ 82,990 |
| California | 11,280 | 0.64 | 0.88 | $ 53.04 | $ 110,320 |
| New York | 9,950 | 1.09 | 1.50 | $ 53.07 | $ 110,390 |
| Florida | 5,950 | 0.65 | 0.89 | $ 41.03 | $ 85,330 |
| Arizona | 5,260 | 1.74 | 2.39 | $ 43.28 | $ 90,010 |
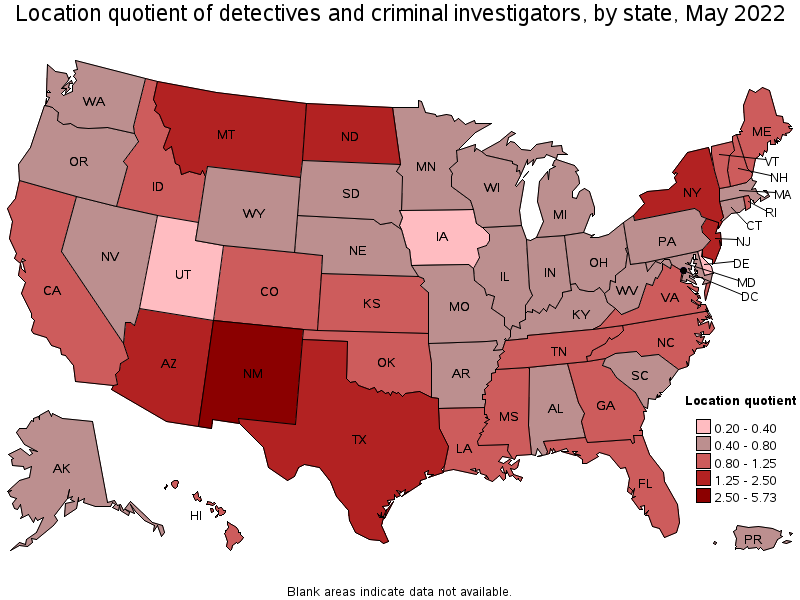
States with the highest concentration of jobs and location quotients in Detectives and Criminal Investigators:
| State | Employment (1) | Employment per thousand jobs | Location quotient (9) | Hourly mean wage | Annual mean wage (2) |
|---|---|---|---|---|---|
| District of Columbia | 2,870 | 4.16 | 5.73 | $ 64.37 | $ 133,890 |
| New Mexico | 1,840 | 2.25 | 3.10 | $ 37.25 | $ 77,480 |
| Arizona | 5,260 | 1.74 | 2.39 | $ 43.28 | $ 90,010 |
| Texas | 17,890 | 1.38 | 1.90 | $ 39.90 | $ 82,990 |
| New York | 9,950 | 1.09 | 1.50 | $ 53.07 | $ 110,390 |
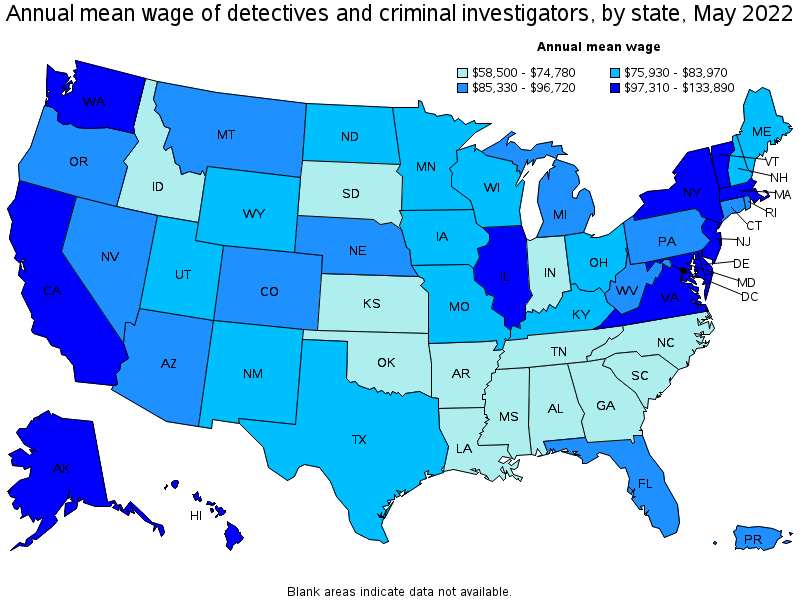
Top paying states for Detectives and Criminal Investigators:
| State | Employment (1) | Employment per thousand jobs | Location quotient (9) | Hourly mean wage | Annual mean wage (2) |
|---|---|---|---|---|---|
| District of Columbia | 2,870 | 4.16 | 5.73 | $ 64.37 | $ 133,890 |
| Alaska | 110 | 0.37 | 0.50 | $ 61.74 | $ 128,410 |
| Hawaii | 430 | 0.73 | 1.00 | $ 57.35 | $ 119,290 |
| Maryland | 890 | 0.34 | 0.46 | $ 56.63 | $ 117,800 |
| Washington | 1,560 | 0.46 | 0.63 | $ 53.19 | $ 110,620 |
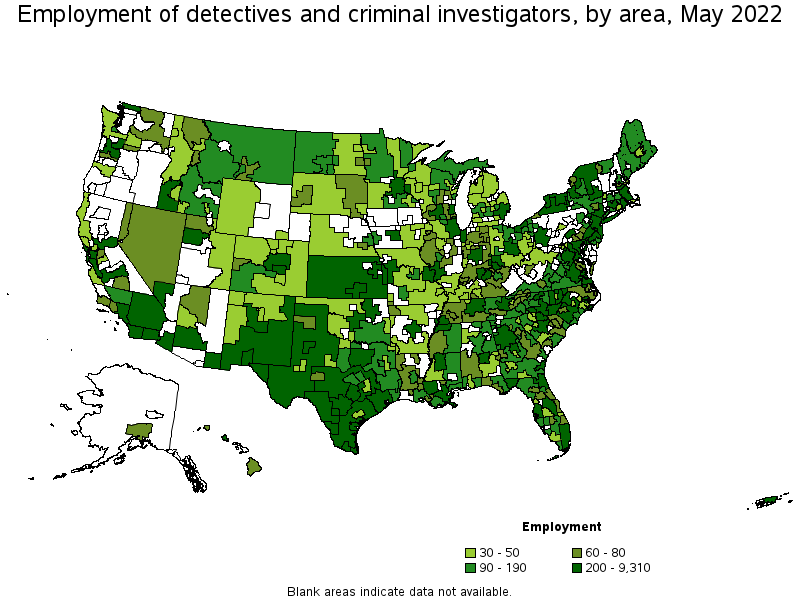
Metropolitan areas with the highest employment level in Detectives and Criminal Investigators:
| Metropolitan area | Employment (1) | Employment per thousand jobs | Location quotient (9) | Hourly mean wage | Annual mean wage (2) |
|---|---|---|---|---|---|
| New York-Newark-Jersey City, NY-NJ-PA | 9,310 | 1.01 | 1.40 | $ 56.21 | $ 116,920 |
| Washington-Arlington-Alexandria, DC-VA-MD-WV | 4,730 | 1.56 | 2.15 | $ 62.60 | $ 130,200 |
| Los Angeles-Long Beach-Anaheim, CA | 2,930 | 0.48 | 0.66 | $ 56.53 | $ 117,570 |
| San Diego-Carlsbad, CA | 2,800 | 1.88 | 2.59 | $ 52.77 | $ 109,760 |
| Atlanta-Sandy Springs-Roswell, GA | 2,380 | 0.87 | 1.20 | $ 35.66 | $ 74,160 |
| Miami-Fort Lauderdale-West Palm Beach, FL | 2,140 | 0.82 | 1.13 | $ 49.35 | $ 102,650 |
| Dallas-Fort Worth-Arlington, TX | 2,110 | 0.56 | 0.76 | $ 42.03 | $ 87,410 |
| Philadelphia-Camden-Wilmington, PA-NJ-DE-MD | 2,060 | 0.74 | 1.03 | $ 48.61 | $ 101,100 |
| Chicago-Naperville-Elgin, IL-IN-WI | 1,860 | 0.42 | 0.58 | $ 51.20 | $ 106,500 |
| El Paso, TX | 1,760 | 5.55 | 7.65 | $ 43.64 | $ 90,780 |
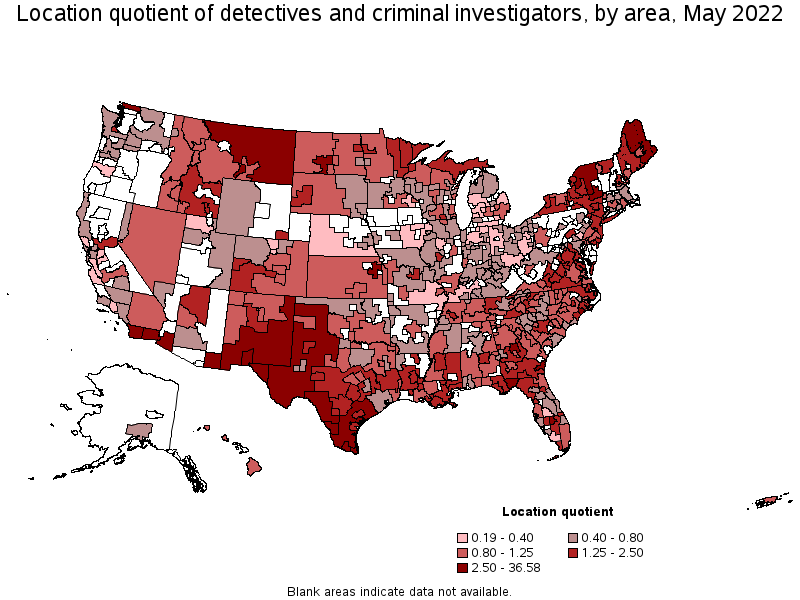
Metropolitan areas with the highest concentration of jobs and location quotients in Detectives and Criminal Investigators:
| Metropolitan area | Employment (1) | Employment per thousand jobs | Location quotient (9) | Hourly mean wage | Annual mean wage (2) |
|---|---|---|---|---|---|
| Sierra Vista-Douglas, AZ | 800 | 23.91 | 32.92 | $ 43.79 | $ 91,090 |
| Laredo, TX | 1,290 | 12.67 | 17.44 | $ 41.93 | $ 87,210 |
| El Centro, CA | 740 | 11.77 | 16.21 | $ 48.90 | $ 101,710 |
| Yuma, AZ | 730 | 10.76 | 14.81 | $ 39.96 | $ 83,120 |
| Las Cruces, NM | 520 | 7.22 | 9.95 | $ 42.52 | $ 88,430 |
| Brownsville-Harlingen, TX | 830 | 5.56 | 7.66 | $ 42.25 | $ 87,880 |
| El Paso, TX | 1,760 | 5.55 | 7.65 | $ 43.64 | $ 90,780 |
| McAllen-Edinburg-Mission, TX | 1,520 | 5.53 | 7.61 | $ 41.23 | $ 85,760 |
| Brunswick, GA | 220 | 5.25 | 7.24 | $ 57.93 | $ 120,480 |
| Bellingham, WA | 240 | 2.72 | 3.74 | $ 56.19 | $ 116,880 |
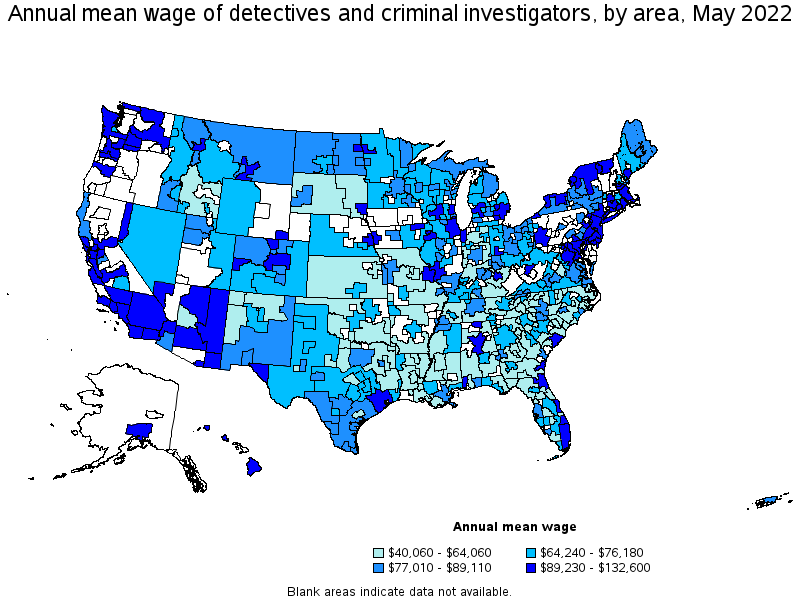
Top paying metropolitan areas for Detectives and Criminal Investigators:
| Metropolitan area | Employment (1) | Employment per thousand jobs | Location quotient (9) | Hourly mean wage | Annual mean wage (2) |
|---|---|---|---|---|---|
| San Jose-Sunnyvale-Santa Clara, CA | 230 | 0.20 | 0.28 | $ 63.75 | $ 132,600 |
| Washington-Arlington-Alexandria, DC-VA-MD-WV | 4,730 | 1.56 | 2.15 | $ 62.60 | $ 130,200 |
| Anchorage, AK | 80 | 0.51 | 0.70 | $ 62.26 | $ 129,500 |
| Santa Maria-Santa Barbara, CA | 60 | 0.30 | 0.41 | $ 59.39 | $ 123,540 |
| Urban Honolulu, HI | 350 | 0.82 | 1.13 | $ 58.46 | $ 121,590 |
| Brunswick, GA | 220 | 5.25 | 7.24 | $ 57.93 | $ 120,480 |
| San Francisco-Oakland-Hayward, CA | 720 | 0.30 | 0.42 | $ 56.72 | $ 117,990 |
| Los Angeles-Long Beach-Anaheim, CA | 2,930 | 0.48 | 0.66 | $ 56.53 | $ 117,570 |
| Oxnard-Thousand Oaks-Ventura, CA | 80 | 0.26 | 0.35 | $ 56.45 | $ 117,410 |
| Baltimore-Columbia-Towson, MD | 470 | 0.36 | 0.50 | $ 56.31 | $ 117,110 |
Nonmetropolitan areas with the highest employment in Detectives and Criminal Investigators:
| Nonmetropolitan area | Employment (1) | Employment per thousand jobs | Location quotient (9) | Hourly mean wage | Annual mean wage (2) |
|---|---|---|---|---|---|
| Coastal Plains Region of Texas nonmetropolitan area | 1,580 | 10.81 | 14.89 | $ 38.92 | $ 80,960 |
| Border Region of Texas nonmetropolitan area | 1,550 | 26.57 | 36.58 | $ 38.60 | $ 80,290 |
| Eastern New Mexico nonmetropolitan area | 630 | 4.07 | 5.60 | $ 39.76 | $ 82,700 |
| West Texas Region of Texas nonmetropolitan area | 450 | 2.30 | 3.17 | $ 34.74 | $ 72,250 |
| Hill Country Region of Texas nonmetropolitan area | 320 | 1.63 | 2.24 | $ 32.41 | $ 67,410 |
Nonmetropolitan areas with the highest concentration of jobs and location quotients in Detectives and Criminal Investigators:
| Nonmetropolitan area | Employment (1) | Employment per thousand jobs | Location quotient (9) | Hourly mean wage | Annual mean wage (2) |
|---|---|---|---|---|---|
| Border Region of Texas nonmetropolitan area | 1,550 | 26.57 | 36.58 | $ 38.60 | $ 80,290 |
| Coastal Plains Region of Texas nonmetropolitan area | 1,580 | 10.81 | 14.89 | $ 38.92 | $ 80,960 |
| Eastern New Mexico nonmetropolitan area | 630 | 4.07 | 5.60 | $ 39.76 | $ 82,700 |
| West Texas Region of Texas nonmetropolitan area | 450 | 2.30 | 3.17 | $ 34.74 | $ 72,250 |
| East-Central Montana nonmetropolitan area | 140 | 2.23 | 3.08 | $ 42.46 | $ 88,310 |
Top paying nonmetropolitan areas for Detectives and Criminal Investigators:
| Nonmetropolitan area | Employment (1) | Employment per thousand jobs | Location quotient (9) | Hourly mean wage | Annual mean wage (2) |
|---|---|---|---|---|---|
| Hawaii / Kauai nonmetropolitan area | 60 | 0.60 | 0.82 | $ 54.69 | $ 113,760 |
| Western Washington nonmetropolitan area | 50 | 0.38 | 0.52 | $ 48.89 | $ 101,680 |
| Eastern Washington nonmetropolitan area | 60 | 0.55 | 0.76 | $ 44.83 | $ 93,250 |
| Northern Vermont nonmetropolitan area | 100 | 1.42 | 1.95 | $ 44.04 | $ 91,590 |
| Capital/Northern New York nonmetropolitan area | 300 | 2.21 | 3.04 | $ 43.58 | $ 90,640 |
These estimates are calculated with data collected from employers in all industry sectors, all metropolitan and nonmetropolitan areas, and all states and the District of Columbia. The top employment and wage figures are provided above. The complete list is available in the downloadable XLS files.
The percentile wage estimate is the value of a wage below which a certain percent of workers fall. The median wage is the 50th percentile wage estimate—50 percent of workers earn less than the median and 50 percent of workers earn more than the median. More about percentile wages.
(1) Estimates for detailed occupations do not sum to the totals because the totals include occupations not shown separately. Estimates do not include self-employed workers.
(2) Annual wages have been calculated by multiplying the hourly mean wage by a "year-round, full-time" hours figure of 2,080 hours; for those occupations where there is not an hourly wage published, the annual wage has been directly calculated from the reported survey data.
(3) The relative standard error (RSE) is a measure of the reliability of a survey statistic. The smaller the relative standard error, the more precise the estimate.
(9) The location quotient is the ratio of the area concentration of occupational employment to the national average concentration. A location quotient greater than one indicates the occupation has a higher share of employment than average, and a location quotient less than one indicates the occupation is less prevalent in the area than average.
Other OEWS estimates and related information:
May 2022 National Occupational Employment and Wage Estimates
May 2022 State Occupational Employment and Wage Estimates
May 2022 Metropolitan and Nonmetropolitan Area Occupational Employment and Wage Estimates
May 2022 National Industry-Specific Occupational Employment and Wage Estimates
Last Modified Date: April 25, 2023