
An official website of the United States government
An official website of the United States government
The .gov means it's official.
Federal government websites often end in .gov or .mil. Before sharing sensitive information,
make sure you're on a federal government site.
The site is secure.
The
https:// ensures that you are connecting to the official website and that any
information you provide is encrypted and transmitted securely.
Prepare and cook food in a fast food restaurant with a limited menu. Duties of these cooks are limited to preparation of a few basic items and normally involve operating large-volume single-purpose cooking equipment.
Employment estimate and mean wage estimates for Cooks, Fast Food:
| Employment (1) | Employment RSE (3) |
Mean hourly wage |
Mean annual wage (2) |
Wage RSE (3) |
|---|---|---|---|---|
| 725,590 | 1.7 % | $ 13.43 | $ 27,920 | 0.6 % |
Percentile wage estimates for Cooks, Fast Food:
| Percentile | 10% | 25% | 50% (Median) |
75% | 90% |
|---|---|---|---|---|---|
| Hourly Wage | $ 9.94 | $ 10.84 | $ 13.29 | $ 15.37 | $ 17.21 |
| Annual Wage (2) | $ 20,680 | $ 22,550 | $ 27,640 | $ 31,970 | $ 35,800 |
Industries with the highest published employment and wages for Cooks, Fast Food are provided. For a list of all industries with employment in Cooks, Fast Food, see the Create Customized Tables function.
Industries with the highest levels of employment in Cooks, Fast Food:
| Industry | Employment (1) | Percent of industry employment | Hourly mean wage | Annual mean wage (2) |
|---|---|---|---|---|
| Restaurants and Other Eating Places | 703,000 | 6.75 | $ 13.39 | $ 27,840 |
| Gasoline Stations | 6,310 | 0.67 | $ 13.12 | $ 27,280 |
| Food and Beverage Retailers (4451 and 4452 only) | 4,290 | 0.14 | $ 14.48 | $ 30,120 |
| Special Food Services | 4,070 | 0.64 | $ 15.73 | $ 32,710 |
| Other Amusement and Recreation Industries | 1,830 | 0.15 | $ 14.76 | $ 30,690 |
Industries with the highest concentration of employment in Cooks, Fast Food:
| Industry | Employment (1) | Percent of industry employment | Hourly mean wage | Annual mean wage (2) |
|---|---|---|---|---|
| Restaurants and Other Eating Places | 703,000 | 6.75 | $ 13.39 | $ 27,840 |
| Gasoline Stations | 6,310 | 0.67 | $ 13.12 | $ 27,280 |
| Special Food Services | 4,070 | 0.64 | $ 15.73 | $ 32,710 |
| Amusement Parks and Arcades | 360 | 0.18 | $ 15.31 | $ 31,840 |
| Other Amusement and Recreation Industries | 1,830 | 0.15 | $ 14.76 | $ 30,690 |
Top paying industries for Cooks, Fast Food:
| Industry | Employment (1) | Percent of industry employment | Hourly mean wage | Annual mean wage (2) |
|---|---|---|---|---|
| Traveler Accommodation | 570 | 0.03 | $ 18.76 | $ 39,020 |
| Merchant Wholesalers, Nondurable Goods (4244 and 4248 only) | 290 | 0.03 | $ 18.67 | $ 38,830 |
| Beverage Manufacturing | 330 | 0.11 | $ 18.41 | $ 38,290 |
| Management of Companies and Enterprises | (8) | (8) | $ 16.47 | $ 34,250 |
| Special Food Services | 4,070 | 0.64 | $ 15.73 | $ 32,710 |
States and areas with the highest published employment, location quotients, and wages for Cooks, Fast Food are provided. For a list of all areas with employment in Cooks, Fast Food, see the Create Customized Tables function.
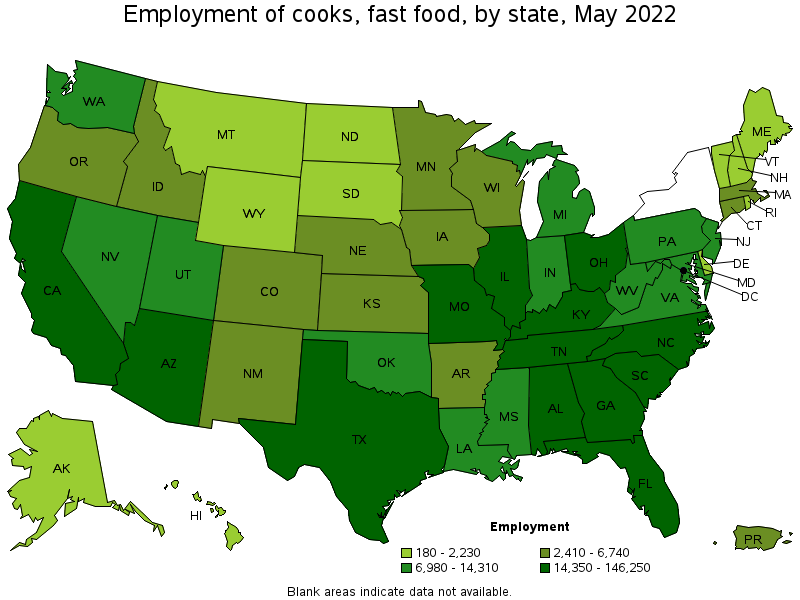
States with the highest employment level in Cooks, Fast Food:
| State | Employment (1) | Employment per thousand jobs | Location quotient (9) | Hourly mean wage | Annual mean wage (2) |
|---|---|---|---|---|---|
| California | 146,250 | 8.29 | 1.69 | $ 16.61 | $ 34,550 |
| North Carolina | 87,610 | 18.85 | 3.84 | $ 11.29 | $ 23,490 |
| Kentucky | 42,480 | 22.37 | 4.56 | $ 10.99 | $ 22,870 |
| Florida | 38,630 | 4.19 | 0.85 | $ 12.75 | $ 26,520 |
| Tennessee | 31,490 | 10.09 | 2.06 | $ 11.78 | $ 24,500 |
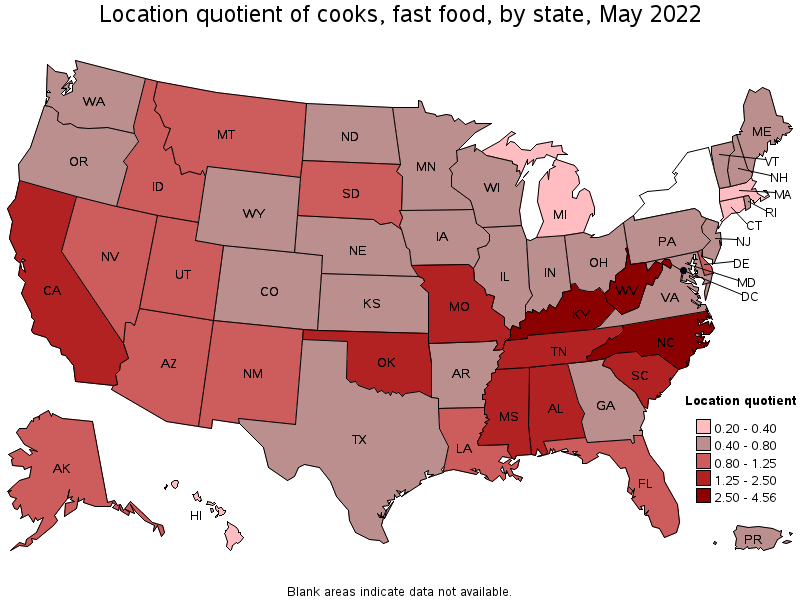
States with the highest concentration of jobs and location quotients in Cooks, Fast Food:
| State | Employment (1) | Employment per thousand jobs | Location quotient (9) | Hourly mean wage | Annual mean wage (2) |
|---|---|---|---|---|---|
| Kentucky | 42,480 | 22.37 | 4.56 | $ 10.99 | $ 22,870 |
| North Carolina | 87,610 | 18.85 | 3.84 | $ 11.29 | $ 23,490 |
| West Virginia | 11,710 | 17.26 | 3.52 | $ 10.49 | $ 21,820 |
| Missouri | 30,510 | 10.82 | 2.21 | $ 13.00 | $ 27,030 |
| Tennessee | 31,490 | 10.09 | 2.06 | $ 11.78 | $ 24,500 |
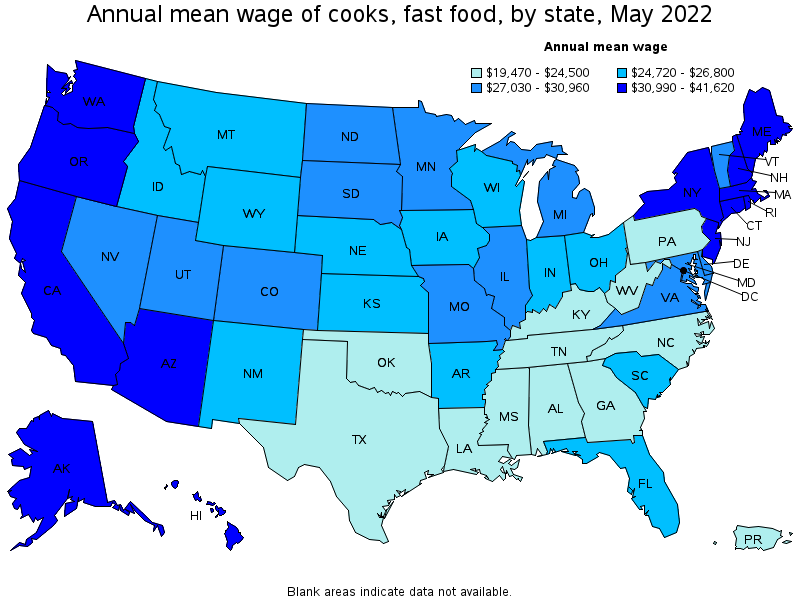
Top paying states for Cooks, Fast Food:
| State | Employment (1) | Employment per thousand jobs | Location quotient (9) | Hourly mean wage | Annual mean wage (2) |
|---|---|---|---|---|---|
| District of Columbia | 1,600 | 2.31 | 0.47 | $ 20.01 | $ 41,620 |
| Massachusetts | 5,140 | 1.44 | 0.29 | $ 17.54 | $ 36,480 |
| Washington | 7,340 | 2.15 | 0.44 | $ 17.01 | $ 35,380 |
| California | 146,250 | 8.29 | 1.69 | $ 16.61 | $ 34,550 |
| Hawaii | 1,040 | 1.76 | 0.36 | $ 16.50 | $ 34,310 |
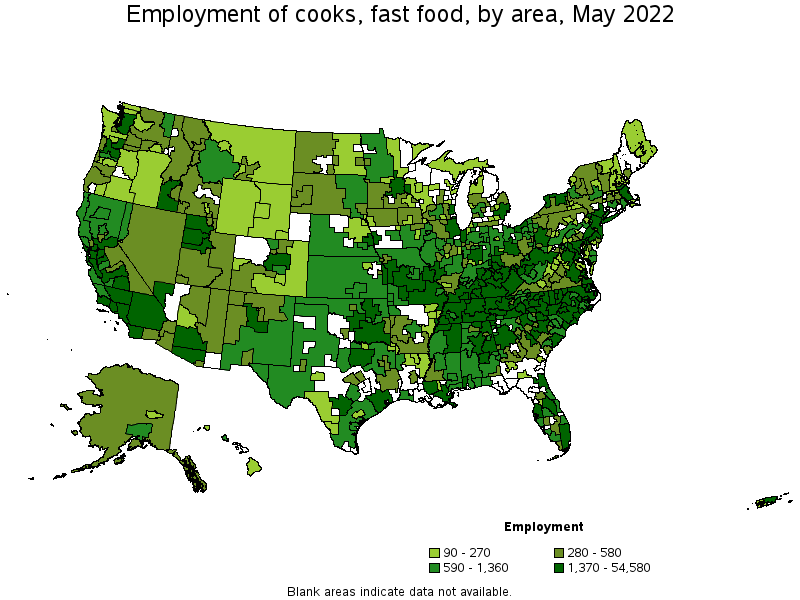
Metropolitan areas with the highest employment level in Cooks, Fast Food:
| Metropolitan area | Employment (1) | Employment per thousand jobs | Location quotient (9) | Hourly mean wage | Annual mean wage (2) |
|---|---|---|---|---|---|
| Los Angeles-Long Beach-Anaheim, CA | 54,580 | 8.95 | 1.82 | $ 16.89 | $ 35,130 |
| New York-Newark-Jersey City, NY-NJ-PA | 21,220 | 2.31 | 0.47 | $ 16.75 | $ 34,850 |
| Riverside-San Bernardino-Ontario, CA | 17,840 | 10.93 | 2.23 | $ 15.59 | $ 32,420 |
| Charlotte-Concord-Gastonia, NC-SC | 17,590 | 13.85 | 2.82 | $ 12.14 | $ 25,250 |
| San Diego-Carlsbad, CA | 14,320 | 9.61 | 1.96 | $ 16.61 | $ 34,560 |
| San Francisco-Oakland-Hayward, CA | 12,230 | 5.11 | 1.04 | $ 18.05 | $ 37,550 |
| Phoenix-Mesa-Scottsdale, AZ | 12,210 | 5.50 | 1.12 | $ 15.11 | $ 31,420 |
| Raleigh, NC | 11,570 | 17.22 | 3.51 | $ 11.41 | $ 23,730 |
| Chicago-Naperville-Elgin, IL-IN-WI | 11,540 | 2.61 | 0.53 | $ 13.99 | $ 29,090 |
| St. Louis, MO-IL | 10,510 | 8.03 | 1.64 | $ 13.68 | $ 28,450 |
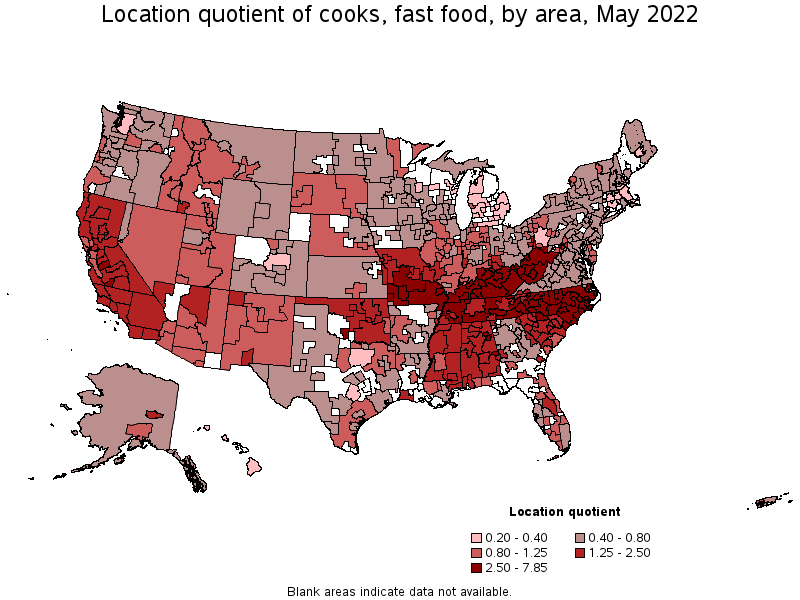
Metropolitan areas with the highest concentration of jobs and location quotients in Cooks, Fast Food:
| Metropolitan area | Employment (1) | Employment per thousand jobs | Location quotient (9) | Hourly mean wage | Annual mean wage (2) |
|---|---|---|---|---|---|
| Jacksonville, NC | 1,920 | 38.52 | 7.85 | $ 10.39 | $ 21,620 |
| Elizabethtown-Fort Knox, KY | 1,630 | 31.39 | 6.40 | $ 10.64 | $ 22,130 |
| Fayetteville, NC | 4,020 | 31.21 | 6.36 | $ 10.75 | $ 22,370 |
| Greenville, NC | 2,080 | 26.66 | 5.43 | $ 10.92 | $ 22,710 |
| Goldsboro, NC | 1,040 | 26.23 | 5.35 | $ 10.53 | $ 21,900 |
| New Bern, NC | 1,140 | 25.50 | 5.20 | $ 10.82 | $ 22,510 |
| Bowling Green, KY | 1,790 | 23.87 | 4.86 | $ 10.66 | $ 22,170 |
| Burlington, NC | 1,530 | 23.73 | 4.84 | $ 11.50 | $ 23,920 |
| Rocky Mount, NC | 1,280 | 23.71 | 4.83 | $ 10.85 | $ 22,560 |
| Beckley, WV | 950 | 23.40 | 4.77 | $ 9.95 | $ 20,700 |
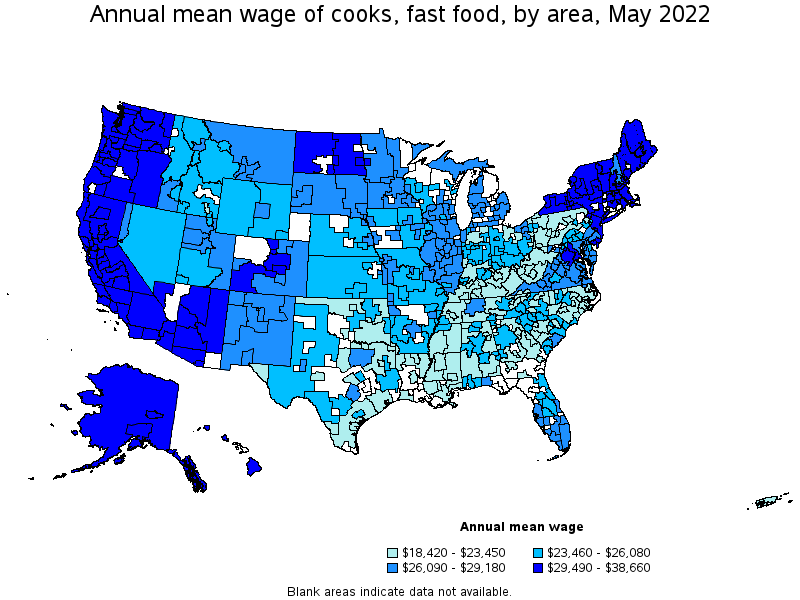
Top paying metropolitan areas for Cooks, Fast Food:
| Metropolitan area | Employment (1) | Employment per thousand jobs | Location quotient (9) | Hourly mean wage | Annual mean wage (2) |
|---|---|---|---|---|---|
| San Jose-Sunnyvale-Santa Clara, CA | 5,310 | 4.72 | 0.96 | $ 18.59 | $ 38,660 |
| San Francisco-Oakland-Hayward, CA | 12,230 | 5.11 | 1.04 | $ 18.05 | $ 37,550 |
| Boston-Cambridge-Nashua, MA-NH | 3,940 | 1.46 | 0.30 | $ 17.98 | $ 37,400 |
| Seattle-Tacoma-Bellevue, WA | 3,680 | 1.81 | 0.37 | $ 17.90 | $ 37,240 |
| Napa, CA | 410 | 5.53 | 1.13 | $ 17.52 | $ 36,440 |
| Santa Rosa, CA | 1,180 | 5.79 | 1.18 | $ 17.25 | $ 35,880 |
| Mount Vernon-Anacortes, WA | 140 | 2.87 | 0.59 | $ 17.19 | $ 35,750 |
| Vallejo-Fairfield, CA | 1,500 | 10.88 | 2.22 | $ 16.91 | $ 35,180 |
| Los Angeles-Long Beach-Anaheim, CA | 54,580 | 8.95 | 1.82 | $ 16.89 | $ 35,130 |
| New York-Newark-Jersey City, NY-NJ-PA | 21,220 | 2.31 | 0.47 | $ 16.75 | $ 34,850 |
Nonmetropolitan areas with the highest employment in Cooks, Fast Food:
| Nonmetropolitan area | Employment (1) | Employment per thousand jobs | Location quotient (9) | Hourly mean wage | Annual mean wage (2) |
|---|---|---|---|---|---|
| Southeast Coastal North Carolina nonmetropolitan area | 7,040 | 28.79 | 5.87 | $ 10.50 | $ 21,830 |
| Piedmont North Carolina nonmetropolitan area | 6,030 | 24.10 | 4.91 | $ 10.60 | $ 22,050 |
| Central Kentucky nonmetropolitan area | 4,920 | 27.47 | 5.60 | $ 10.31 | $ 21,450 |
| South Central Kentucky nonmetropolitan area | 4,650 | 28.12 | 5.73 | $ 10.27 | $ 21,360 |
| West Kentucky nonmetropolitan area | 3,900 | 26.53 | 5.41 | $ 10.43 | $ 21,690 |
Nonmetropolitan areas with the highest concentration of jobs and location quotients in Cooks, Fast Food:
| Nonmetropolitan area | Employment (1) | Employment per thousand jobs | Location quotient (9) | Hourly mean wage | Annual mean wage (2) |
|---|---|---|---|---|---|
| East Kentucky nonmetropolitan area | 2,830 | 28.89 | 5.89 | $ 10.12 | $ 21,050 |
| Southeast Coastal North Carolina nonmetropolitan area | 7,040 | 28.79 | 5.87 | $ 10.50 | $ 21,830 |
| South Central Kentucky nonmetropolitan area | 4,650 | 28.12 | 5.73 | $ 10.27 | $ 21,360 |
| Central Kentucky nonmetropolitan area | 4,920 | 27.47 | 5.60 | $ 10.31 | $ 21,450 |
| West Kentucky nonmetropolitan area | 3,900 | 26.53 | 5.41 | $ 10.43 | $ 21,690 |
Top paying nonmetropolitan areas for Cooks, Fast Food:
| Nonmetropolitan area | Employment (1) | Employment per thousand jobs | Location quotient (9) | Hourly mean wage | Annual mean wage (2) |
|---|---|---|---|---|---|
| Hawaii / Kauai nonmetropolitan area | 150 | 1.49 | 0.30 | $ 17.67 | $ 36,760 |
| Massachusetts nonmetropolitan area | 180 | 2.90 | 0.59 | $ 17.16 | $ 35,690 |
| Eastern Washington nonmetropolitan area | 280 | 2.82 | 0.58 | $ 16.01 | $ 33,290 |
| Western Washington nonmetropolitan area | 270 | 2.17 | 0.44 | $ 15.96 | $ 33,210 |
| Eastern Sierra-Mother Lode Region of California nonmetropolitan area | 540 | 8.83 | 1.80 | $ 15.91 | $ 33,090 |
These estimates are calculated with data collected from employers in all industry sectors, all metropolitan and nonmetropolitan areas, and all states and the District of Columbia. The top employment and wage figures are provided above. The complete list is available in the downloadable XLS files.
The percentile wage estimate is the value of a wage below which a certain percent of workers fall. The median wage is the 50th percentile wage estimate—50 percent of workers earn less than the median and 50 percent of workers earn more than the median. More about percentile wages.
(1) Estimates for detailed occupations do not sum to the totals because the totals include occupations not shown separately. Estimates do not include self-employed workers.
(2) Annual wages have been calculated by multiplying the hourly mean wage by a "year-round, full-time" hours figure of 2,080 hours; for those occupations where there is not an hourly wage published, the annual wage has been directly calculated from the reported survey data.
(3) The relative standard error (RSE) is a measure of the reliability of a survey statistic. The smaller the relative standard error, the more precise the estimate.
(8) Estimate not released.
(9) The location quotient is the ratio of the area concentration of occupational employment to the national average concentration. A location quotient greater than one indicates the occupation has a higher share of employment than average, and a location quotient less than one indicates the occupation is less prevalent in the area than average.
Other OEWS estimates and related information:
May 2022 National Occupational Employment and Wage Estimates
May 2022 State Occupational Employment and Wage Estimates
May 2022 Metropolitan and Nonmetropolitan Area Occupational Employment and Wage Estimates
May 2022 National Industry-Specific Occupational Employment and Wage Estimates
Last Modified Date: April 25, 2023