
An official website of the United States government
An official website of the United States government
The .gov means it's official.
Federal government websites often end in .gov or .mil. Before sharing sensitive information,
make sure you're on a federal government site.
The site is secure.
The
https:// ensures that you are connecting to the official website and that any
information you provide is encrypted and transmitted securely.
Perform duties such as taking orders and serving food and beverages. Serve customers at counter or from a steam table. May take payment. May prepare food and beverages. Counter attendants who also wait tables are included in �Waiters and Waitresses� (35-3031),
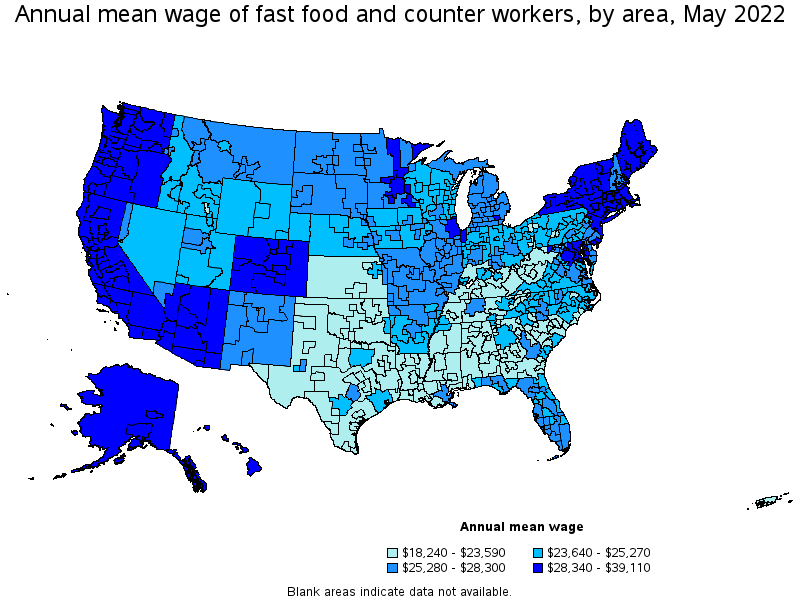
Employment estimate and mean wage estimates for Fast Food and Counter Workers:
| Employment (1) | Employment RSE (3) |
Mean hourly wage |
Mean annual wage (2) |
Wage RSE (3) |
|---|---|---|---|---|
| 3,325,050 | 0.7 % | $ 13.53 | $ 28,130 | 0.4 % |
Percentile wage estimates for Fast Food and Counter Workers:
| Percentile | 10% | 25% | 50% (Median) |
75% | 90% |
|---|---|---|---|---|---|
| Hourly Wage | $ 10.17 | $ 11.06 | $ 13.43 | $ 15.13 | $ 17.00 |
| Annual Wage (2) | $ 21,150 | $ 23,010 | $ 27,930 | $ 31,480 | $ 35,350 |
Industries with the highest published employment and wages for Fast Food and Counter Workers are provided. For a list of all industries with employment in Fast Food and Counter Workers, see the Create Customized Tables function.
Industries with the highest levels of employment in Fast Food and Counter Workers:
| Industry | Employment (1) | Percent of industry employment | Hourly mean wage | Annual mean wage (2) |
|---|---|---|---|---|
| Restaurants and Other Eating Places | 2,753,460 | 26.44 | $ 13.25 | $ 27,560 |
| Special Food Services | 129,360 | 20.31 | $ 14.37 | $ 29,890 |
| Food and Beverage Retailers (4451 and 4452 only) | 111,100 | 3.72 | $ 14.99 | $ 31,180 |
| Elementary and Secondary Schools | 80,740 | 0.96 | $ 15.67 | $ 32,600 |
| Gasoline Stations | 43,570 | 4.62 | $ 13.25 | $ 27,560 |
Industries with the highest concentration of employment in Fast Food and Counter Workers:
| Industry | Employment (1) | Percent of industry employment | Hourly mean wage | Annual mean wage (2) |
|---|---|---|---|---|
| Restaurants and Other Eating Places | 2,753,460 | 26.44 | $ 13.25 | $ 27,560 |
| Special Food Services | 129,360 | 20.31 | $ 14.37 | $ 29,890 |
| Book Retailers and News Dealers | 5,960 | 8.10 | $ 13.38 | $ 27,830 |
| Bakeries and Tortilla Manufacturing | 14,820 | 4.65 | $ 14.76 | $ 30,710 |
| Gasoline Stations | 43,570 | 4.62 | $ 13.25 | $ 27,560 |
Top paying industries for Fast Food and Counter Workers:
| Industry | Employment (1) | Percent of industry employment | Hourly mean wage | Annual mean wage (2) |
|---|---|---|---|---|
| Federal Executive Branch (OEWS Designation) | 6,510 | 0.31 | $ 19.93 | $ 41,450 |
| Securities, Commodity Contracts, and Other Financial Investments and Related Activities | (8) | (8) | $ 18.43 | $ 38,330 |
| Clothing and Clothing Accessories Retailers | 60 | 0.01 | $ 18.02 | $ 37,470 |
| Offices of Physicians | 140 | 0.01 | $ 18.01 | $ 37,450 |
| Furniture and Home Furnishings Retailers | 1,460 | 0.31 | $ 17.62 | $ 36,640 |
States and areas with the highest published employment, location quotients, and wages for Fast Food and Counter Workers are provided. For a list of all areas with employment in Fast Food and Counter Workers, see the Create Customized Tables function.
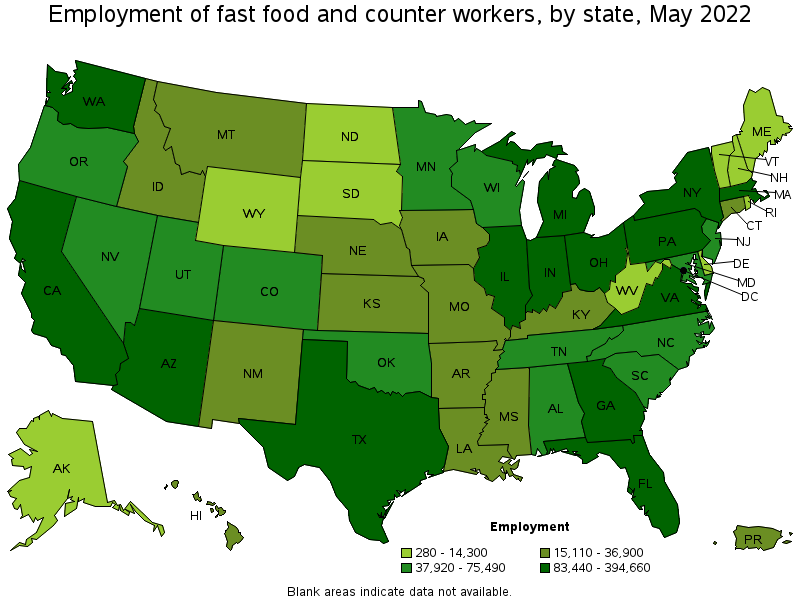
States with the highest employment level in Fast Food and Counter Workers:
| State | Employment (1) | Employment per thousand jobs | Location quotient (9) | Hourly mean wage | Annual mean wage (2) |
|---|---|---|---|---|---|
| California | 394,660 | 22.38 | 1.00 | $ 16.60 | $ 34,530 |
| Texas | 328,900 | 25.31 | 1.13 | $ 11.59 | $ 24,120 |
| Florida | 183,470 | 19.92 | 0.89 | $ 12.41 | $ 25,800 |
| New York | 183,270 | 20.12 | 0.89 | $ 16.04 | $ 33,370 |
| Ohio | 136,220 | 25.34 | 1.13 | $ 12.07 | $ 25,100 |
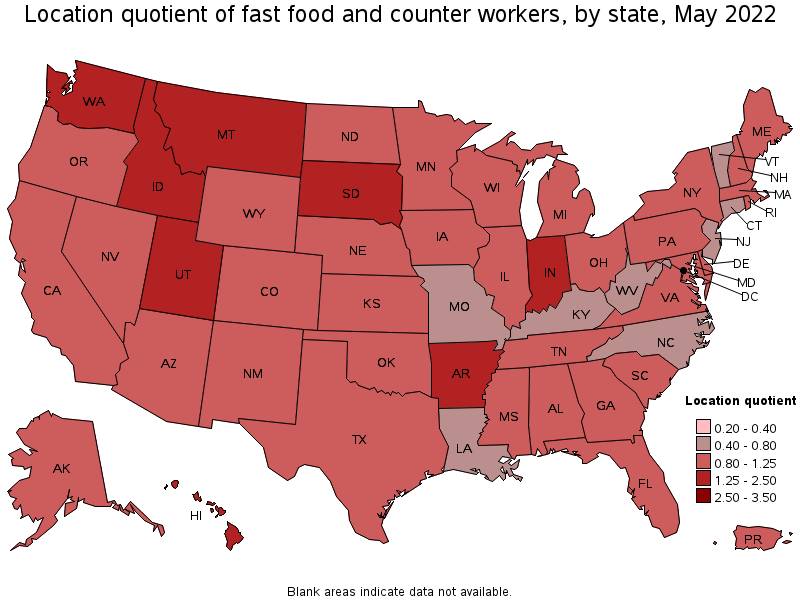
States with the highest concentration of jobs and location quotients in Fast Food and Counter Workers:
| State | Employment (1) | Employment per thousand jobs | Location quotient (9) | Hourly mean wage | Annual mean wage (2) |
|---|---|---|---|---|---|
| Hawaii | 20,340 | 34.19 | 1.52 | $ 14.02 | $ 29,170 |
| South Dakota | 14,300 | 32.86 | 1.46 | $ 12.89 | $ 26,800 |
| Montana | 15,110 | 30.87 | 1.37 | $ 12.80 | $ 26,630 |
| Utah | 50,100 | 30.79 | 1.37 | $ 12.52 | $ 26,040 |
| Arkansas | 36,520 | 29.67 | 1.32 | $ 12.30 | $ 25,580 |
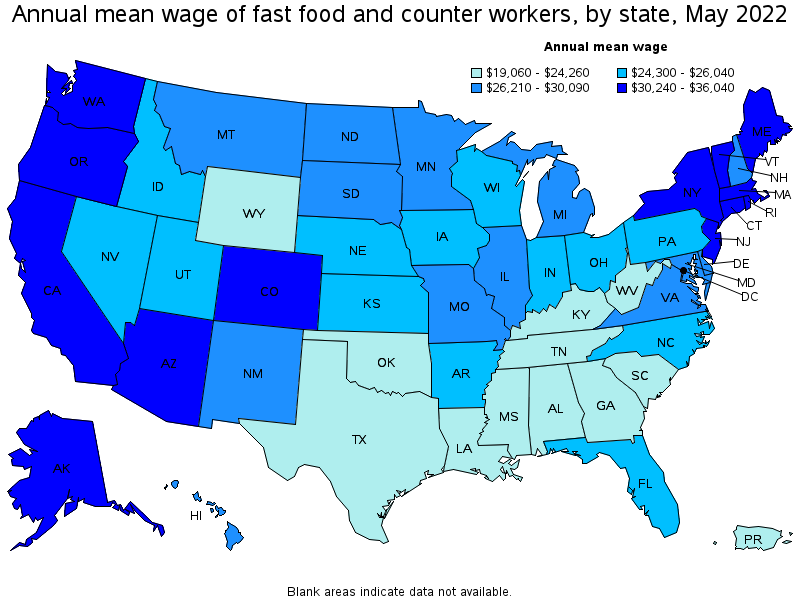
Top paying states for Fast Food and Counter Workers:
| State | Employment (1) | Employment per thousand jobs | Location quotient (9) | Hourly mean wage | Annual mean wage (2) |
|---|---|---|---|---|---|
| District of Columbia | 6,210 | 9.00 | 0.40 | $ 17.33 | $ 36,040 |
| Washington | 98,870 | 29.03 | 1.29 | $ 16.81 | $ 34,960 |
| California | 394,660 | 22.38 | 1.00 | $ 16.60 | $ 34,530 |
| Massachusetts | 86,230 | 24.18 | 1.08 | $ 16.12 | $ 33,520 |
| New York | 183,270 | 20.12 | 0.89 | $ 16.04 | $ 33,370 |
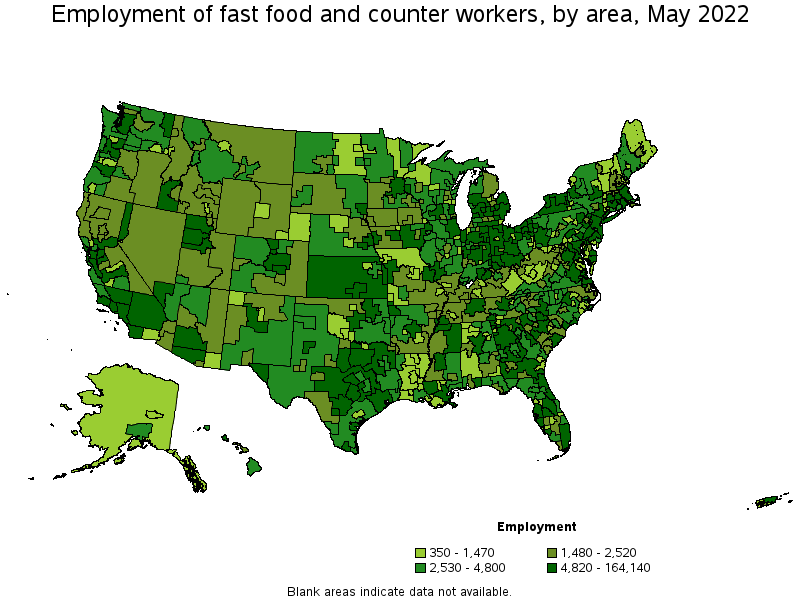
Metropolitan areas with the highest employment level in Fast Food and Counter Workers:
| Metropolitan area | Employment (1) | Employment per thousand jobs | Location quotient (9) | Hourly mean wage | Annual mean wage (2) |
|---|---|---|---|---|---|
| New York-Newark-Jersey City, NY-NJ-PA | 164,140 | 17.87 | 0.79 | $ 16.08 | $ 33,450 |
| Los Angeles-Long Beach-Anaheim, CA | 140,830 | 23.09 | 1.03 | $ 16.43 | $ 34,180 |
| Dallas-Fort Worth-Arlington, TX | 101,030 | 26.55 | 1.18 | $ 12.14 | $ 25,260 |
| Chicago-Naperville-Elgin, IL-IN-WI | 92,840 | 21.02 | 0.93 | $ 14.28 | $ 29,700 |
| Houston-The Woodlands-Sugar Land, TX | 68,660 | 22.48 | 1.00 | $ 11.74 | $ 24,420 |
| Atlanta-Sandy Springs-Roswell, GA | 62,470 | 22.90 | 1.02 | $ 11.65 | $ 24,230 |
| Philadelphia-Camden-Wilmington, PA-NJ-DE-MD | 61,140 | 22.07 | 0.98 | $ 13.26 | $ 27,570 |
| Boston-Cambridge-Nashua, MA-NH | 60,330 | 22.31 | 0.99 | $ 16.22 | $ 33,730 |
| Phoenix-Mesa-Scottsdale, AZ | 58,120 | 26.18 | 1.16 | $ 15.53 | $ 32,300 |
| Washington-Arlington-Alexandria, DC-VA-MD-WV | 56,650 | 18.71 | 0.83 | $ 15.12 | $ 31,440 |
Metropolitan areas with the highest concentration of jobs and location quotients in Fast Food and Counter Workers:
| Metropolitan area | Employment (1) | Employment per thousand jobs | Location quotient (9) | Hourly mean wage | Annual mean wage (2) |
|---|---|---|---|---|---|
| Flagstaff, AZ | 3,300 | 53.42 | 2.38 | $ 14.46 | $ 30,070 |
| Lake Havasu City-Kingman, AZ | 2,760 | 50.74 | 2.26 | $ 14.12 | $ 29,360 |
| Muskegon, MI | 2,900 | 47.54 | 2.11 | $ 12.62 | $ 26,250 |
| Bay City, MI | 1,530 | 45.39 | 2.02 | $ 12.33 | $ 25,640 |
| Lawrence, KS | 2,160 | 44.43 | 1.98 | $ 11.39 | $ 23,680 |
| Muncie, IN | 1,920 | 43.42 | 1.93 | $ 11.42 | $ 23,750 |
| Kokomo, IN | 1,480 | 42.42 | 1.89 | $ 12.15 | $ 25,280 |
| Grants Pass, OR | 1,190 | 40.99 | 1.82 | $ 14.26 | $ 29,670 |
| Rapid City, SD | 2,790 | 39.92 | 1.78 | $ 12.73 | $ 26,480 |
| Valdosta, GA | 2,090 | 39.31 | 1.75 | $ 10.06 | $ 20,920 |
Top paying metropolitan areas for Fast Food and Counter Workers:
| Metropolitan area | Employment (1) | Employment per thousand jobs | Location quotient (9) | Hourly mean wage | Annual mean wage (2) |
|---|---|---|---|---|---|
| San Jose-Sunnyvale-Santa Clara, CA | 18,620 | 16.58 | 0.74 | $ 18.80 | $ 39,110 |
| San Francisco-Oakland-Hayward, CA | 43,310 | 18.10 | 0.80 | $ 18.38 | $ 38,220 |
| Seattle-Tacoma-Bellevue, WA | 54,880 | 26.93 | 1.20 | $ 17.49 | $ 36,370 |
| Napa, CA | 1,400 | 18.93 | 0.84 | $ 17.32 | $ 36,020 |
| Santa Rosa, CA | 4,430 | 21.81 | 0.97 | $ 17.13 | $ 35,620 |
| Vallejo-Fairfield, CA | 3,880 | 28.17 | 1.25 | $ 16.86 | $ 35,060 |
| Salinas, CA | 4,060 | 22.36 | 0.99 | $ 16.62 | $ 34,570 |
| Santa Cruz-Watsonville, CA | 2,660 | 27.51 | 1.22 | $ 16.53 | $ 34,380 |
| Barnstable Town, MA | 3,300 | 32.96 | 1.47 | $ 16.47 | $ 34,270 |
| Kennewick-Richland, WA | 4,240 | 34.84 | 1.55 | $ 16.47 | $ 34,250 |
Nonmetropolitan areas with the highest employment in Fast Food and Counter Workers:
| Nonmetropolitan area | Employment (1) | Employment per thousand jobs | Location quotient (9) | Hourly mean wage | Annual mean wage (2) |
|---|---|---|---|---|---|
| Kansas nonmetropolitan area | 9,570 | 24.97 | 1.11 | $ 11.21 | $ 23,320 |
| North Northeastern Ohio nonmetropolitan area (noncontiguous) | 8,300 | 25.79 | 1.15 | $ 11.43 | $ 23,770 |
| Balance of Lower Peninsula of Michigan nonmetropolitan area | 7,140 | 27.23 | 1.21 | $ 12.75 | $ 26,520 |
| North Texas Region of Texas nonmetropolitan area | 7,140 | 26.08 | 1.16 | $ 10.61 | $ 22,070 |
| Hill Country Region of Texas nonmetropolitan area | 6,350 | 32.51 | 1.45 | $ 10.84 | $ 22,550 |
Nonmetropolitan areas with the highest concentration of jobs and location quotients in Fast Food and Counter Workers:
| Nonmetropolitan area | Employment (1) | Employment per thousand jobs | Location quotient (9) | Hourly mean wage | Annual mean wage (2) |
|---|---|---|---|---|---|
| Central Utah nonmetropolitan area | 2,160 | 38.99 | 1.73 | $ 11.83 | $ 24,610 |
| Middle Georgia nonmetropolitan area | 4,850 | 38.09 | 1.69 | $ 10.66 | $ 22,170 |
| Hawaii / Kauai nonmetropolitan area | 3,560 | 36.45 | 1.62 | $ 13.87 | $ 28,860 |
| Western Washington nonmetropolitan area | 4,470 | 35.71 | 1.59 | $ 16.02 | $ 33,330 |
| North Arkansas nonmetropolitan area | 4,110 | 35.27 | 1.57 | $ 12.22 | $ 25,410 |
Top paying nonmetropolitan areas for Fast Food and Counter Workers:
| Nonmetropolitan area | Employment (1) | Employment per thousand jobs | Location quotient (9) | Hourly mean wage | Annual mean wage (2) |
|---|---|---|---|---|---|
| Massachusetts nonmetropolitan area | 1,840 | 29.95 | 1.33 | $ 16.72 | $ 34,770 |
| Eastern Sierra-Mother Lode Region of California nonmetropolitan area | 1,780 | 29.30 | 1.30 | $ 16.14 | $ 33,560 |
| North Coast Region of California nonmetropolitan area | 2,440 | 23.43 | 1.04 | $ 16.08 | $ 33,440 |
| Western Washington nonmetropolitan area | 4,470 | 35.71 | 1.59 | $ 16.02 | $ 33,330 |
| North Valley-Northern Mountains Region of California nonmetropolitan area | 2,370 | 23.47 | 1.04 | $ 15.93 | $ 33,140 |
These estimates are calculated with data collected from employers in all industry sectors, all metropolitan and nonmetropolitan areas, and all states and the District of Columbia. The top employment and wage figures are provided above. The complete list is available in the downloadable XLS files.
The percentile wage estimate is the value of a wage below which a certain percent of workers fall. The median wage is the 50th percentile wage estimate—50 percent of workers earn less than the median and 50 percent of workers earn more than the median. More about percentile wages.
(1) Estimates for detailed occupations do not sum to the totals because the totals include occupations not shown separately. Estimates do not include self-employed workers.
(2) Annual wages have been calculated by multiplying the hourly mean wage by a "year-round, full-time" hours figure of 2,080 hours; for those occupations where there is not an hourly wage published, the annual wage has been directly calculated from the reported survey data.
(3) The relative standard error (RSE) is a measure of the reliability of a survey statistic. The smaller the relative standard error, the more precise the estimate.
(8) Estimate not released.
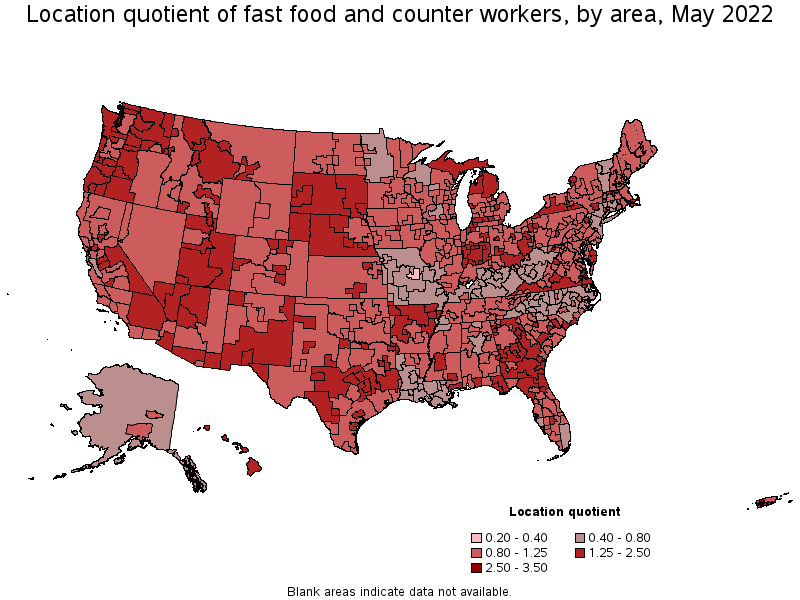
(9) The location quotient is the ratio of the area concentration of occupational employment to the national average concentration. A location quotient greater than one indicates the occupation has a higher share of employment than average, and a location quotient less than one indicates the occupation is less prevalent in the area than average.
Other OEWS estimates and related information:
May 2022 National Occupational Employment and Wage Estimates
May 2022 State Occupational Employment and Wage Estimates
May 2022 Metropolitan and Nonmetropolitan Area Occupational Employment and Wage Estimates
May 2022 National Industry-Specific Occupational Employment and Wage Estimates
Last Modified Date: April 25, 2023