
An official website of the United States government
An official website of the United States government
The .gov means it's official.
Federal government websites often end in .gov or .mil. Before sharing sensitive information,
make sure you're on a federal government site.
The site is secure.
The
https:// ensures that you are connecting to the official website and that any
information you provide is encrypted and transmitted securely.
Supervise and coordinate activities of personal service workers.
Employment estimate and mean wage estimates for First-Line Supervisors of Personal Service Workers:
| Employment (1) | Employment RSE (3) |
Mean hourly wage |
Mean annual wage (2) |
Wage RSE (3) |
|---|---|---|---|---|
| 104,480 | 1.4 % | $ 22.75 | $ 47,330 | 0.6 % |
Percentile wage estimates for First-Line Supervisors of Personal Service Workers:
| Percentile | 10% | 25% | 50% (Median) |
75% | 90% |
|---|---|---|---|---|---|
| Hourly Wage | $ 13.98 | $ 16.90 | $ 21.00 | $ 26.77 | $ 33.50 |
| Annual Wage (2) | $ 29,070 | $ 35,140 | $ 43,680 | $ 55,680 | $ 69,690 |
Industries with the highest published employment and wages for First-Line Supervisors of Personal Service Workers are provided. For a list of all industries with employment in First-Line Supervisors of Personal Service Workers, see the Create Customized Tables function.
Industries with the highest levels of employment in First-Line Supervisors of Personal Service Workers:
| Industry | Employment (1) | Percent of industry employment | Hourly mean wage | Annual mean wage (2) |
|---|---|---|---|---|
| Personal Care Services | 24,450 | 3.45 | $ 22.22 | $ 46,210 |
| Other Personal Services | 11,060 | 3.03 | $ 21.38 | $ 44,460 |
| Child Care Services | 10,480 | 1.20 | $ 18.86 | $ 39,240 |
| Other Amusement and Recreation Industries | 7,820 | 0.62 | $ 23.11 | $ 48,070 |
| Individual and Family Services | 5,240 | 0.18 | $ 22.82 | $ 47,460 |
Industries with the highest concentration of employment in First-Line Supervisors of Personal Service Workers:
| Industry | Employment (1) | Percent of industry employment | Hourly mean wage | Annual mean wage (2) |
|---|---|---|---|---|
| Personal Care Services | 24,450 | 3.45 | $ 22.22 | $ 46,210 |
| Other Personal Services | 11,060 | 3.03 | $ 21.38 | $ 44,460 |
| Other Residential Care Facilities | 1,930 | 1.29 | $ 22.11 | $ 45,980 |
| Child Care Services | 10,480 | 1.20 | $ 18.86 | $ 39,240 |
| Civic and Social Organizations | 2,360 | 0.79 | $ 21.16 | $ 44,010 |
Top paying industries for First-Line Supervisors of Personal Service Workers:
| Industry | Employment (1) | Percent of industry employment | Hourly mean wage | Annual mean wage (2) |
|---|---|---|---|---|
| Gambling Industries | 300 | 0.15 | $ 35.59 | $ 74,020 |
| Death Care Services | 570 | 0.41 | $ 31.53 | $ 65,580 |
| Colleges, Universities, and Professional Schools | 1,890 | 0.06 | $ 31.10 | $ 64,680 |
| Office Administrative Services | 140 | 0.03 | $ 29.27 | $ 60,870 |
| Local Government, excluding schools and hospitals (OEWS Designation) | 2,610 | 0.05 | $ 29.06 | $ 60,440 |
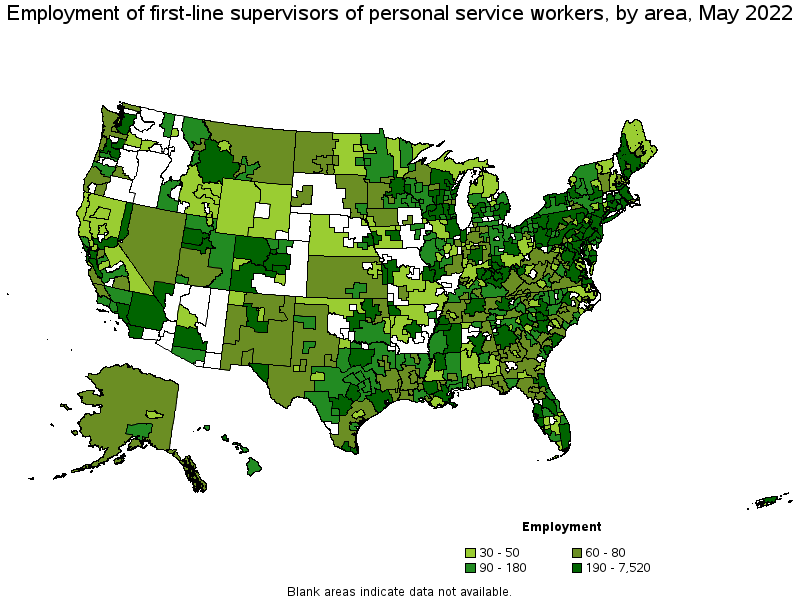
States and areas with the highest published employment, location quotients, and wages for First-Line Supervisors of Personal Service Workers are provided. For a list of all areas with employment in First-Line Supervisors of Personal Service Workers, see the Create Customized Tables function.
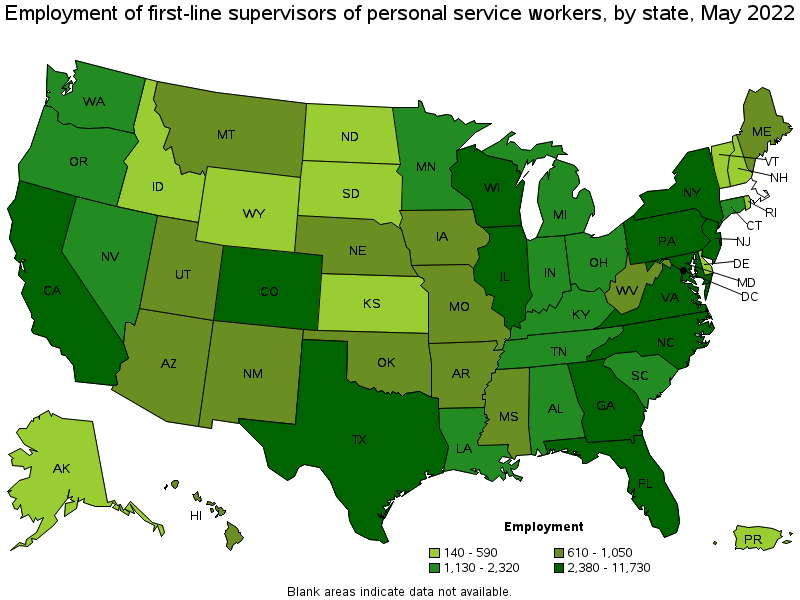
States with the highest employment level in First-Line Supervisors of Personal Service Workers:
| State | Employment (1) | Employment per thousand jobs | Location quotient (9) | Hourly mean wage | Annual mean wage (2) |
|---|---|---|---|---|---|
| Texas | 11,730 | 0.90 | 1.28 | $ 19.98 | $ 41,560 |
| California | 8,620 | 0.49 | 0.69 | $ 25.78 | $ 53,610 |
| Pennsylvania | 7,510 | 1.29 | 1.83 | $ 21.46 | $ 44,640 |
| New York | 6,650 | 0.73 | 1.03 | $ 28.68 | $ 59,660 |
| Florida | 6,160 | 0.67 | 0.95 | $ 23.16 | $ 48,160 |
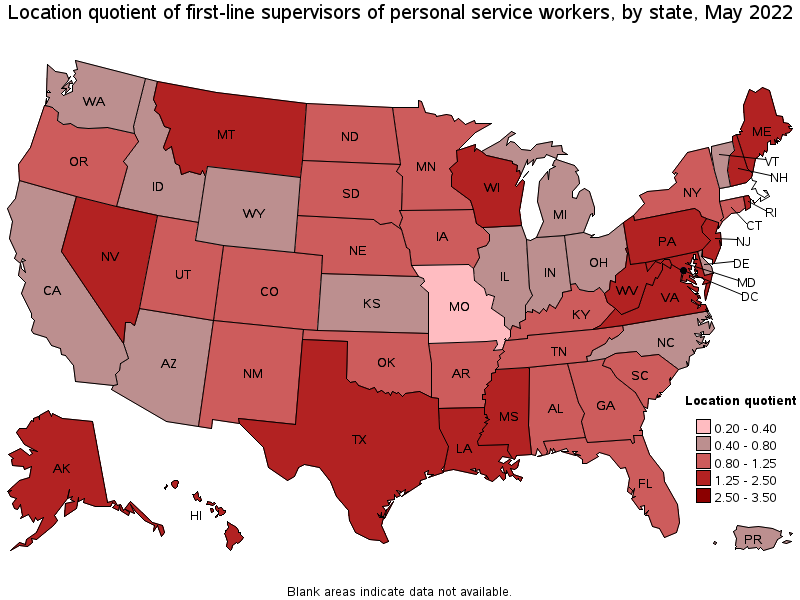
States with the highest concentration of jobs and location quotients in First-Line Supervisors of Personal Service Workers:
| State | Employment (1) | Employment per thousand jobs | Location quotient (9) | Hourly mean wage | Annual mean wage (2) |
|---|---|---|---|---|---|
| Wisconsin | 4,250 | 1.51 | 2.13 | $ 22.08 | $ 45,920 |
| Maryland | 3,570 | 1.35 | 1.91 | $ 23.64 | $ 49,170 |
| Pennsylvania | 7,510 | 1.29 | 1.83 | $ 21.46 | $ 44,640 |
| Montana | 610 | 1.25 | 1.77 | $ 19.31 | $ 40,160 |
| Hawaii | 660 | 1.11 | 1.57 | $ 25.59 | $ 53,220 |
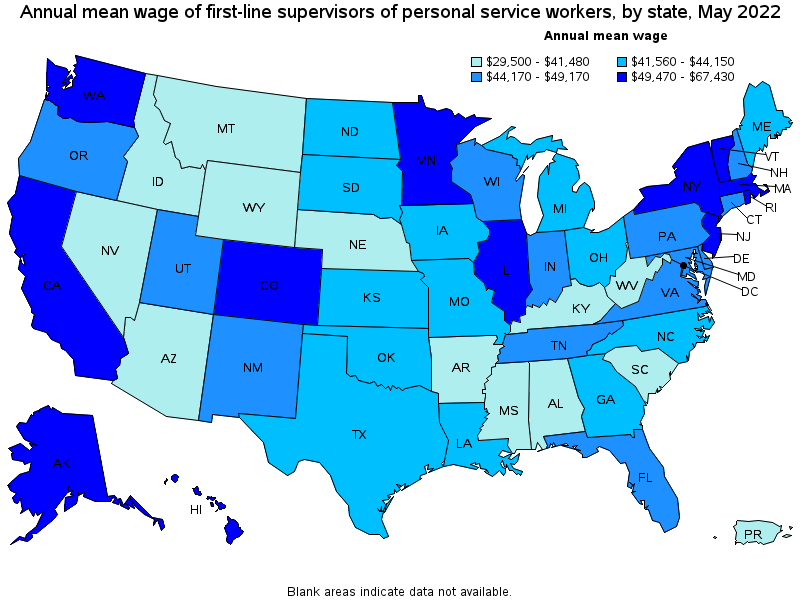
Top paying states for First-Line Supervisors of Personal Service Workers:
| State | Employment (1) | Employment per thousand jobs | Location quotient (9) | Hourly mean wage | Annual mean wage (2) |
|---|---|---|---|---|---|
| District of Columbia | 180 | 0.27 | 0.38 | $ 32.42 | $ 67,430 |
| Massachusetts | (8) | (8) | (8) | $ 29.30 | $ 60,940 |
| Washington | 1,850 | 0.54 | 0.77 | $ 28.89 | $ 60,080 |
| New York | 6,650 | 0.73 | 1.03 | $ 28.68 | $ 59,660 |
| Alaska | 280 | 0.91 | 1.29 | $ 28.62 | $ 59,540 |
Metropolitan areas with the highest employment level in First-Line Supervisors of Personal Service Workers:
| Metropolitan area | Employment (1) | Employment per thousand jobs | Location quotient (9) | Hourly mean wage | Annual mean wage (2) |
|---|---|---|---|---|---|
| New York-Newark-Jersey City, NY-NJ-PA | 7,520 | 0.82 | 1.16 | $ 28.59 | $ 59,470 |
| Philadelphia-Camden-Wilmington, PA-NJ-DE-MD | 3,340 | 1.21 | 1.71 | $ 22.85 | $ 47,530 |
| Dallas-Fort Worth-Arlington, TX | 3,320 | 0.87 | 1.24 | $ 19.92 | $ 41,440 |
| Los Angeles-Long Beach-Anaheim, CA | 2,990 | 0.49 | 0.69 | $ 25.20 | $ 52,410 |
| Houston-The Woodlands-Sugar Land, TX | 2,970 | 0.97 | 1.38 | $ 20.29 | $ 42,200 |
| Washington-Arlington-Alexandria, DC-VA-MD-WV | 2,730 | 0.90 | 1.28 | $ 26.01 | $ 54,090 |
| Atlanta-Sandy Springs-Roswell, GA | 2,260 | 0.83 | 1.17 | $ 21.68 | $ 45,090 |
| Chicago-Naperville-Elgin, IL-IN-WI | 1,970 | 0.45 | 0.63 | $ 24.65 | $ 51,260 |
| Baltimore-Columbia-Towson, MD | 1,780 | 1.38 | 1.95 | $ 22.59 | $ 46,980 |
| San Francisco-Oakland-Hayward, CA | 1,670 | 0.70 | 0.99 | $ 28.86 | $ 60,030 |
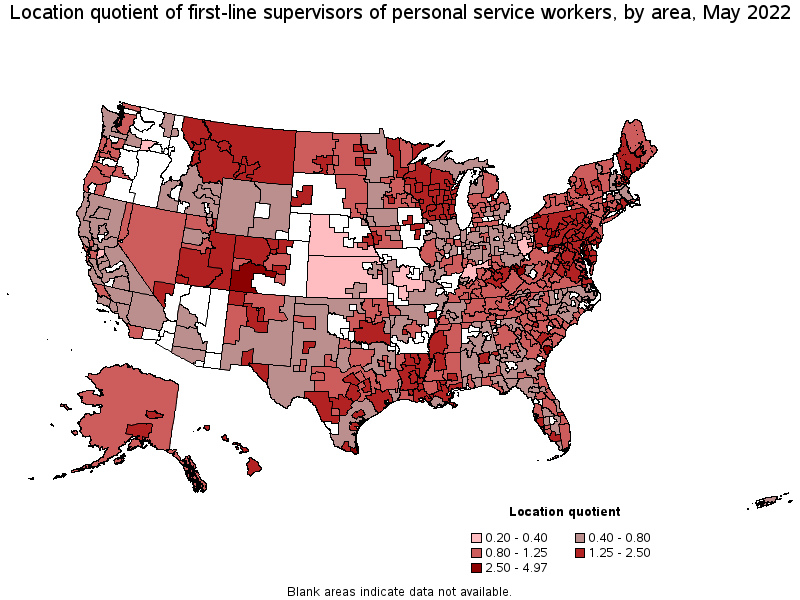
Metropolitan areas with the highest concentration of jobs and location quotients in First-Line Supervisors of Personal Service Workers:
| Metropolitan area | Employment (1) | Employment per thousand jobs | Location quotient (9) | Hourly mean wage | Annual mean wage (2) |
|---|---|---|---|---|---|
| Ocean City, NJ | 140 | 3.51 | 4.97 | $ 28.75 | $ 59,790 |
| Johnstown, PA | 150 | 3.08 | 4.36 | $ 17.64 | $ 36,700 |
| Hilton Head Island-Bluffton-Beaufort, SC | 230 | 2.90 | 4.10 | $ 18.09 | $ 37,630 |
| Huntington-Ashland, WV-KY-OH | 320 | 2.53 | 3.58 | $ 17.86 | $ 37,140 |
| Cumberland, MD-WV | 80 | 2.32 | 3.28 | $ 20.78 | $ 43,210 |
| Erie, PA | 240 | 2.05 | 2.90 | $ 20.30 | $ 42,220 |
| Brownsville-Harlingen, TX | 270 | 1.81 | 2.56 | $ 18.88 | $ 39,270 |
| Reading, PA | 290 | 1.75 | 2.47 | $ 20.93 | $ 43,540 |
| La Crosse-Onalaska, WI-MN | 130 | 1.75 | 2.47 | $ 22.23 | $ 46,240 |
| Madison, WI | 660 | 1.70 | 2.40 | $ 22.62 | $ 47,060 |
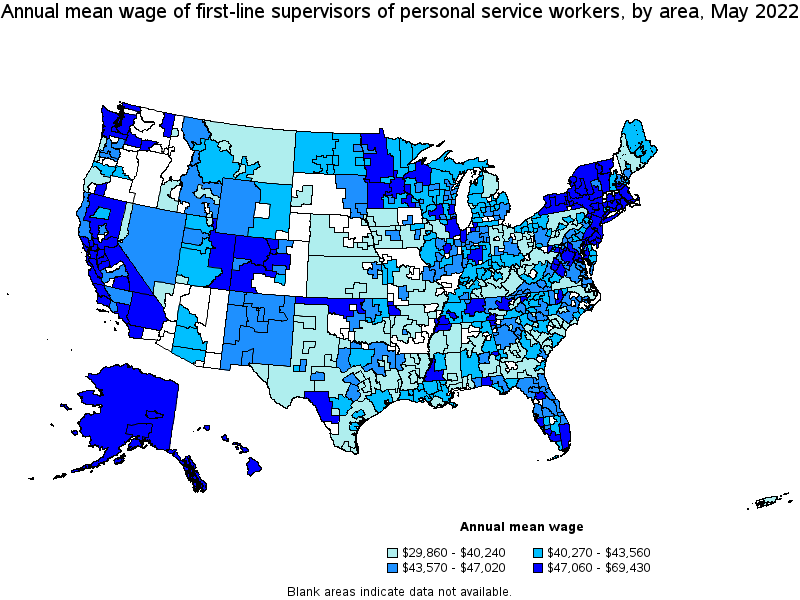
Top paying metropolitan areas for First-Line Supervisors of Personal Service Workers:
| Metropolitan area | Employment (1) | Employment per thousand jobs | Location quotient (9) | Hourly mean wage | Annual mean wage (2) |
|---|---|---|---|---|---|
| Fairbanks, AK | 40 | 1.07 | 1.51 | $ 33.38 | $ 69,430 |
| Santa Rosa, CA | 90 | 0.46 | 0.65 | $ 32.44 | $ 67,460 |
| North Port-Sarasota-Bradenton, FL | 520 | 1.67 | 2.36 | $ 30.84 | $ 64,140 |
| Seattle-Tacoma-Bellevue, WA | 1,220 | 0.60 | 0.85 | $ 30.32 | $ 63,060 |
| Boston-Cambridge-Nashua, MA-NH | 1,360 | 0.50 | 0.71 | $ 29.34 | $ 61,030 |
| San Francisco-Oakland-Hayward, CA | 1,670 | 0.70 | 0.99 | $ 28.86 | $ 60,030 |
| Barnstable Town, MA | 70 | 0.74 | 1.04 | $ 28.76 | $ 59,810 |
| San Jose-Sunnyvale-Santa Clara, CA | 330 | 0.29 | 0.41 | $ 28.75 | $ 59,800 |
| Ocean City, NJ | 140 | 3.51 | 4.97 | $ 28.75 | $ 59,790 |
| New York-Newark-Jersey City, NY-NJ-PA | 7,520 | 0.82 | 1.16 | $ 28.59 | $ 59,470 |
Nonmetropolitan areas with the highest employment in First-Line Supervisors of Personal Service Workers:
| Nonmetropolitan area | Employment (1) | Employment per thousand jobs | Location quotient (9) | Hourly mean wage | Annual mean wage (2) |
|---|---|---|---|---|---|
| South Central Wisconsin nonmetropolitan area | 310 | 1.53 | 2.16 | $ 20.25 | $ 42,130 |
| Northeastern Wisconsin nonmetropolitan area | 260 | 1.36 | 1.92 | $ 20.37 | $ 42,360 |
| Southern Pennsylvania nonmetropolitan area | 240 | 1.30 | 1.84 | $ 19.11 | $ 39,740 |
| Western Pennsylvania nonmetropolitan area | 220 | 1.58 | 2.24 | $ 19.63 | $ 40,840 |
| Southwest Montana nonmetropolitan area | 210 | 1.42 | 2.01 | $ 19.72 | $ 41,020 |
Nonmetropolitan areas with the highest concentration of jobs and location quotients in First-Line Supervisors of Personal Service Workers:
| Nonmetropolitan area | Employment (1) | Employment per thousand jobs | Location quotient (9) | Hourly mean wage | Annual mean wage (2) |
|---|---|---|---|---|---|
| Southwest Colorado nonmetropolitan area | 190 | 1.89 | 2.67 | $ 25.82 | $ 53,700 |
| Maryland nonmetropolitan area | 100 | 1.77 | 2.51 | $ 23.61 | $ 49,110 |
| Northeast Louisiana nonmetropolitan area | 100 | 1.59 | 2.25 | $ 17.26 | $ 35,910 |
| Western Pennsylvania nonmetropolitan area | 220 | 1.58 | 2.24 | $ 19.63 | $ 40,840 |
| Northwest Colorado nonmetropolitan area | 190 | 1.55 | 2.20 | $ 26.31 | $ 54,720 |
Top paying nonmetropolitan areas for First-Line Supervisors of Personal Service Workers:
| Nonmetropolitan area | Employment (1) | Employment per thousand jobs | Location quotient (9) | Hourly mean wage | Annual mean wage (2) |
|---|---|---|---|---|---|
| Eastern Utah nonmetropolitan area | 110 | 1.28 | 1.81 | $ 28.01 | $ 58,250 |
| Alaska nonmetropolitan area | 80 | 0.74 | 1.05 | $ 27.31 | $ 56,800 |
| Southern Vermont nonmetropolitan area | 80 | 0.79 | 1.12 | $ 26.78 | $ 55,700 |
| Northwest Colorado nonmetropolitan area | 190 | 1.55 | 2.20 | $ 26.31 | $ 54,720 |
| Southwest Colorado nonmetropolitan area | 190 | 1.89 | 2.67 | $ 25.82 | $ 53,700 |
These estimates are calculated with data collected from employers in all industry sectors, all metropolitan and nonmetropolitan areas, and all states and the District of Columbia. The top employment and wage figures are provided above. The complete list is available in the downloadable XLS files.
The percentile wage estimate is the value of a wage below which a certain percent of workers fall. The median wage is the 50th percentile wage estimate—50 percent of workers earn less than the median and 50 percent of workers earn more than the median. More about percentile wages.
(1) Estimates for detailed occupations do not sum to the totals because the totals include occupations not shown separately. Estimates do not include self-employed workers.
(2) Annual wages have been calculated by multiplying the hourly mean wage by a "year-round, full-time" hours figure of 2,080 hours; for those occupations where there is not an hourly wage published, the annual wage has been directly calculated from the reported survey data.
(3) The relative standard error (RSE) is a measure of the reliability of a survey statistic. The smaller the relative standard error, the more precise the estimate.
(8) Estimate not released.
(9) The location quotient is the ratio of the area concentration of occupational employment to the national average concentration. A location quotient greater than one indicates the occupation has a higher share of employment than average, and a location quotient less than one indicates the occupation is less prevalent in the area than average.
Other OEWS estimates and related information:
May 2022 National Occupational Employment and Wage Estimates
May 2022 State Occupational Employment and Wage Estimates
May 2022 Metropolitan and Nonmetropolitan Area Occupational Employment and Wage Estimates
May 2022 National Industry-Specific Occupational Employment and Wage Estimates
Last Modified Date: April 25, 2023