
An official website of the United States government
An official website of the United States government
The .gov means it's official.
Federal government websites often end in .gov or .mil. Before sharing sensitive information,
make sure you're on a federal government site.
The site is secure.
The
https:// ensures that you are connecting to the official website and that any
information you provide is encrypted and transmitted securely.
Compile and record employee time and payroll data. May compute employees� time worked, production, and commission. May compute and post wages and deductions, or prepare paychecks. Excludes �Bookkeeping, Accounting, and Auditing Clerks� (43-3031).
Employment estimate and mean wage estimates for Payroll and Timekeeping Clerks:
| Employment (1) | Employment RSE (3) |
Mean hourly wage |
Mean annual wage (2) |
Wage RSE (3) |
|---|---|---|---|---|
| 159,190 | 1.3 % | $ 25.14 | $ 52,300 | 0.4 % |
Percentile wage estimates for Payroll and Timekeeping Clerks:
| Percentile | 10% | 25% | 50% (Median) |
75% | 90% |
|---|---|---|---|---|---|
| Hourly Wage | $ 16.45 | $ 19.46 | $ 23.86 | $ 29.41 | $ 35.37 |
| Annual Wage (2) | $ 34,220 | $ 40,470 | $ 49,630 | $ 61,170 | $ 73,580 |
Industries with the highest published employment and wages for Payroll and Timekeeping Clerks are provided. For a list of all industries with employment in Payroll and Timekeeping Clerks, see the Create Customized Tables function.
Industries with the highest levels of employment in Payroll and Timekeeping Clerks:
| Industry | Employment (1) | Percent of industry employment | Hourly mean wage | Annual mean wage (2) |
|---|---|---|---|---|
| Accounting, Tax Preparation, Bookkeeping, and Payroll Services | 18,200 | 1.73 | $ 23.20 | $ 48,260 |
| Management of Companies and Enterprises | 14,280 | 0.53 | $ 27.11 | $ 56,390 |
| Employment Services | 13,280 | 0.34 | $ 23.66 | $ 49,210 |
| Elementary and Secondary Schools | 8,610 | 0.10 | $ 25.46 | $ 52,950 |
| Local Government, excluding schools and hospitals (OEWS Designation) | 6,770 | 0.13 | $ 26.77 | $ 55,690 |
Industries with the highest concentration of employment in Payroll and Timekeeping Clerks:
| Industry | Employment (1) | Percent of industry employment | Hourly mean wage | Annual mean wage (2) |
|---|---|---|---|---|
| Accounting, Tax Preparation, Bookkeeping, and Payroll Services | 18,200 | 1.73 | $ 23.20 | $ 48,260 |
| Office Administrative Services | 4,250 | 0.80 | $ 25.58 | $ 53,200 |
| Interurban and Rural Bus Transportation | 90 | 0.63 | $ 23.55 | $ 48,980 |
| Management of Companies and Enterprises | 14,280 | 0.53 | $ 27.11 | $ 56,390 |
| Apparel Accessories and Other Apparel Manufacturing | 40 | 0.37 | $ 17.07 | $ 35,500 |
Top paying industries for Payroll and Timekeeping Clerks:
| Industry | Employment (1) | Percent of industry employment | Hourly mean wage | Annual mean wage (2) |
|---|---|---|---|---|
| Petroleum and Coal Products Manufacturing | 100 | 0.09 | $ 35.81 | $ 74,480 |
| Software Publishers | 310 | 0.05 | $ 35.62 | $ 74,080 |
| Scientific Research and Development Services | 460 | 0.05 | $ 34.33 | $ 71,410 |
| Electric Power Generation, Transmission and Distribution | 360 | 0.09 | $ 34.13 | $ 70,990 |
| Motor Vehicle Manufacturing | 130 | 0.05 | $ 34.13 | $ 70,980 |
States and areas with the highest published employment, location quotients, and wages for Payroll and Timekeeping Clerks are provided. For a list of all areas with employment in Payroll and Timekeeping Clerks, see the Create Customized Tables function.
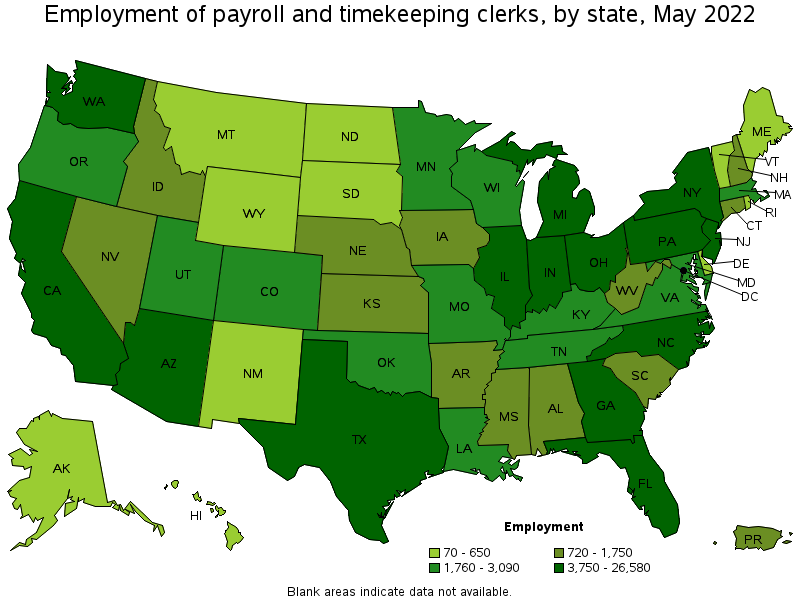
States with the highest employment level in Payroll and Timekeeping Clerks:
| State | Employment (1) | Employment per thousand jobs | Location quotient (9) | Hourly mean wage | Annual mean wage (2) |
|---|---|---|---|---|---|
| California | 26,580 | 1.51 | 1.40 | $ 28.20 | $ 58,650 |
| Texas | 14,390 | 1.11 | 1.03 | $ 23.44 | $ 48,750 |
| Florida | 9,990 | 1.09 | 1.01 | $ 23.14 | $ 48,130 |
| New York | 9,690 | 1.06 | 0.99 | $ 28.43 | $ 59,140 |
| Pennsylvania | 6,850 | 1.18 | 1.10 | $ 25.70 | $ 53,450 |
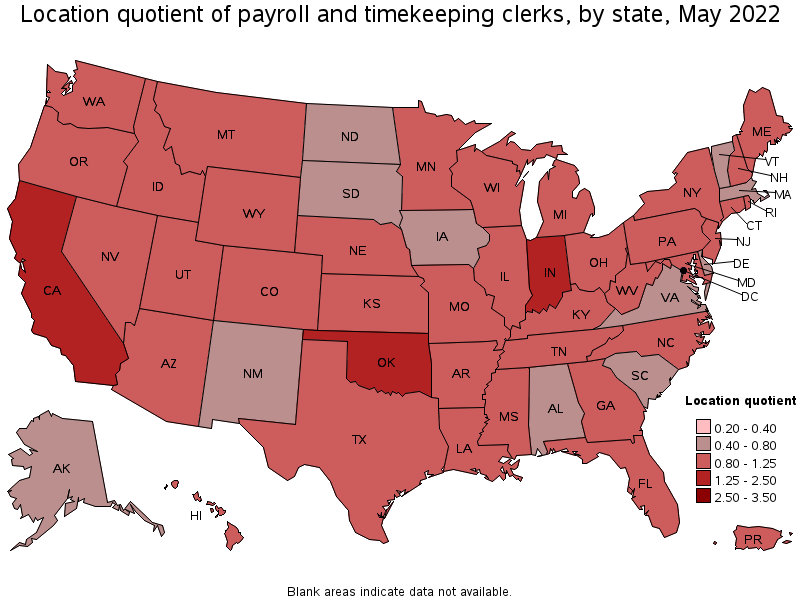
States with the highest concentration of jobs and location quotients in Payroll and Timekeeping Clerks:
| State | Employment (1) | Employment per thousand jobs | Location quotient (9) | Hourly mean wage | Annual mean wage (2) |
|---|---|---|---|---|---|
| California | 26,580 | 1.51 | 1.40 | $ 28.20 | $ 58,650 |
| Oklahoma | 2,400 | 1.49 | 1.39 | $ 21.64 | $ 45,010 |
| Indiana | 4,230 | 1.37 | 1.27 | $ 22.89 | $ 47,610 |
| New Hampshire | 860 | 1.31 | 1.21 | $ 25.10 | $ 52,210 |
| Arizona | 3,910 | 1.29 | 1.20 | $ 23.23 | $ 48,320 |
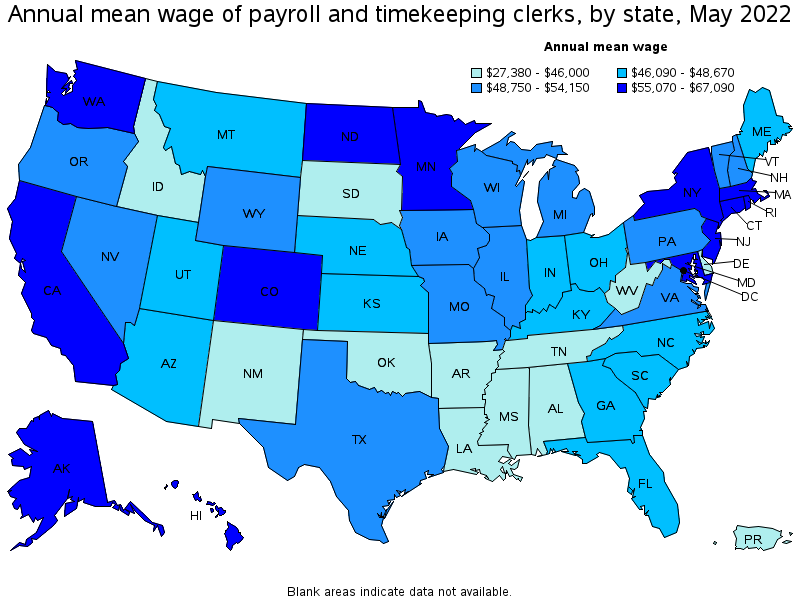
Top paying states for Payroll and Timekeeping Clerks:
| State | Employment (1) | Employment per thousand jobs | Location quotient (9) | Hourly mean wage | Annual mean wage (2) |
|---|---|---|---|---|---|
| District of Columbia | 410 | 0.59 | 0.55 | $ 32.25 | $ 67,090 |
| Rhode Island | 550 | 1.15 | 1.07 | $ 28.56 | $ 59,400 |
| Washington | 4,080 | 1.20 | 1.11 | $ 28.46 | $ 59,210 |
| New York | 9,690 | 1.06 | 0.99 | $ 28.43 | $ 59,140 |
| California | 26,580 | 1.51 | 1.40 | $ 28.20 | $ 58,650 |
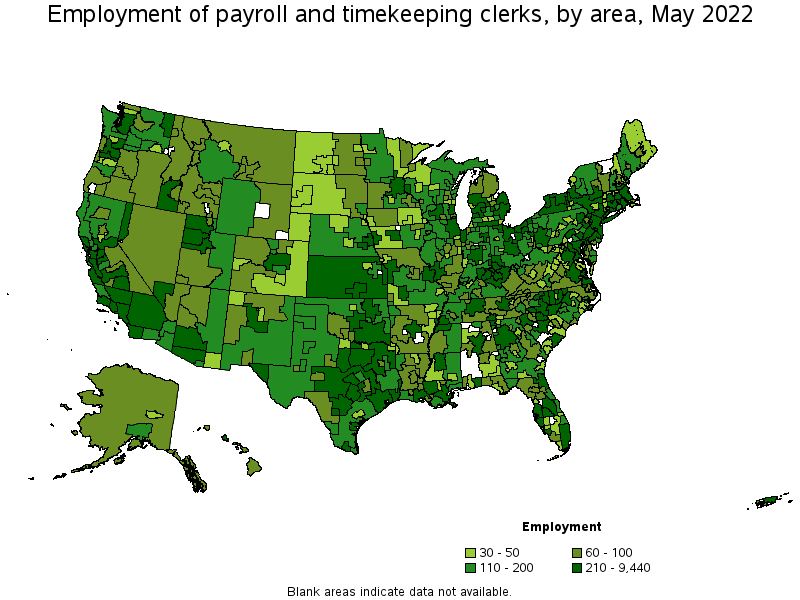
Metropolitan areas with the highest employment level in Payroll and Timekeeping Clerks:
| Metropolitan area | Employment (1) | Employment per thousand jobs | Location quotient (9) | Hourly mean wage | Annual mean wage (2) |
|---|---|---|---|---|---|
| Los Angeles-Long Beach-Anaheim, CA | 9,440 | 1.55 | 1.44 | $ 27.47 | $ 57,140 |
| New York-Newark-Jersey City, NY-NJ-PA | 9,070 | 0.99 | 0.92 | $ 29.79 | $ 61,970 |
| Chicago-Naperville-Elgin, IL-IN-WI | 4,660 | 1.06 | 0.98 | $ 26.73 | $ 55,600 |
| Dallas-Fort Worth-Arlington, TX | 4,060 | 1.07 | 0.99 | $ 24.51 | $ 50,980 |
| Philadelphia-Camden-Wilmington, PA-NJ-DE-MD | 3,510 | 1.27 | 1.18 | $ 27.96 | $ 58,150 |
| Houston-The Woodlands-Sugar Land, TX | 3,370 | 1.10 | 1.03 | $ 24.64 | $ 51,240 |
| San Francisco-Oakland-Hayward, CA | 3,030 | 1.26 | 1.18 | $ 33.81 | $ 70,330 |
| Phoenix-Mesa-Scottsdale, AZ | 2,940 | 1.32 | 1.23 | $ 23.90 | $ 49,710 |
| Miami-Fort Lauderdale-West Palm Beach, FL | 2,540 | 0.97 | 0.90 | $ 24.33 | $ 50,600 |
| Seattle-Tacoma-Bellevue, WA | 2,500 | 1.23 | 1.14 | $ 30.14 | $ 62,680 |
Metropolitan areas with the highest concentration of jobs and location quotients in Payroll and Timekeeping Clerks:
| Metropolitan area | Employment (1) | Employment per thousand jobs | Location quotient (9) | Hourly mean wage | Annual mean wage (2) |
|---|---|---|---|---|---|
| Sacramento--Roseville--Arden-Arcade, CA | 2,080 | 2.02 | 1.88 | $ 28.23 | $ 58,720 |
| Bakersfield, CA | 650 | 2.01 | 1.86 | $ 23.70 | $ 49,290 |
| Indianapolis-Carmel-Anderson, IN | 1,930 | 1.83 | 1.70 | $ 23.66 | $ 49,210 |
| Enid, OK | 40 | 1.80 | 1.67 | $ 21.18 | $ 44,050 |
| Pensacola-Ferry Pass-Brent, FL | 320 | 1.77 | 1.64 | $ 19.94 | $ 41,470 |
| El Centro, CA | 110 | 1.75 | 1.62 | $ 23.04 | $ 47,930 |
| Glens Falls, NY | 80 | 1.70 | 1.58 | $ 24.01 | $ 49,950 |
| Yuma, AZ | 110 | 1.70 | 1.58 | $ 19.05 | $ 39,630 |
| Laredo, TX | 170 | 1.66 | 1.54 | $ 18.10 | $ 37,640 |
| Napa, CA | 120 | 1.63 | 1.51 | $ 29.31 | $ 60,960 |
Top paying metropolitan areas for Payroll and Timekeeping Clerks:
| Metropolitan area | Employment (1) | Employment per thousand jobs | Location quotient (9) | Hourly mean wage | Annual mean wage (2) |
|---|---|---|---|---|---|
| San Francisco-Oakland-Hayward, CA | 3,030 | 1.26 | 1.18 | $ 33.81 | $ 70,330 |
| San Jose-Sunnyvale-Santa Clara, CA | 1,070 | 0.95 | 0.88 | $ 33.42 | $ 69,520 |
| Boulder, CO | 120 | 0.64 | 0.59 | $ 31.81 | $ 66,170 |
| Vallejo-Fairfield, CA | 200 | 1.44 | 1.34 | $ 30.68 | $ 63,810 |
| Santa Rosa, CA | 300 | 1.45 | 1.35 | $ 30.46 | $ 63,350 |
| Seattle-Tacoma-Bellevue, WA | 2,500 | 1.23 | 1.14 | $ 30.14 | $ 62,680 |
| Washington-Arlington-Alexandria, DC-VA-MD-WV | 1,800 | 0.59 | 0.55 | $ 29.92 | $ 62,230 |
| New York-Newark-Jersey City, NY-NJ-PA | 9,070 | 0.99 | 0.92 | $ 29.79 | $ 61,970 |
| Napa, CA | 120 | 1.63 | 1.51 | $ 29.31 | $ 60,960 |
| Bridgeport-Stamford-Norwalk, CT | 380 | 0.98 | 0.91 | $ 29.08 | $ 60,490 |
Nonmetropolitan areas with the highest employment in Payroll and Timekeeping Clerks:
| Nonmetropolitan area | Employment (1) | Employment per thousand jobs | Location quotient (9) | Hourly mean wage | Annual mean wage (2) |
|---|---|---|---|---|---|
| Kansas nonmetropolitan area | 380 | 1.00 | 0.93 | $ 20.51 | $ 42,660 |
| North Northeastern Ohio nonmetropolitan area (noncontiguous) | 310 | 0.97 | 0.90 | $ 20.84 | $ 43,350 |
| North Texas Region of Texas nonmetropolitan area | 310 | 1.13 | 1.05 | $ 22.41 | $ 46,620 |
| Piedmont North Carolina nonmetropolitan area | 270 | 1.07 | 1.00 | $ 20.93 | $ 43,540 |
| Southeast Oklahoma nonmetropolitan area | 260 | 1.57 | 1.46 | $ 20.75 | $ 43,150 |
Nonmetropolitan areas with the highest concentration of jobs and location quotients in Payroll and Timekeeping Clerks:
| Nonmetropolitan area | Employment (1) | Employment per thousand jobs | Location quotient (9) | Hourly mean wage | Annual mean wage (2) |
|---|---|---|---|---|---|
| Eastern Utah nonmetropolitan area | 140 | 1.66 | 1.54 | $ 22.64 | $ 47,100 |
| Southeast Oklahoma nonmetropolitan area | 260 | 1.57 | 1.46 | $ 20.75 | $ 43,150 |
| Northeast Oklahoma nonmetropolitan area | 180 | 1.56 | 1.45 | $ 20.86 | $ 43,390 |
| Central East New York nonmetropolitan area | 240 | 1.55 | 1.44 | $ 22.62 | $ 47,040 |
| Southwest Oklahoma nonmetropolitan area | 90 | 1.55 | 1.44 | $ 19.28 | $ 40,100 |
Top paying nonmetropolitan areas for Payroll and Timekeeping Clerks:
| Nonmetropolitan area | Employment (1) | Employment per thousand jobs | Location quotient (9) | Hourly mean wage | Annual mean wage (2) |
|---|---|---|---|---|---|
| Alaska nonmetropolitan area | 70 | 0.64 | 0.60 | $ 28.91 | $ 60,140 |
| Eastern Sierra-Mother Lode Region of California nonmetropolitan area | 80 | 1.34 | 1.25 | $ 28.70 | $ 59,690 |
| Northwest Colorado nonmetropolitan area | 70 | 0.56 | 0.52 | $ 28.32 | $ 58,900 |
| Hawaii / Kauai nonmetropolitan area | 70 | 0.71 | 0.66 | $ 27.42 | $ 57,040 |
| North Valley-Northern Mountains Region of California nonmetropolitan area | 140 | 1.35 | 1.26 | $ 27.19 | $ 56,550 |
These estimates are calculated with data collected from employers in all industry sectors, all metropolitan and nonmetropolitan areas, and all states and the District of Columbia. The top employment and wage figures are provided above. The complete list is available in the downloadable XLS files.
The percentile wage estimate is the value of a wage below which a certain percent of workers fall. The median wage is the 50th percentile wage estimate—50 percent of workers earn less than the median and 50 percent of workers earn more than the median. More about percentile wages.
(1) Estimates for detailed occupations do not sum to the totals because the totals include occupations not shown separately. Estimates do not include self-employed workers.
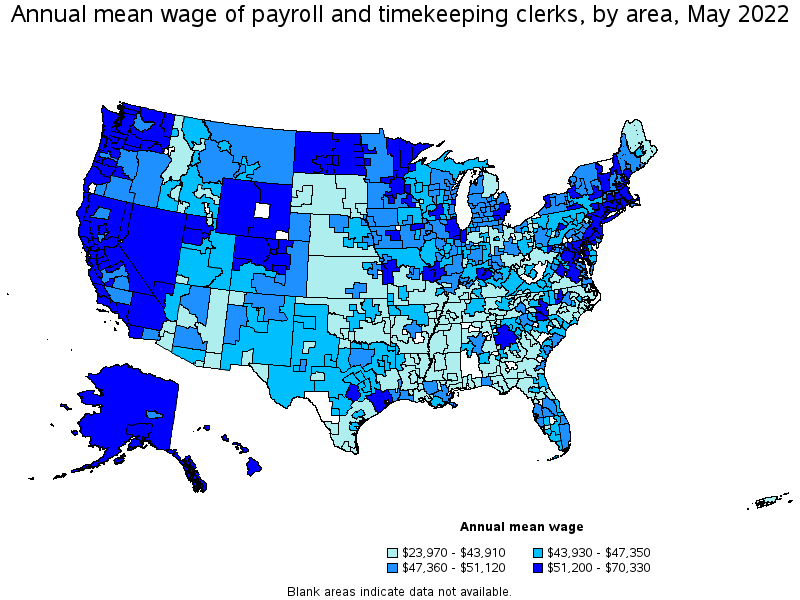
(2) Annual wages have been calculated by multiplying the hourly mean wage by a "year-round, full-time" hours figure of 2,080 hours; for those occupations where there is not an hourly wage published, the annual wage has been directly calculated from the reported survey data.
(3) The relative standard error (RSE) is a measure of the reliability of a survey statistic. The smaller the relative standard error, the more precise the estimate.
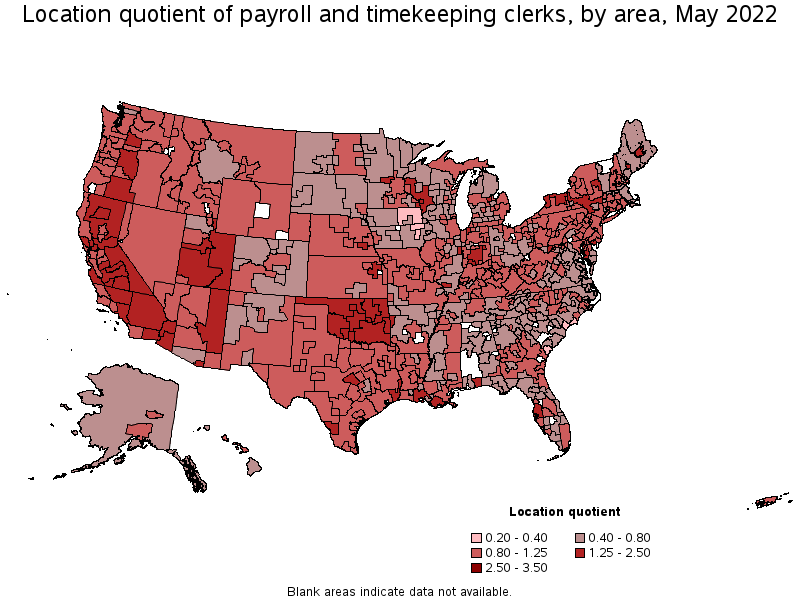
(9) The location quotient is the ratio of the area concentration of occupational employment to the national average concentration. A location quotient greater than one indicates the occupation has a higher share of employment than average, and a location quotient less than one indicates the occupation is less prevalent in the area than average.
Other OEWS estimates and related information:
May 2022 National Occupational Employment and Wage Estimates
May 2022 State Occupational Employment and Wage Estimates
May 2022 Metropolitan and Nonmetropolitan Area Occupational Employment and Wage Estimates
May 2022 National Industry-Specific Occupational Employment and Wage Estimates
Last Modified Date: April 25, 2023