
An official website of the United States government
An official website of the United States government
The .gov means it's official.
Federal government websites often end in .gov or .mil. Before sharing sensitive information,
make sure you're on a federal government site.
The site is secure.
The
https:// ensures that you are connecting to the official website and that any
information you provide is encrypted and transmitted securely.
Perform clerical duties for courts of law, municipalities, or governmental licensing agencies and bureaus. May prepare docket of cases to be called; secure information for judges and court; prepare draft agendas or bylaws for town or city council; answer official correspondence; keep fiscal records and accounts; issue licenses or permits; and record data, administer tests, or collect fees. Clerks of Court are classified in �Managers, All Other� (11-9199).
Employment estimate and mean wage estimates for Court, Municipal, and License Clerks:
| Employment (1) | Employment RSE (3) |
Mean hourly wage |
Mean annual wage (2) |
Wage RSE (3) |
|---|---|---|---|---|
| 159,760 | 0.8 % | $ 22.25 | $ 46,280 | 0.2 % |
Percentile wage estimates for Court, Municipal, and License Clerks:
| Percentile | 10% | 25% | 50% (Median) |
75% | 90% |
|---|---|---|---|---|---|
| Hourly Wage | $ 14.57 | $ 17.52 | $ 21.22 | $ 25.00 | $ 30.60 |
| Annual Wage (2) | $ 30,310 | $ 36,440 | $ 44,140 | $ 51,990 | $ 63,640 |
Industries with the highest published employment and wages for Court, Municipal, and License Clerks are provided. For a list of all industries with employment in Court, Municipal, and License Clerks, see the Create Customized Tables function.
Industries with the highest levels of employment in Court, Municipal, and License Clerks:
| Industry | Employment (1) | Percent of industry employment | Hourly mean wage | Annual mean wage (2) |
|---|---|---|---|---|
| Local Government, excluding schools and hospitals (OEWS Designation) | 116,410 | 2.17 | $ 21.98 | $ 45,730 |
| State Government, excluding schools and hospitals (OEWS Designation) | 40,430 | 1.90 | $ 23.47 | $ 48,810 |
| Other Support Services | 2,140 | 0.68 | $ 15.25 | $ 31,720 |
| Employment Services | 200 | 0.01 | $ 15.49 | $ 32,220 |
| Vocational Rehabilitation Services | 120 | 0.05 | $ 15.06 | $ 31,320 |
Industries with the highest concentration of employment in Court, Municipal, and License Clerks:
| Industry | Employment (1) | Percent of industry employment | Hourly mean wage | Annual mean wage (2) |
|---|---|---|---|---|
| Local Government, excluding schools and hospitals (OEWS Designation) | 116,410 | 2.17 | $ 21.98 | $ 45,730 |
| State Government, excluding schools and hospitals (OEWS Designation) | 40,430 | 1.90 | $ 23.47 | $ 48,810 |
| Other Support Services | 2,140 | 0.68 | $ 15.25 | $ 31,720 |
| Vocational Rehabilitation Services | 120 | 0.05 | $ 15.06 | $ 31,320 |
| Automobile Dealers | 70 | 0.01 | $ 18.62 | $ 38,730 |
Top paying industries for Court, Municipal, and License Clerks:
| Industry | Employment (1) | Percent of industry employment | Hourly mean wage | Annual mean wage (2) |
|---|---|---|---|---|
| State Government, excluding schools and hospitals (OEWS Designation) | 40,430 | 1.90 | $ 23.47 | $ 48,810 |
| Local Government, excluding schools and hospitals (OEWS Designation) | 116,410 | 2.17 | $ 21.98 | $ 45,730 |
| Elementary and Secondary Schools | 50 | (7) | $ 20.10 | $ 41,810 |
| Automobile Dealers | 70 | 0.01 | $ 18.62 | $ 38,730 |
| Individual and Family Services | 70 | (7) | $ 18.14 | $ 37,720 |
States and areas with the highest published employment, location quotients, and wages for Court, Municipal, and License Clerks are provided. For a list of all areas with employment in Court, Municipal, and License Clerks, see the Create Customized Tables function.
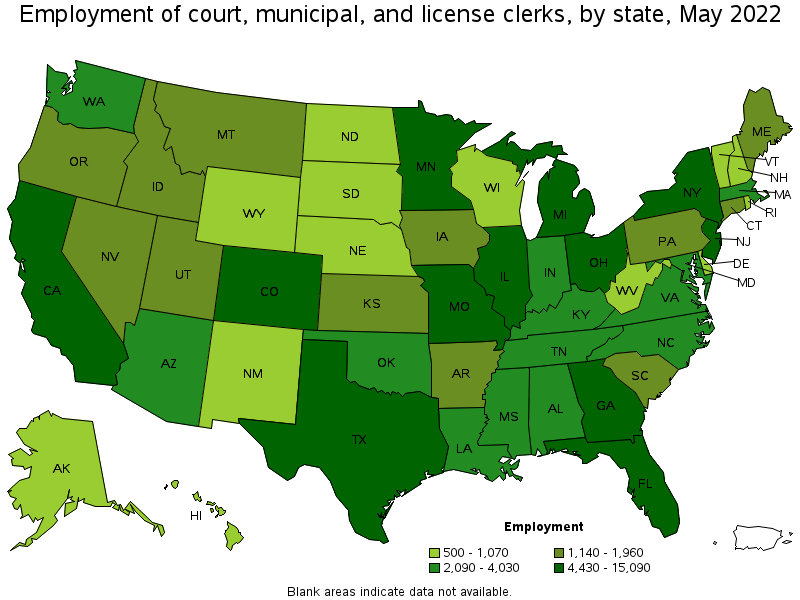
States with the highest employment level in Court, Municipal, and License Clerks:
| State | Employment (1) | Employment per thousand jobs | Location quotient (9) | Hourly mean wage | Annual mean wage (2) |
|---|---|---|---|---|---|
| Texas | 15,090 | 1.16 | 1.07 | $ 19.85 | $ 41,280 |
| California | 12,620 | 0.72 | 0.66 | $ 27.25 | $ 56,670 |
| Florida | 10,800 | 1.17 | 1.09 | $ 20.51 | $ 42,660 |
| New York | 10,060 | 1.10 | 1.02 | $ 28.89 | $ 60,080 |
| Ohio | 9,860 | 1.83 | 1.70 | $ 20.79 | $ 43,230 |
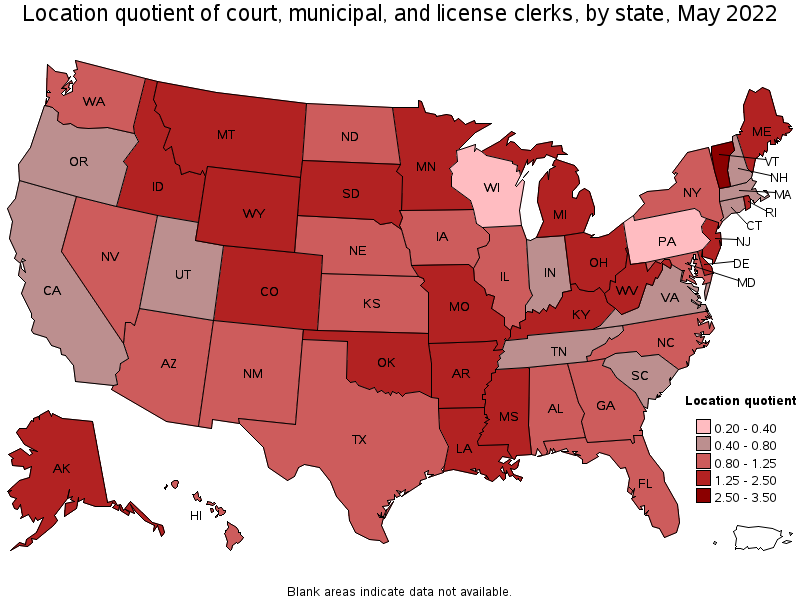
States with the highest concentration of jobs and location quotients in Court, Municipal, and License Clerks:
| State | Employment (1) | Employment per thousand jobs | Location quotient (9) | Hourly mean wage | Annual mean wage (2) |
|---|---|---|---|---|---|
| Vermont | 910 | 3.09 | 2.86 | $ 22.92 | $ 47,680 |
| Mississippi | 2,830 | 2.50 | 2.32 | $ 17.40 | $ 36,190 |
| Montana | 1,160 | 2.36 | 2.19 | $ 18.54 | $ 38,570 |
| Wyoming | 620 | 2.32 | 2.15 | $ 21.15 | $ 43,980 |
| Minnesota | 6,390 | 2.26 | 2.09 | $ 25.19 | $ 52,400 |
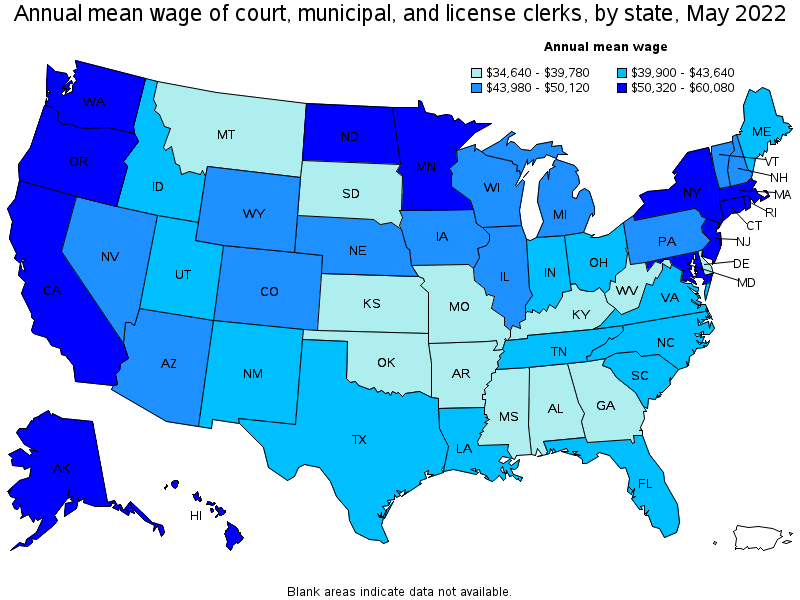
Top paying states for Court, Municipal, and License Clerks:
| State | Employment (1) | Employment per thousand jobs | Location quotient (9) | Hourly mean wage | Annual mean wage (2) |
|---|---|---|---|---|---|
| New York | 10,060 | 1.10 | 1.02 | $ 28.89 | $ 60,080 |
| Washington | 2,990 | 0.88 | 0.81 | $ 27.86 | $ 57,960 |
| California | 12,620 | 0.72 | 0.66 | $ 27.25 | $ 56,670 |
| Massachusetts | 2,190 | 0.61 | 0.57 | $ 27.24 | $ 56,670 |
| Connecticut | 1,270 | 0.78 | 0.72 | $ 26.58 | $ 55,280 |
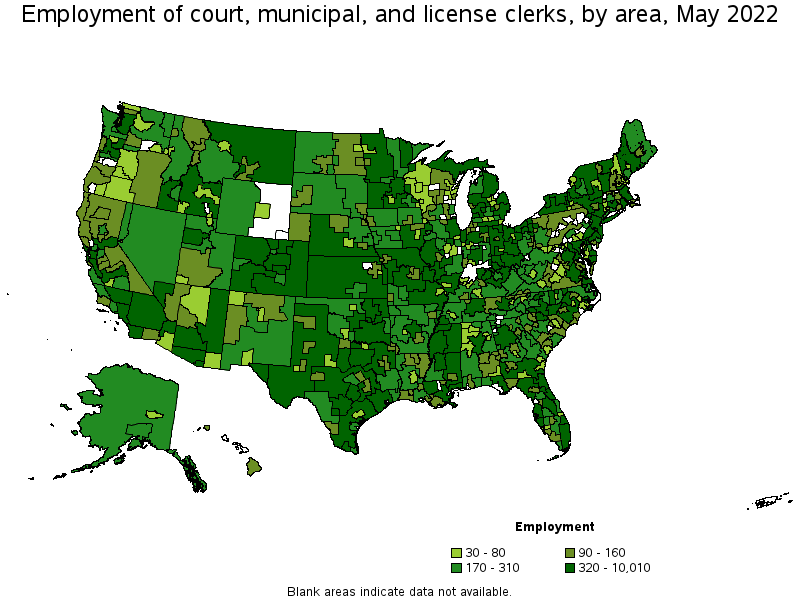
Metropolitan areas with the highest employment level in Court, Municipal, and License Clerks:
| Metropolitan area | Employment (1) | Employment per thousand jobs | Location quotient (9) | Hourly mean wage | Annual mean wage (2) |
|---|---|---|---|---|---|
| New York-Newark-Jersey City, NY-NJ-PA | 10,010 | 1.09 | 1.01 | $ 30.00 | $ 62,400 |
| Minneapolis-St. Paul-Bloomington, MN-WI | 3,800 | 2.01 | 1.86 | $ 25.94 | $ 53,960 |
| Houston-The Woodlands-Sugar Land, TX | 3,310 | 1.08 | 1.00 | $ 21.08 | $ 43,840 |
| Cleveland-Elyria, OH | 3,290 | 3.34 | 3.09 | $ 21.09 | $ 43,870 |
| Dallas-Fort Worth-Arlington, TX | 3,240 | 0.85 | 0.79 | $ 20.87 | $ 43,420 |
| Chicago-Naperville-Elgin, IL-IN-WI | 3,110 | 0.70 | 0.65 | $ 26.19 | $ 54,470 |
| Miami-Fort Lauderdale-West Palm Beach, FL | 3,070 | 1.17 | 1.08 | $ 23.23 | $ 48,310 |
| Los Angeles-Long Beach-Anaheim, CA | 2,670 | 0.44 | 0.41 | $ 27.73 | $ 57,670 |
| Detroit-Warren-Dearborn, MI | 2,570 | 1.38 | 1.28 | $ 21.53 | $ 44,790 |
| Denver-Aurora-Lakewood, CO | 2,530 | 1.63 | 1.51 | $ 24.47 | $ 50,900 |
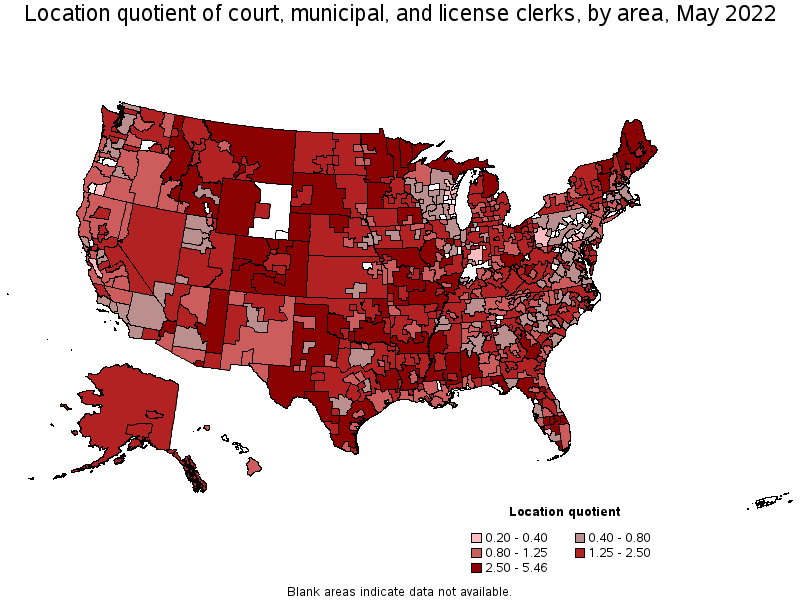
Metropolitan areas with the highest concentration of jobs and location quotients in Court, Municipal, and License Clerks:
| Metropolitan area | Employment (1) | Employment per thousand jobs | Location quotient (9) | Hourly mean wage | Annual mean wage (2) |
|---|---|---|---|---|---|
| Carson City, NV | 150 | 5.05 | 4.67 | $ 20.37 | $ 42,360 |
| Dover, DE | 300 | 4.55 | 4.21 | $ 18.27 | $ 38,010 |
| Grand Junction, CO | 280 | 4.39 | 4.07 | $ 26.07 | $ 54,230 |
| Greeley, CO | 410 | 3.84 | 3.55 | $ 21.41 | $ 44,530 |
| Pueblo, CO | 230 | 3.67 | 3.40 | $ 21.09 | $ 43,870 |
| Duluth, MN-WI | 440 | 3.58 | 3.31 | $ 24.01 | $ 49,940 |
| Port St. Lucie, FL | 550 | 3.52 | 3.26 | $ 18.69 | $ 38,880 |
| Sebring, FL | 90 | 3.41 | 3.16 | $ 18.21 | $ 37,880 |
| Trenton, NJ | 800 | 3.37 | 3.12 | $ 25.29 | $ 52,600 |
| Cleveland-Elyria, OH | 3,290 | 3.34 | 3.09 | $ 21.09 | $ 43,870 |
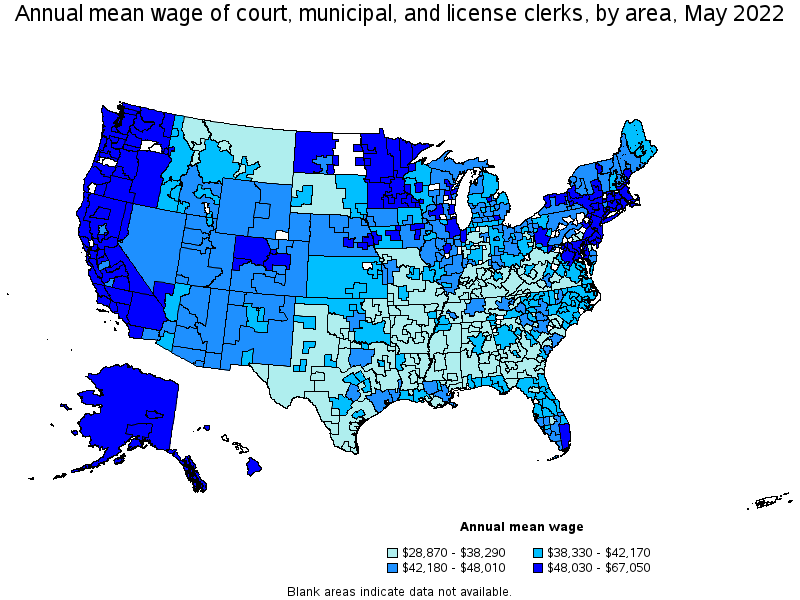
Top paying metropolitan areas for Court, Municipal, and License Clerks:
| Metropolitan area | Employment (1) | Employment per thousand jobs | Location quotient (9) | Hourly mean wage | Annual mean wage (2) |
|---|---|---|---|---|---|
| San Francisco-Oakland-Hayward, CA | 2,160 | 0.90 | 0.84 | $ 32.24 | $ 67,050 |
| San Jose-Sunnyvale-Santa Clara, CA | 460 | 0.41 | 0.38 | $ 31.86 | $ 66,270 |
| Seattle-Tacoma-Bellevue, WA | 1,130 | 0.55 | 0.51 | $ 30.95 | $ 64,380 |
| New York-Newark-Jersey City, NY-NJ-PA | 10,010 | 1.09 | 1.01 | $ 30.00 | $ 62,400 |
| Wenatchee, WA | 50 | 1.02 | 0.95 | $ 28.83 | $ 59,960 |
| Bridgeport-Stamford-Norwalk, CT | 270 | 0.68 | 0.63 | $ 28.74 | $ 59,770 |
| Barnstable Town, MA | 100 | 1.04 | 0.96 | $ 28.63 | $ 59,550 |
| Bremerton-Silverdale, WA | 130 | 1.44 | 1.33 | $ 28.47 | $ 59,210 |
| Reno, NV | 230 | 0.94 | 0.87 | $ 28.06 | $ 58,360 |
| Olympia-Tumwater, WA | 180 | 1.49 | 1.37 | $ 27.98 | $ 58,200 |
Nonmetropolitan areas with the highest employment in Court, Municipal, and License Clerks:
| Nonmetropolitan area | Employment (1) | Employment per thousand jobs | Location quotient (9) | Hourly mean wage | Annual mean wage (2) |
|---|---|---|---|---|---|
| North Texas Region of Texas nonmetropolitan area | 710 | 2.59 | 2.40 | $ 17.69 | $ 36,800 |
| Southeast Oklahoma nonmetropolitan area | 660 | 3.96 | 3.67 | $ 18.46 | $ 38,390 |
| North Northeastern Ohio nonmetropolitan area (noncontiguous) | 650 | 2.02 | 1.87 | $ 20.28 | $ 42,180 |
| Northwest Minnesota nonmetropolitan area | 610 | 3.28 | 3.04 | $ 23.55 | $ 48,980 |
| Southeast Mississippi nonmetropolitan area | 600 | 4.16 | 3.85 | $ 17.19 | $ 35,760 |
Nonmetropolitan areas with the highest concentration of jobs and location quotients in Court, Municipal, and License Clerks:
| Nonmetropolitan area | Employment (1) | Employment per thousand jobs | Location quotient (9) | Hourly mean wage | Annual mean wage (2) |
|---|---|---|---|---|---|
| East-Central Montana nonmetropolitan area | 370 | 5.89 | 5.46 | $ 18.12 | $ 37,690 |
| Eastern and Southern Colorado nonmetropolitan area | 390 | 5.76 | 5.33 | $ 21.46 | $ 44,640 |
| Northern Vermont nonmetropolitan area | 390 | 5.74 | 5.31 | $ 22.52 | $ 46,840 |
| Border Region of Texas nonmetropolitan area | 280 | 4.74 | 4.39 | $ 17.15 | $ 35,680 |
| Northeast Minnesota nonmetropolitan area | 200 | 4.64 | 4.30 | $ 23.42 | $ 48,700 |
Top paying nonmetropolitan areas for Court, Municipal, and License Clerks:
| Nonmetropolitan area | Employment (1) | Employment per thousand jobs | Location quotient (9) | Hourly mean wage | Annual mean wage (2) |
|---|---|---|---|---|---|
| Massachusetts nonmetropolitan area | 130 | 2.08 | 1.92 | $ 28.23 | $ 58,710 |
| Alaska nonmetropolitan area | 190 | 1.87 | 1.73 | $ 25.92 | $ 53,910 |
| Western Washington nonmetropolitan area | 270 | 2.16 | 2.00 | $ 25.71 | $ 53,480 |
| Northwest Colorado nonmetropolitan area | 340 | 2.79 | 2.58 | $ 25.52 | $ 53,080 |
| Eastern Sierra-Mother Lode Region of California nonmetropolitan area | 110 | 1.78 | 1.64 | $ 25.47 | $ 52,970 |
These estimates are calculated with data collected from employers in all industry sectors, all metropolitan and nonmetropolitan areas, and all states and the District of Columbia. The top employment and wage figures are provided above. The complete list is available in the downloadable XLS files.
The percentile wage estimate is the value of a wage below which a certain percent of workers fall. The median wage is the 50th percentile wage estimate—50 percent of workers earn less than the median and 50 percent of workers earn more than the median. More about percentile wages.
(1) Estimates for detailed occupations do not sum to the totals because the totals include occupations not shown separately. Estimates do not include self-employed workers.
(2) Annual wages have been calculated by multiplying the hourly mean wage by a "year-round, full-time" hours figure of 2,080 hours; for those occupations where there is not an hourly wage published, the annual wage has been directly calculated from the reported survey data.
(3) The relative standard error (RSE) is a measure of the reliability of a survey statistic. The smaller the relative standard error, the more precise the estimate.
(7) The value is less than .005 percent of industry employment.
(9) The location quotient is the ratio of the area concentration of occupational employment to the national average concentration. A location quotient greater than one indicates the occupation has a higher share of employment than average, and a location quotient less than one indicates the occupation is less prevalent in the area than average.
Other OEWS estimates and related information:
May 2022 National Occupational Employment and Wage Estimates
May 2022 State Occupational Employment and Wage Estimates
May 2022 Metropolitan and Nonmetropolitan Area Occupational Employment and Wage Estimates
May 2022 National Industry-Specific Occupational Employment and Wage Estimates
Last Modified Date: April 25, 2023