
An official website of the United States government
An official website of the United States government
The .gov means it's official.
Federal government websites often end in .gov or .mil. Before sharing sensitive information,
make sure you're on a federal government site.
The site is secure.
The
https:// ensures that you are connecting to the official website and that any
information you provide is encrypted and transmitted securely.
Accommodate hotel, motel, and resort patrons by registering and assigning rooms to guests, issuing room keys or cards, transmitting and receiving messages, keeping records of occupied rooms and guests� accounts, making and confirming reservations, and presenting statements to and collecting payments from departing guests.
Employment estimate and mean wage estimates for Hotel, Motel, and Resort Desk Clerks:
| Employment (1) | Employment RSE (3) |
Mean hourly wage |
Mean annual wage (2) |
Wage RSE (3) |
|---|---|---|---|---|
| 243,180 | 0.9 % | $ 14.57 | $ 30,300 | 0.7 % |
Percentile wage estimates for Hotel, Motel, and Resort Desk Clerks:
| Percentile | 10% | 25% | 50% (Median) |
75% | 90% |
|---|---|---|---|---|---|
| Hourly Wage | $ 10.71 | $ 12.32 | $ 13.90 | $ 16.53 | $ 18.20 |
| Annual Wage (2) | $ 22,280 | $ 25,630 | $ 28,910 | $ 34,380 | $ 37,860 |
Industries with the highest published employment and wages for Hotel, Motel, and Resort Desk Clerks are provided. For a list of all industries with employment in Hotel, Motel, and Resort Desk Clerks, see the Create Customized Tables function.
Industries with the highest levels of employment in Hotel, Motel, and Resort Desk Clerks:
| Industry | Employment (1) | Percent of industry employment | Hourly mean wage | Annual mean wage (2) |
|---|---|---|---|---|
| Traveler Accommodation | 223,840 | 13.26 | $ 14.50 | $ 30,150 |
| Real Estate | 4,500 | 0.25 | $ 16.65 | $ 34,630 |
| RV (Recreational Vehicle) Parks and Recreational Camps | 3,910 | 6.39 | $ 14.12 | $ 29,370 |
| Employment Services | 2,270 | 0.06 | $ 14.76 | $ 30,700 |
| Other Amusement and Recreation Industries | 1,810 | 0.14 | $ 13.54 | $ 28,170 |
Industries with the highest concentration of employment in Hotel, Motel, and Resort Desk Clerks:
| Industry | Employment (1) | Percent of industry employment | Hourly mean wage | Annual mean wage (2) |
|---|---|---|---|---|
| Traveler Accommodation | 223,840 | 13.26 | $ 14.50 | $ 30,150 |
| Rooming and Boarding Houses | 770 | 7.69 | $ 13.63 | $ 28,350 |
| RV (Recreational Vehicle) Parks and Recreational Camps | 3,910 | 6.39 | $ 14.12 | $ 29,370 |
| Gambling Industries | 890 | 0.44 | $ 14.93 | $ 31,060 |
| Real Estate | 4,500 | 0.25 | $ 16.65 | $ 34,630 |
Top paying industries for Hotel, Motel, and Resort Desk Clerks:
| Industry | Employment (1) | Percent of industry employment | Hourly mean wage | Annual mean wage (2) |
|---|---|---|---|---|
| Management of Companies and Enterprises | 1,190 | 0.04 | $ 17.48 | $ 36,350 |
| Community Food and Housing, and Emergency and Other Relief Services | 270 | 0.13 | $ 17.30 | $ 35,980 |
| Restaurants and Other Eating Places | 670 | 0.01 | $ 17.25 | $ 35,870 |
| Amusement Parks and Arcades | 410 | 0.21 | $ 17.23 | $ 35,830 |
| Special Food Services | (8) | (8) | $ 17.13 | $ 35,640 |
States and areas with the highest published employment, location quotients, and wages for Hotel, Motel, and Resort Desk Clerks are provided. For a list of all areas with employment in Hotel, Motel, and Resort Desk Clerks, see the Create Customized Tables function.
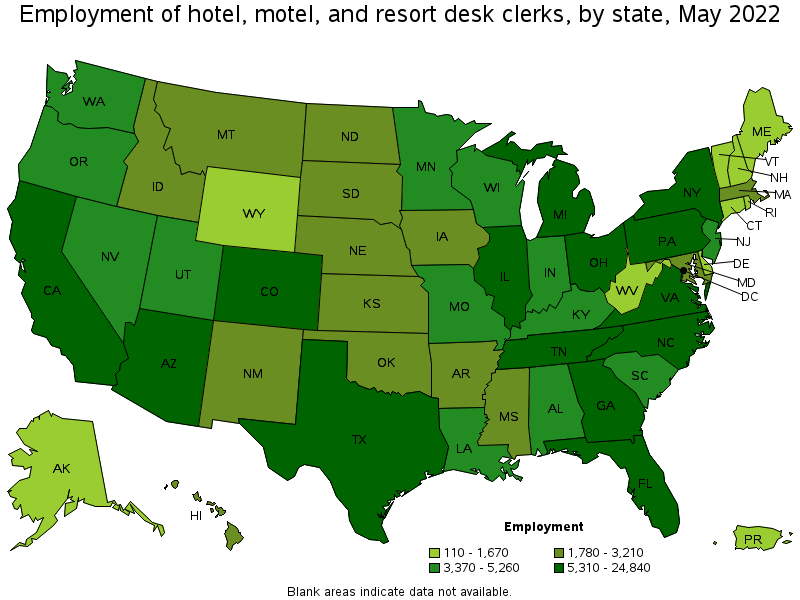
States with the highest employment level in Hotel, Motel, and Resort Desk Clerks:
| State | Employment (1) | Employment per thousand jobs | Location quotient (9) | Hourly mean wage | Annual mean wage (2) |
|---|---|---|---|---|---|
| California | 24,840 | 1.41 | 0.86 | $ 17.63 | $ 36,670 |
| Florida | 21,670 | 2.35 | 1.43 | $ 14.68 | $ 30,540 |
| Texas | 20,800 | 1.60 | 0.97 | $ 12.66 | $ 26,340 |
| New York | 8,550 | 0.94 | 0.57 | $ 20.02 | $ 41,650 |
| North Carolina | 8,320 | 1.79 | 1.09 | $ 12.95 | $ 26,930 |
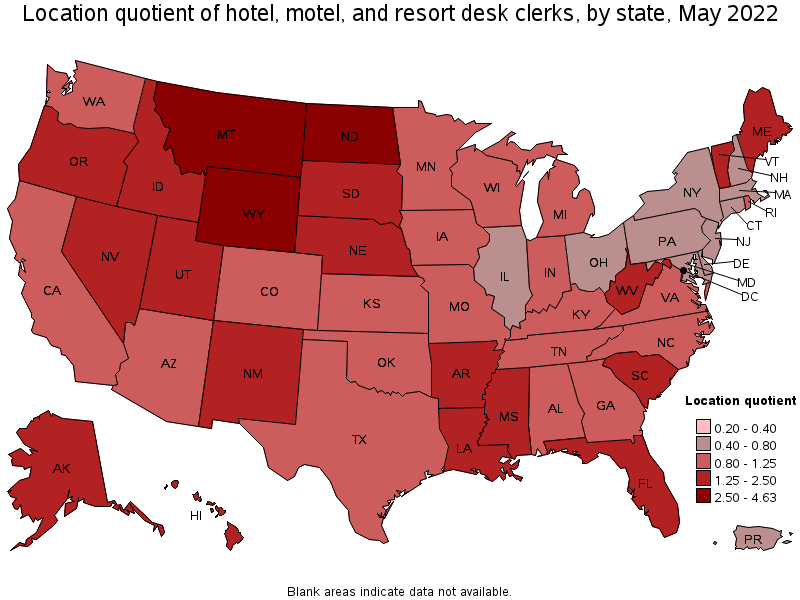
States with the highest concentration of jobs and location quotients in Hotel, Motel, and Resort Desk Clerks:
| State | Employment (1) | Employment per thousand jobs | Location quotient (9) | Hourly mean wage | Annual mean wage (2) |
|---|---|---|---|---|---|
| Montana | 2,430 | 4.96 | 3.02 | $ 14.29 | $ 29,720 |
| Wyoming | 1,320 | 4.91 | 2.98 | $ 13.72 | $ 28,540 |
| North Dakota | 1,850 | 4.56 | 2.77 | $ 14.13 | $ 29,390 |
| South Dakota | 1,780 | 4.09 | 2.49 | $ 13.12 | $ 27,280 |
| New Mexico | 3,140 | 3.83 | 2.33 | $ 13.28 | $ 27,620 |
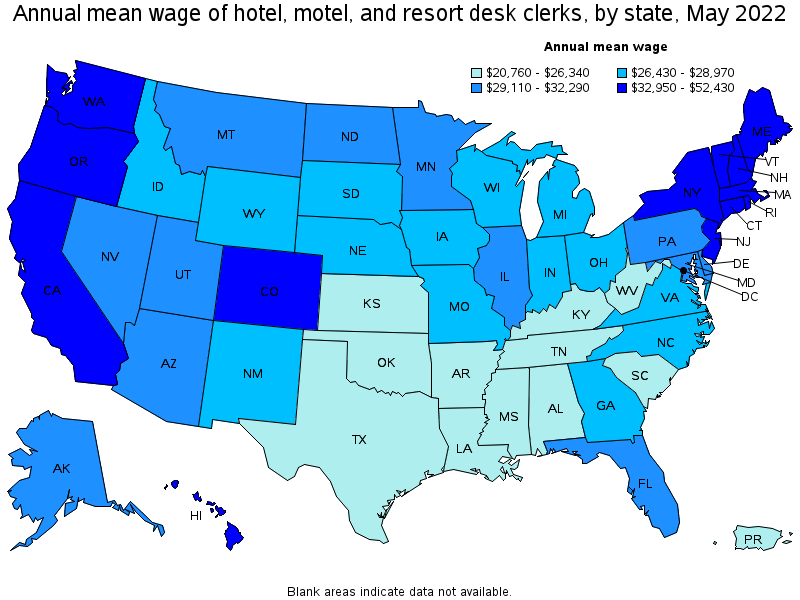
Top paying states for Hotel, Motel, and Resort Desk Clerks:
| State | Employment (1) | Employment per thousand jobs | Location quotient (9) | Hourly mean wage | Annual mean wage (2) |
|---|---|---|---|---|---|
| Hawaii | 2,210 | 3.72 | 2.26 | $ 25.21 | $ 52,430 |
| New York | 8,550 | 0.94 | 0.57 | $ 20.02 | $ 41,650 |
| District of Columbia | 730 | 1.05 | 0.64 | $ 19.77 | $ 41,110 |
| Massachusetts | 2,840 | 0.80 | 0.48 | $ 18.53 | $ 38,530 |
| California | 24,840 | 1.41 | 0.86 | $ 17.63 | $ 36,670 |
Metropolitan areas with the highest employment level in Hotel, Motel, and Resort Desk Clerks:
| Metropolitan area | Employment (1) | Employment per thousand jobs | Location quotient (9) | Hourly mean wage | Annual mean wage (2) |
|---|---|---|---|---|---|
| Los Angeles-Long Beach-Anaheim, CA | 7,290 | 1.19 | 0.73 | $ 17.65 | $ 36,710 |
| New York-Newark-Jersey City, NY-NJ-PA | 7,210 | 0.79 | 0.48 | $ 21.01 | $ 43,690 |
| Miami-Fort Lauderdale-West Palm Beach, FL | 5,360 | 2.04 | 1.24 | $ 15.33 | $ 31,890 |
| Orlando-Kissimmee-Sanford, FL | 5,130 | 3.95 | 2.41 | $ 15.27 | $ 31,770 |
| Dallas-Fort Worth-Arlington, TX | 5,030 | 1.32 | 0.80 | $ 13.41 | $ 27,890 |
| Chicago-Naperville-Elgin, IL-IN-WI | 4,910 | 1.11 | 0.68 | $ 14.93 | $ 31,060 |
| Houston-The Woodlands-Sugar Land, TX | 4,320 | 1.42 | 0.86 | $ 13.10 | $ 27,250 |
| Las Vegas-Henderson-Paradise, NV | 3,630 | 3.55 | 2.16 | $ 15.92 | $ 33,110 |
| Washington-Arlington-Alexandria, DC-VA-MD-WV | 3,630 | 1.20 | 0.73 | $ 16.44 | $ 34,200 |
| Atlanta-Sandy Springs-Roswell, GA | 3,080 | 1.13 | 0.69 | $ 13.79 | $ 28,680 |
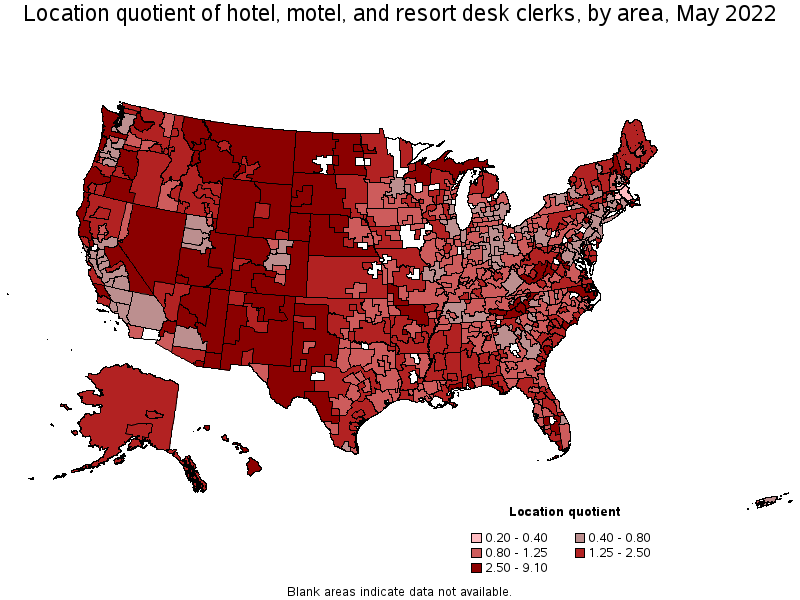
Metropolitan areas with the highest concentration of jobs and location quotients in Hotel, Motel, and Resort Desk Clerks:
| Metropolitan area | Employment (1) | Employment per thousand jobs | Location quotient (9) | Hourly mean wage | Annual mean wage (2) |
|---|---|---|---|---|---|
| Ocean City, NJ | 600 | 14.97 | 9.10 | $ 15.02 | $ 31,240 |
| Flagstaff, AZ | 710 | 11.49 | 6.98 | $ 15.00 | $ 31,200 |
| Kahului-Wailuku-Lahaina, HI | 610 | 8.36 | 5.08 | $ 26.51 | $ 55,140 |
| Rapid City, SD | 560 | 7.98 | 4.86 | $ 13.02 | $ 27,080 |
| Santa Fe, NM | 480 | 7.96 | 4.84 | $ 14.56 | $ 30,280 |
| Hot Springs, AR | 270 | 7.14 | 4.34 | $ 12.25 | $ 25,480 |
| Myrtle Beach-Conway-North Myrtle Beach, SC-NC | 1,220 | 7.09 | 4.31 | $ 12.95 | $ 26,940 |
| St. George, UT | 470 | 5.91 | 3.59 | $ 13.76 | $ 28,610 |
| Brunswick, GA | 250 | 5.88 | 3.57 | $ 12.03 | $ 25,020 |
| Daphne-Fairhope-Foley, AL | 440 | 5.59 | 3.40 | $ 12.16 | $ 25,280 |
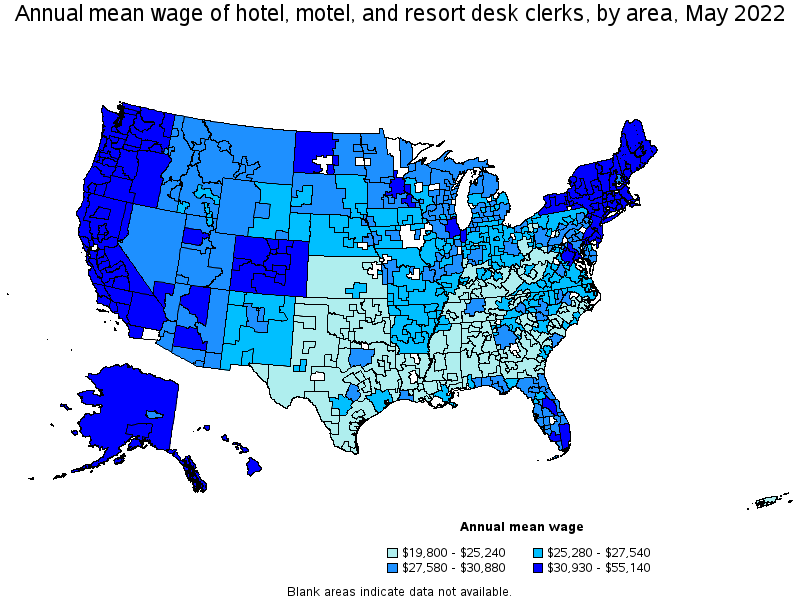
Top paying metropolitan areas for Hotel, Motel, and Resort Desk Clerks:
| Metropolitan area | Employment (1) | Employment per thousand jobs | Location quotient (9) | Hourly mean wage | Annual mean wage (2) |
|---|---|---|---|---|---|
| Kahului-Wailuku-Lahaina, HI | 610 | 8.36 | 5.08 | $ 26.51 | $ 55,140 |
| Urban Honolulu, HI | 1,020 | 2.40 | 1.46 | $ 25.38 | $ 52,790 |
| New York-Newark-Jersey City, NY-NJ-PA | 7,210 | 0.79 | 0.48 | $ 21.01 | $ 43,690 |
| San Jose-Sunnyvale-Santa Clara, CA | 1,100 | 0.98 | 0.60 | $ 19.85 | $ 41,280 |
| San Francisco-Oakland-Hayward, CA | 2,940 | 1.23 | 0.75 | $ 19.77 | $ 41,110 |
| Boston-Cambridge-Nashua, MA-NH | 1,750 | 0.65 | 0.39 | $ 18.97 | $ 39,460 |
| Napa, CA | 340 | 4.63 | 2.81 | $ 18.91 | $ 39,330 |
| Seattle-Tacoma-Bellevue, WA | 1,830 | 0.90 | 0.55 | $ 18.39 | $ 38,250 |
| Santa Rosa, CA | 480 | 2.36 | 1.43 | $ 18.35 | $ 38,160 |
| Barnstable Town, MA | 290 | 2.87 | 1.74 | $ 18.21 | $ 37,870 |
Nonmetropolitan areas with the highest employment in Hotel, Motel, and Resort Desk Clerks:
| Nonmetropolitan area | Employment (1) | Employment per thousand jobs | Location quotient (9) | Hourly mean wage | Annual mean wage (2) |
|---|---|---|---|---|---|
| Northwest Colorado nonmetropolitan area | 1,180 | 9.56 | 5.81 | $ 17.86 | $ 37,150 |
| Coast Oregon nonmetropolitan area | 1,080 | 9.61 | 5.84 | $ 15.46 | $ 32,160 |
| Eastern New Mexico nonmetropolitan area | 950 | 6.17 | 3.75 | $ 12.97 | $ 26,980 |
| East Tennessee nonmetropolitan area | 940 | 6.78 | 4.12 | $ 11.93 | $ 24,820 |
| Southwest Montana nonmetropolitan area | 910 | 6.29 | 3.82 | $ 14.55 | $ 30,260 |
Nonmetropolitan areas with the highest concentration of jobs and location quotients in Hotel, Motel, and Resort Desk Clerks:
| Nonmetropolitan area | Employment (1) | Employment per thousand jobs | Location quotient (9) | Hourly mean wage | Annual mean wage (2) |
|---|---|---|---|---|---|
| South Florida nonmetropolitan area | 830 | 10.47 | 6.37 | $ 14.42 | $ 29,990 |
| Eastern Sierra-Mother Lode Region of California nonmetropolitan area | 600 | 9.90 | 6.02 | $ 16.73 | $ 34,800 |
| Coast Oregon nonmetropolitan area | 1,080 | 9.61 | 5.84 | $ 15.46 | $ 32,160 |
| Northwest Colorado nonmetropolitan area | 1,180 | 9.56 | 5.81 | $ 17.86 | $ 37,150 |
| Central Utah nonmetropolitan area | 520 | 9.41 | 5.72 | $ 13.74 | $ 28,570 |
Top paying nonmetropolitan areas for Hotel, Motel, and Resort Desk Clerks:
| Nonmetropolitan area | Employment (1) | Employment per thousand jobs | Location quotient (9) | Hourly mean wage | Annual mean wage (2) |
|---|---|---|---|---|---|
| Hawaii / Kauai nonmetropolitan area | 590 | 6.01 | 3.65 | $ 23.55 | $ 48,990 |
| Massachusetts nonmetropolitan area | 290 | 4.67 | 2.84 | $ 18.94 | $ 39,390 |
| Northwest Colorado nonmetropolitan area | 1,180 | 9.56 | 5.81 | $ 17.86 | $ 37,150 |
| Eastern Sierra-Mother Lode Region of California nonmetropolitan area | 600 | 9.90 | 6.02 | $ 16.73 | $ 34,800 |
| Connecticut nonmetropolitan area | 60 | 1.91 | 1.16 | $ 16.67 | $ 34,680 |
These estimates are calculated with data collected from employers in all industry sectors, all metropolitan and nonmetropolitan areas, and all states and the District of Columbia. The top employment and wage figures are provided above. The complete list is available in the downloadable XLS files.
The percentile wage estimate is the value of a wage below which a certain percent of workers fall. The median wage is the 50th percentile wage estimate—50 percent of workers earn less than the median and 50 percent of workers earn more than the median. More about percentile wages.
(1) Estimates for detailed occupations do not sum to the totals because the totals include occupations not shown separately. Estimates do not include self-employed workers.
(2) Annual wages have been calculated by multiplying the hourly mean wage by a "year-round, full-time" hours figure of 2,080 hours; for those occupations where there is not an hourly wage published, the annual wage has been directly calculated from the reported survey data.
(3) The relative standard error (RSE) is a measure of the reliability of a survey statistic. The smaller the relative standard error, the more precise the estimate.
(8) Estimate not released.
(9) The location quotient is the ratio of the area concentration of occupational employment to the national average concentration. A location quotient greater than one indicates the occupation has a higher share of employment than average, and a location quotient less than one indicates the occupation is less prevalent in the area than average.
Other OEWS estimates and related information:
May 2022 National Occupational Employment and Wage Estimates
May 2022 State Occupational Employment and Wage Estimates
May 2022 Metropolitan and Nonmetropolitan Area Occupational Employment and Wage Estimates
May 2022 National Industry-Specific Occupational Employment and Wage Estimates
Last Modified Date: April 25, 2023