
An official website of the United States government
An official website of the United States government
The .gov means it's official.
Federal government websites often end in .gov or .mil. Before sharing sensitive information,
make sure you're on a federal government site.
The site is secure.
The
https:// ensures that you are connecting to the official website and that any
information you provide is encrypted and transmitted securely.
Perform secretarial duties using legal terminology, procedures, and documents. Prepare legal papers and correspondence, such as summonses, complaints, motions, and subpoenas. May also assist with legal research.
Employment estimate and mean wage estimates for Legal Secretaries and Administrative Assistants:
| Employment (1) | Employment RSE (3) |
Mean hourly wage |
Mean annual wage (2) |
Wage RSE (3) |
|---|---|---|---|---|
| 159,940 | 2.6 % | $ 26.05 | $ 54,180 | 1.8 % |
Percentile wage estimates for Legal Secretaries and Administrative Assistants:
| Percentile | 10% | 25% | 50% (Median) |
75% | 90% |
|---|---|---|---|---|---|
| Hourly Wage | $ 15.02 | $ 18.73 | $ 23.45 | $ 31.06 | $ 39.14 |
| Annual Wage (2) | $ 31,240 | $ 38,960 | $ 48,780 | $ 64,590 | $ 81,400 |
Industries with the highest published employment and wages for Legal Secretaries and Administrative Assistants are provided. For a list of all industries with employment in Legal Secretaries and Administrative Assistants, see the Create Customized Tables function.
Industries with the highest levels of employment in Legal Secretaries and Administrative Assistants:
| Industry | Employment (1) | Percent of industry employment | Hourly mean wage | Annual mean wage (2) |
|---|---|---|---|---|
| Legal Services | 130,590 | 11.06 | $ 26.15 | $ 54,400 |
| Local Government, excluding schools and hospitals (OEWS Designation) | 10,960 | 0.20 | $ 25.28 | $ 52,580 |
| State Government, excluding schools and hospitals (OEWS Designation) | 7,270 | 0.34 | $ 24.88 | $ 51,750 |
| Employment Services | 1,920 | 0.05 | $ 23.84 | $ 49,590 |
| Management of Companies and Enterprises | 1,220 | 0.05 | $ 31.60 | $ 65,720 |
Industries with the highest concentration of employment in Legal Secretaries and Administrative Assistants:
| Industry | Employment (1) | Percent of industry employment | Hourly mean wage | Annual mean wage (2) |
|---|---|---|---|---|
| Legal Services | 130,590 | 11.06 | $ 26.15 | $ 54,400 |
| Other Investment Pools and Funds | 140 | 0.81 | $ 21.45 | $ 44,620 |
| State Government, excluding schools and hospitals (OEWS Designation) | 7,270 | 0.34 | $ 24.88 | $ 51,750 |
| Local Government, excluding schools and hospitals (OEWS Designation) | 10,960 | 0.20 | $ 25.28 | $ 52,580 |
| Lessors of Nonfinancial Intangible Assets (except Copyrighted Works) | 40 | 0.18 | $ 22.32 | $ 46,420 |
Top paying industries for Legal Secretaries and Administrative Assistants:
| Industry | Employment (1) | Percent of industry employment | Hourly mean wage | Annual mean wage (2) |
|---|---|---|---|---|
| Media Streaming Distribution Services, Social Networks, and Other Media Networks and Content Providers | 40 | 0.02 | $ 40.47 | $ 84,180 |
| Telecommunications | 140 | 0.02 | $ 34.93 | $ 72,650 |
| Architectural, Engineering, and Related Services | 50 | (7) | $ 34.09 | $ 70,910 |
| Scientific Research and Development Services | 50 | 0.01 | $ 33.81 | $ 70,320 |
| Oil and Gas Extraction | 50 | 0.05 | $ 33.68 | $ 70,050 |
States and areas with the highest published employment, location quotients, and wages for Legal Secretaries and Administrative Assistants are provided. For a list of all areas with employment in Legal Secretaries and Administrative Assistants, see the Create Customized Tables function.
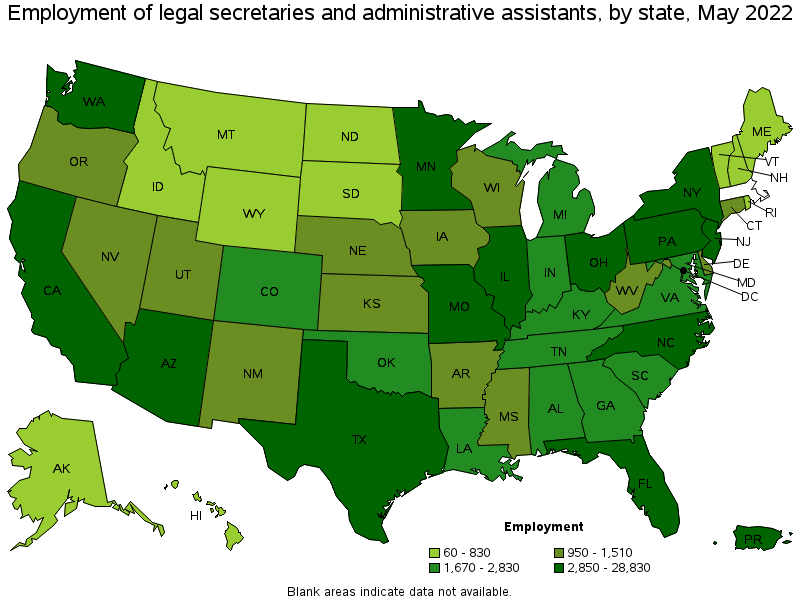
States with the highest employment level in Legal Secretaries and Administrative Assistants:
| State | Employment (1) | Employment per thousand jobs | Location quotient (9) | Hourly mean wage | Annual mean wage (2) |
|---|---|---|---|---|---|
| California | 28,830 | 1.63 | 1.51 | $ 29.09 | $ 60,500 |
| New York | 13,280 | 1.46 | 1.35 | $ 30.98 | $ 64,450 |
| Florida | 12,170 | 1.32 | 1.22 | $ 23.52 | $ 48,920 |
| Texas | 11,440 | 0.88 | 0.81 | $ 24.48 | $ 50,920 |
| Illinois | 9,260 | 1.57 | 1.45 | $ 29.30 | $ 60,940 |
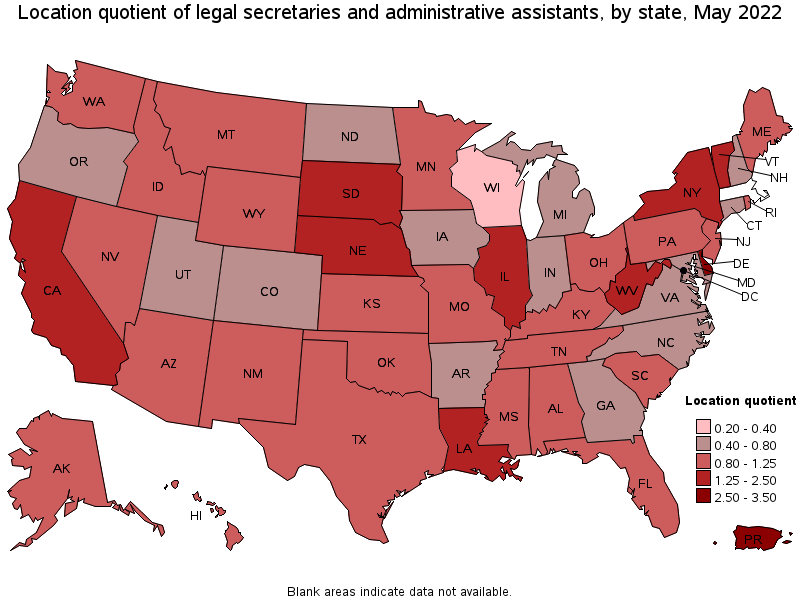
States with the highest concentration of jobs and location quotients in Legal Secretaries and Administrative Assistants:
| State | Employment (1) | Employment per thousand jobs | Location quotient (9) | Hourly mean wage | Annual mean wage (2) |
|---|---|---|---|---|---|
| District of Columbia | 2,250 | 3.27 | 3.02 | $ 40.14 | $ 83,500 |
| Delaware | 1,250 | 2.74 | 2.54 | $ 26.41 | $ 54,940 |
| West Virginia | 1,310 | 1.94 | 1.79 | $ 20.20 | $ 42,020 |
| California | 28,830 | 1.63 | 1.51 | $ 29.09 | $ 60,500 |
| Illinois | 9,260 | 1.57 | 1.45 | $ 29.30 | $ 60,940 |
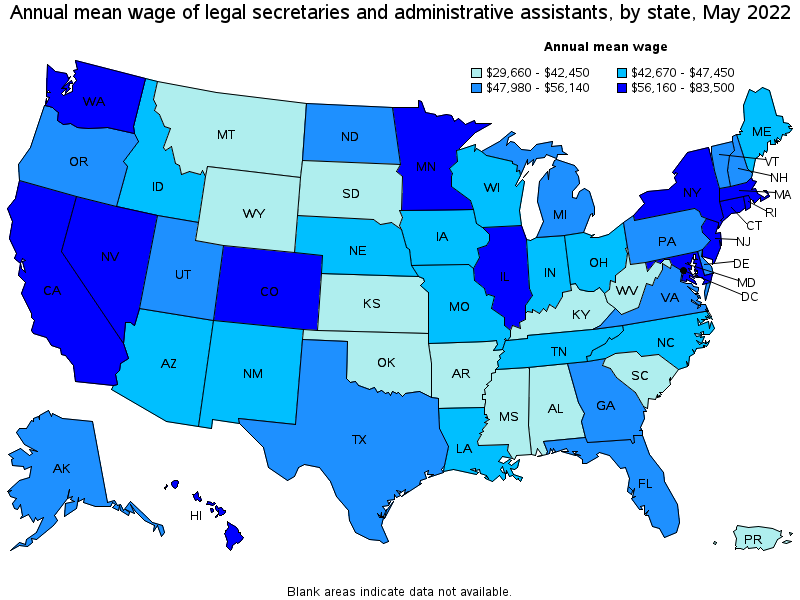
Top paying states for Legal Secretaries and Administrative Assistants:
| State | Employment (1) | Employment per thousand jobs | Location quotient (9) | Hourly mean wage | Annual mean wage (2) |
|---|---|---|---|---|---|
| District of Columbia | 2,250 | 3.27 | 3.02 | $ 40.14 | $ 83,500 |
| Massachusetts | (8) | (8) | (8) | $ 31.58 | $ 65,690 |
| New York | 13,280 | 1.46 | 1.35 | $ 30.98 | $ 64,450 |
| Colorado | 1,670 | 0.60 | 0.56 | $ 30.45 | $ 63,340 |
| Maryland | 1,690 | 0.64 | 0.59 | $ 30.14 | $ 62,690 |
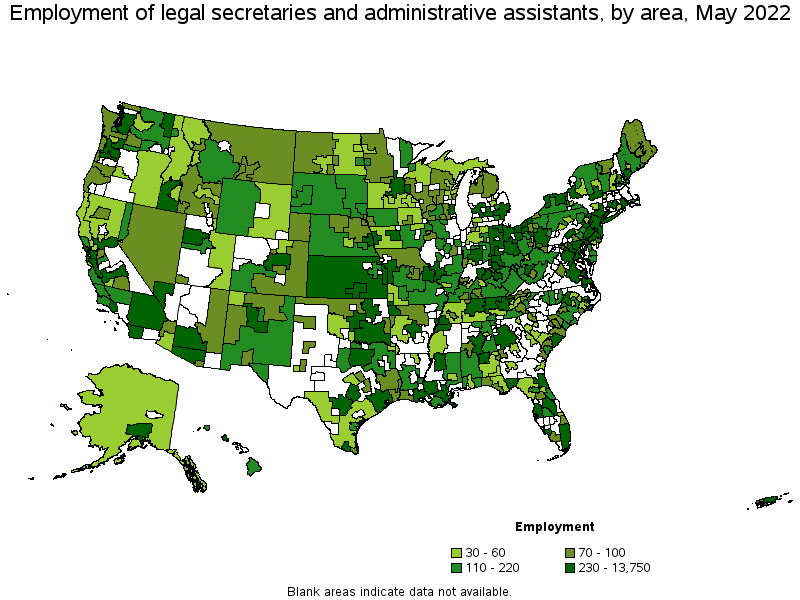
Metropolitan areas with the highest employment level in Legal Secretaries and Administrative Assistants:
| Metropolitan area | Employment (1) | Employment per thousand jobs | Location quotient (9) | Hourly mean wage | Annual mean wage (2) |
|---|---|---|---|---|---|
| New York-Newark-Jersey City, NY-NJ-PA | 13,750 | 1.50 | 1.38 | $ 32.24 | $ 67,070 |
| Miami-Fort Lauderdale-West Palm Beach, FL | 5,970 | 2.27 | 2.10 | $ 24.38 | $ 50,720 |
| Philadelphia-Camden-Wilmington, PA-NJ-DE-MD | 4,560 | 1.64 | 1.52 | $ 28.13 | $ 58,510 |
| Dallas-Fort Worth-Arlington, TX | 3,660 | 0.96 | 0.89 | $ 25.37 | $ 52,760 |
| Houston-The Woodlands-Sugar Land, TX | 3,520 | 1.15 | 1.06 | $ 25.78 | $ 53,630 |
| San Francisco-Oakland-Hayward, CA | 3,390 | 1.42 | 1.31 | $ 36.20 | $ 75,290 |
| Washington-Arlington-Alexandria, DC-VA-MD-WV | 3,310 | 1.09 | 1.01 | $ 36.86 | $ 76,680 |
| San Diego-Carlsbad, CA | 2,960 | 1.99 | 1.84 | $ 28.71 | $ 59,720 |
| Phoenix-Mesa-Scottsdale, AZ | 2,590 | 1.17 | 1.08 | $ 23.69 | $ 49,280 |
| Seattle-Tacoma-Bellevue, WA | 2,340 | 1.15 | 1.06 | $ 31.63 | $ 65,780 |
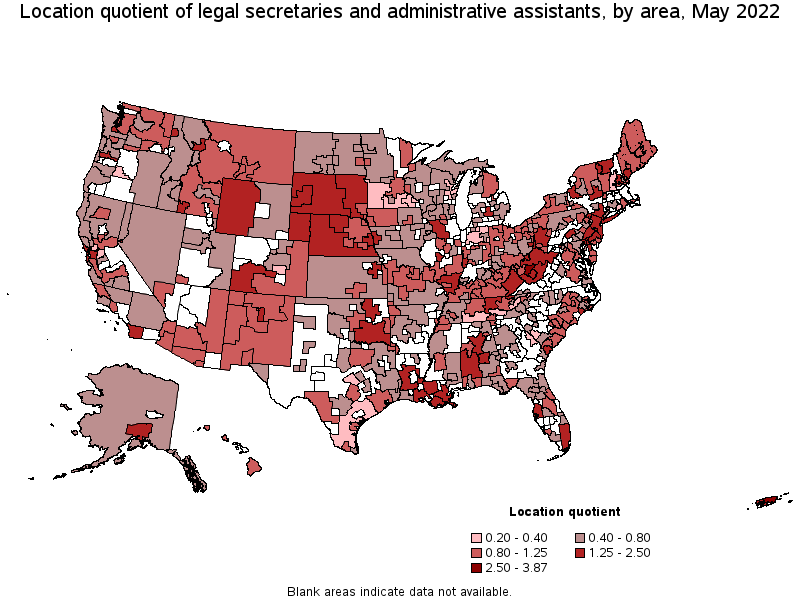
Metropolitan areas with the highest concentration of jobs and location quotients in Legal Secretaries and Administrative Assistants:
| Metropolitan area | Employment (1) | Employment per thousand jobs | Location quotient (9) | Hourly mean wage | Annual mean wage (2) |
|---|---|---|---|---|---|
| Charleston, WV | 380 | 3.82 | 3.53 | $ 21.52 | $ 44,760 |
| Miami-Fort Lauderdale-West Palm Beach, FL | 5,970 | 2.27 | 2.10 | $ 24.38 | $ 50,720 |
| Carson City, NV | 60 | 2.12 | 1.96 | $ 25.35 | $ 52,730 |
| Santa Fe, NM | 130 | 2.11 | 1.95 | $ 24.67 | $ 51,310 |
| Baton Rouge, LA | 810 | 2.10 | 1.94 | $ 18.56 | $ 38,610 |
| San Diego-Carlsbad, CA | 2,960 | 1.99 | 1.84 | $ 28.71 | $ 59,720 |
| Pittsburgh, PA | 2,090 | 1.98 | 1.83 | $ 23.17 | $ 48,200 |
| Portland-South Portland, ME | 380 | 1.87 | 1.73 | $ 25.73 | $ 53,510 |
| Parkersburg-Vienna, WV | 60 | 1.82 | 1.69 | $ 20.98 | $ 43,640 |
| Jacksonville, NC | 90 | 1.81 | 1.67 | $ 20.18 | $ 41,970 |
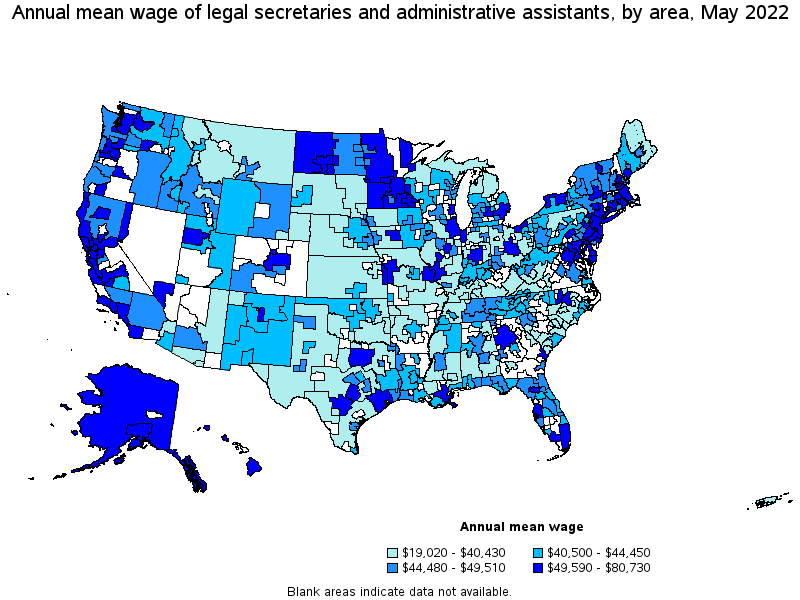
Top paying metropolitan areas for Legal Secretaries and Administrative Assistants:
| Metropolitan area | Employment (1) | Employment per thousand jobs | Location quotient (9) | Hourly mean wage | Annual mean wage (2) |
|---|---|---|---|---|---|
| San Jose-Sunnyvale-Santa Clara, CA | 1,510 | 1.34 | 1.24 | $ 38.81 | $ 80,730 |
| Washington-Arlington-Alexandria, DC-VA-MD-WV | 3,310 | 1.09 | 1.01 | $ 36.86 | $ 76,680 |
| San Francisco-Oakland-Hayward, CA | 3,390 | 1.42 | 1.31 | $ 36.20 | $ 75,290 |
| Boulder, CO | 90 | 0.45 | 0.42 | $ 34.94 | $ 72,680 |
| Boston-Cambridge-Nashua, MA-NH | (8) | (8) | (8) | $ 34.54 | $ 71,840 |
| Denver-Aurora-Lakewood, CO | 1,060 | 0.69 | 0.63 | $ 32.47 | $ 67,540 |
| New York-Newark-Jersey City, NY-NJ-PA | 13,750 | 1.50 | 1.38 | $ 32.24 | $ 67,070 |
| Santa Maria-Santa Barbara, CA | 170 | 0.83 | 0.77 | $ 31.90 | $ 66,340 |
| Seattle-Tacoma-Bellevue, WA | 2,340 | 1.15 | 1.06 | $ 31.63 | $ 65,780 |
| Salinas, CA | 150 | 0.83 | 0.77 | $ 31.18 | $ 64,860 |
Nonmetropolitan areas with the highest employment in Legal Secretaries and Administrative Assistants:
| Nonmetropolitan area | Employment (1) | Employment per thousand jobs | Location quotient (9) | Hourly mean wage | Annual mean wage (2) |
|---|---|---|---|---|---|
| North Northeastern Ohio nonmetropolitan area (noncontiguous) | 380 | 1.17 | 1.08 | $ 17.47 | $ 36,350 |
| Kansas nonmetropolitan area | 300 | 0.78 | 0.72 | $ 19.12 | $ 39,770 |
| North Central Tennessee nonmetropolitan area | 250 | 2.20 | 2.04 | $ 23.80 | $ 49,510 |
| Southeast Oklahoma nonmetropolitan area | 250 | 1.49 | 1.38 | $ 18.59 | $ 38,660 |
| West Northwestern Ohio nonmetropolitan area | 240 | 0.98 | 0.91 | $ 18.86 | $ 39,230 |
Nonmetropolitan areas with the highest concentration of jobs and location quotients in Legal Secretaries and Administrative Assistants:
| Nonmetropolitan area | Employment (1) | Employment per thousand jobs | Location quotient (9) | Hourly mean wage | Annual mean wage (2) |
|---|---|---|---|---|---|
| Southern West Virginia nonmetropolitan area | 180 | 2.64 | 2.44 | $ 17.65 | $ 36,710 |
| East Kentucky nonmetropolitan area | 220 | 2.24 | 2.07 | $ 14.89 | $ 30,970 |
| North Central Tennessee nonmetropolitan area | 250 | 2.20 | 2.04 | $ 23.80 | $ 49,510 |
| Northwest Nebraska nonmetropolitan area | 70 | 1.81 | 1.67 | $ 18.17 | $ 37,790 |
| West South Dakota nonmetropolitan area | 110 | 1.80 | 1.66 | $ 17.86 | $ 37,140 |
Top paying nonmetropolitan areas for Legal Secretaries and Administrative Assistants:
| Nonmetropolitan area | Employment (1) | Employment per thousand jobs | Location quotient (9) | Hourly mean wage | Annual mean wage (2) |
|---|---|---|---|---|---|
| Southeast Minnesota nonmetropolitan area | 60 | 0.41 | 0.38 | $ 26.62 | $ 55,360 |
| Central New Hampshire nonmetropolitan area | 140 | 1.53 | 1.41 | $ 25.14 | $ 52,290 |
| Northwest Minnesota nonmetropolitan area | 100 | 0.53 | 0.49 | $ 24.89 | $ 51,760 |
| Alaska nonmetropolitan area | 50 | 0.52 | 0.48 | $ 24.84 | $ 51,670 |
| North Coast Region of California nonmetropolitan area | 60 | 0.55 | 0.51 | $ 24.70 | $ 51,380 |
These estimates are calculated with data collected from employers in all industry sectors, all metropolitan and nonmetropolitan areas, and all states and the District of Columbia. The top employment and wage figures are provided above. The complete list is available in the downloadable XLS files.
The percentile wage estimate is the value of a wage below which a certain percent of workers fall. The median wage is the 50th percentile wage estimate—50 percent of workers earn less than the median and 50 percent of workers earn more than the median. More about percentile wages.
(1) Estimates for detailed occupations do not sum to the totals because the totals include occupations not shown separately. Estimates do not include self-employed workers.
(2) Annual wages have been calculated by multiplying the hourly mean wage by a "year-round, full-time" hours figure of 2,080 hours; for those occupations where there is not an hourly wage published, the annual wage has been directly calculated from the reported survey data.
(3) The relative standard error (RSE) is a measure of the reliability of a survey statistic. The smaller the relative standard error, the more precise the estimate.
(7) The value is less than .005 percent of industry employment.
(8) Estimate not released.
(9) The location quotient is the ratio of the area concentration of occupational employment to the national average concentration. A location quotient greater than one indicates the occupation has a higher share of employment than average, and a location quotient less than one indicates the occupation is less prevalent in the area than average.
Other OEWS estimates and related information:
May 2022 National Occupational Employment and Wage Estimates
May 2022 State Occupational Employment and Wage Estimates
May 2022 Metropolitan and Nonmetropolitan Area Occupational Employment and Wage Estimates
May 2022 National Industry-Specific Occupational Employment and Wage Estimates
Last Modified Date: April 25, 2023