
An official website of the United States government
An official website of the United States government
The .gov means it's official.
Federal government websites often end in .gov or .mil. Before sharing sensitive information,
make sure you're on a federal government site.
The site is secure.
The
https:// ensures that you are connecting to the official website and that any
information you provide is encrypted and transmitted securely.
Perform duties too varied and diverse to be classified in any specific office clerical occupation, requiring knowledge of office systems and procedures. Clerical duties may be assigned in accordance with the office procedures of individual establishments and may include a combination of answering telephones, bookkeeping, typing or word processing, office machine operation, and filing.
Employment estimate and mean wage estimates for Office Clerks, General:
| Employment (1) | Employment RSE (3) |
Mean hourly wage |
Mean annual wage (2) |
Wage RSE (3) |
|---|---|---|---|---|
| 2,517,350 | 0.6 % | $ 19.78 | $ 41,140 | 0.1 % |
Percentile wage estimates for Office Clerks, General:
| Percentile | 10% | 25% | 50% (Median) |
75% | 90% |
|---|---|---|---|---|---|
| Hourly Wage | $ 12.50 | $ 14.99 | $ 18.29 | $ 23.02 | $ 28.70 |
| Annual Wage (2) | $ 26,000 | $ 31,180 | $ 38,040 | $ 47,880 | $ 59,700 |
Industries with the highest published employment and wages for Office Clerks, General are provided. For a list of all industries with employment in Office Clerks, General, see the Create Customized Tables function.
Industries with the highest levels of employment in Office Clerks, General:
| Industry | Employment (1) | Percent of industry employment | Hourly mean wage | Annual mean wage (2) |
|---|---|---|---|---|
| Local Government, excluding schools and hospitals (OEWS Designation) | 158,100 | 2.94 | $ 21.05 | $ 43,790 |
| Elementary and Secondary Schools | 109,060 | 1.30 | $ 19.13 | $ 39,800 |
| Real Estate | 100,050 | 5.62 | $ 19.31 | $ 40,170 |
| Employment Services | 91,780 | 2.34 | $ 18.53 | $ 38,550 |
| Colleges, Universities, and Professional Schools | 91,720 | 3.04 | $ 18.17 | $ 37,800 |
Industries with the highest concentration of employment in Office Clerks, General:
| Industry | Employment (1) | Percent of industry employment | Hourly mean wage | Annual mean wage (2) |
|---|---|---|---|---|
| Death Care Services | 9,540 | 7.00 | $ 17.46 | $ 36,310 |
| Personal and Household Goods Repair and Maintenance | 5,230 | 6.24 | $ 17.76 | $ 36,930 |
| Real Estate | 100,050 | 5.62 | $ 19.31 | $ 40,170 |
| Water, Sewage and Other Systems | 3,030 | 5.49 | $ 19.79 | $ 41,160 |
| Other Investment Pools and Funds | 940 | 5.45 | $ 23.25 | $ 48,350 |
Top paying industries for Office Clerks, General:
| Industry | Employment (1) | Percent of industry employment | Hourly mean wage | Annual mean wage (2) |
|---|---|---|---|---|
| Natural Gas Distribution | 2,290 | 2.09 | $ 36.13 | $ 75,150 |
| Pipeline Transportation of Crude Oil | 110 | 0.97 | $ 32.66 | $ 67,930 |
| Postal Service (federal government) | 1,060 | 0.17 | $ 31.43 | $ 65,370 |
| Electric Power Generation, Transmission and Distribution | 4,230 | 1.12 | $ 27.39 | $ 56,970 |
| Rail Transportation | 1,310 | 0.72 | $ 25.80 | $ 53,660 |
States and areas with the highest published employment, location quotients, and wages for Office Clerks, General are provided. For a list of all areas with employment in Office Clerks, General, see the Create Customized Tables function.
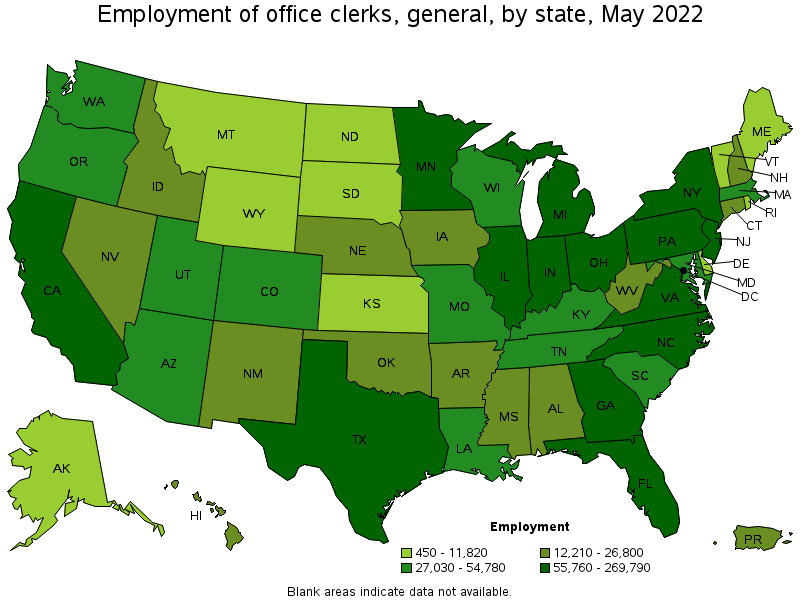
States with the highest employment level in Office Clerks, General:
| State | Employment (1) | Employment per thousand jobs | Location quotient (9) | Hourly mean wage | Annual mean wage (2) |
|---|---|---|---|---|---|
| California | 269,790 | 15.30 | 0.90 | $ 22.08 | $ 45,930 |
| Texas | 200,790 | 15.45 | 0.91 | $ 17.82 | $ 37,060 |
| Florida | 193,710 | 21.03 | 1.24 | $ 19.35 | $ 40,250 |
| New York | 141,250 | 15.51 | 0.91 | $ 21.19 | $ 44,080 |
| Illinois | 126,460 | 21.49 | 1.26 | $ 20.51 | $ 42,660 |
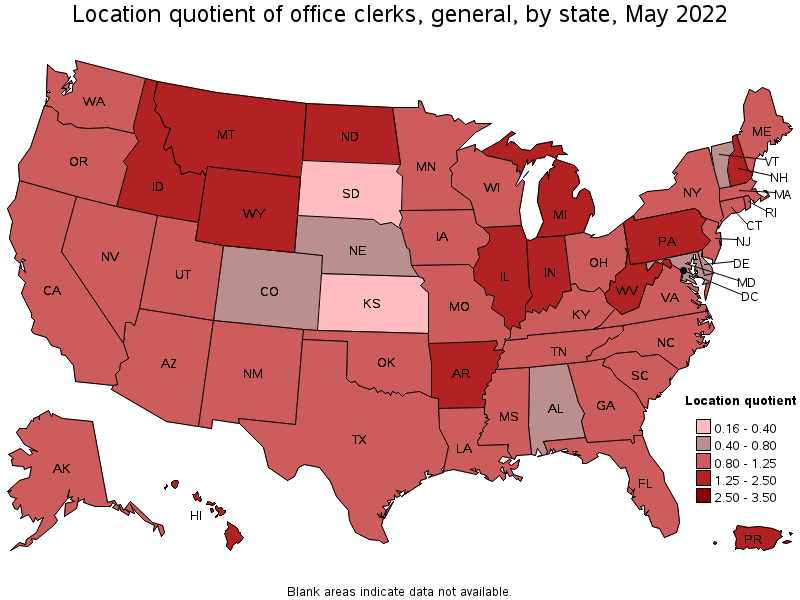
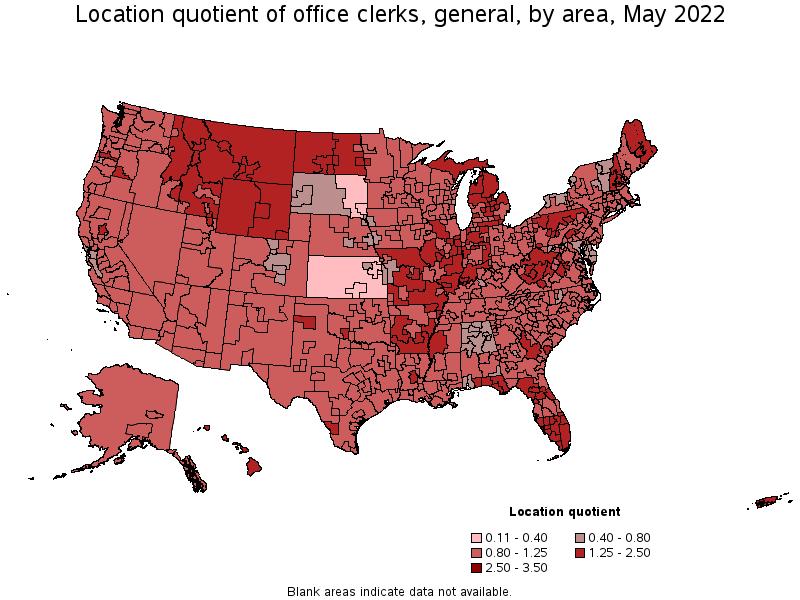
States with the highest concentration of jobs and location quotients in Office Clerks, General:
| State | Employment (1) | Employment per thousand jobs | Location quotient (9) | Hourly mean wage | Annual mean wage (2) |
|---|---|---|---|---|---|
| Hawaii | 16,530 | 27.79 | 1.63 | $ 20.66 | $ 42,970 |
| Wyoming | 6,980 | 26.03 | 1.53 | $ 20.13 | $ 41,870 |
| North Dakota | 9,810 | 24.20 | 1.42 | $ 22.78 | $ 47,380 |
| New Hampshire | 15,700 | 23.82 | 1.40 | $ 22.70 | $ 47,210 |
| Montana | 11,440 | 23.36 | 1.37 | $ 19.45 | $ 40,460 |
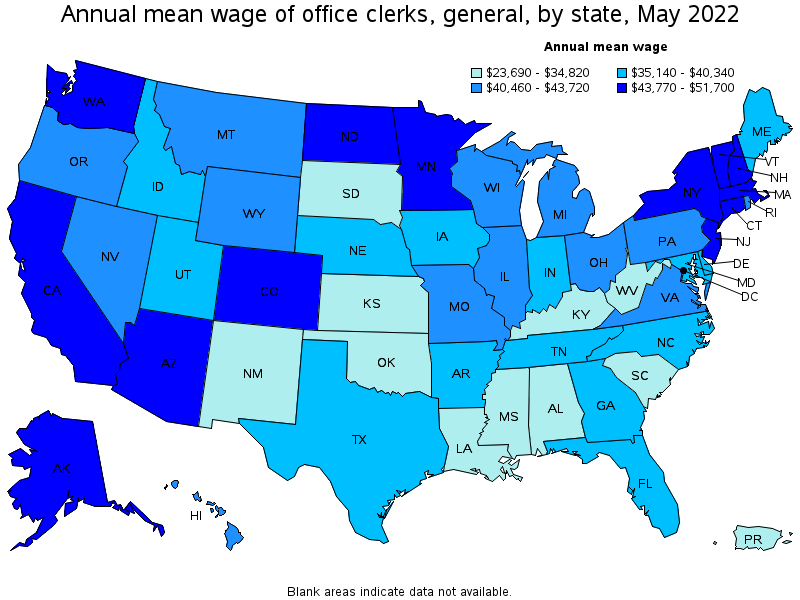
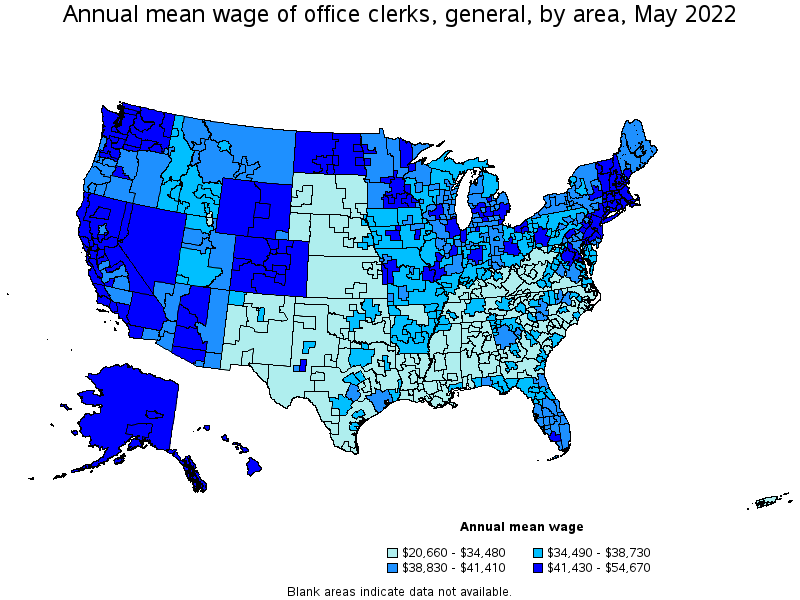
Top paying states for Office Clerks, General:
| State | Employment (1) | Employment per thousand jobs | Location quotient (9) | Hourly mean wage | Annual mean wage (2) |
|---|---|---|---|---|---|
| District of Columbia | 9,070 | 13.14 | 0.77 | $ 24.86 | $ 51,700 |
| Colorado | 35,140 | 12.70 | 0.75 | $ 24.03 | $ 49,980 |
| Washington | 53,430 | 15.69 | 0.92 | $ 23.03 | $ 47,910 |
| Alaska | 5,020 | 16.39 | 0.96 | $ 23.00 | $ 47,840 |
| North Dakota | 9,810 | 24.20 | 1.42 | $ 22.78 | $ 47,380 |
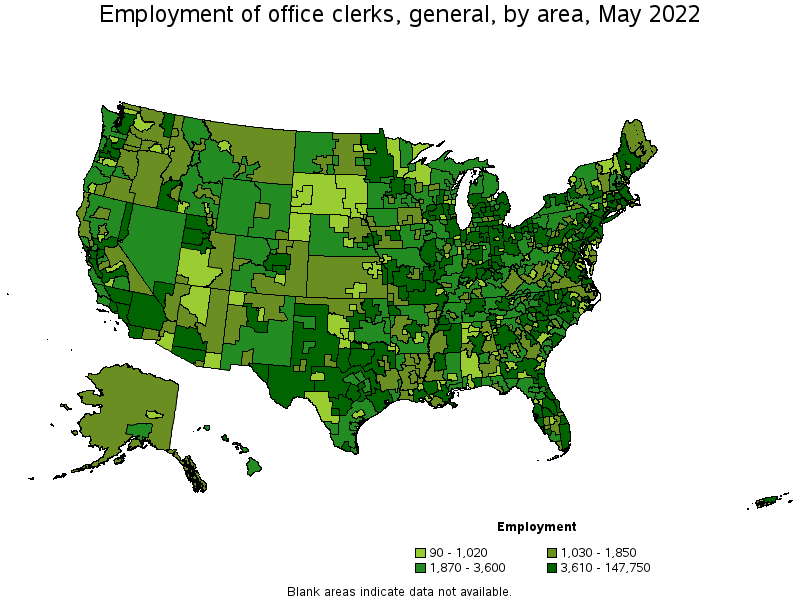
Metropolitan areas with the highest employment level in Office Clerks, General:
| Metropolitan area | Employment (1) | Employment per thousand jobs | Location quotient (9) | Hourly mean wage | Annual mean wage (2) |
|---|---|---|---|---|---|
| New York-Newark-Jersey City, NY-NJ-PA | 147,750 | 16.09 | 0.94 | $ 21.90 | $ 45,550 |
| Los Angeles-Long Beach-Anaheim, CA | 100,680 | 16.50 | 0.97 | $ 21.66 | $ 45,050 |
| Chicago-Naperville-Elgin, IL-IN-WI | 89,680 | 20.31 | 1.19 | $ 21.22 | $ 44,150 |
| Dallas-Fort Worth-Arlington, TX | 58,010 | 15.25 | 0.90 | $ 18.59 | $ 38,670 |
| Miami-Fort Lauderdale-West Palm Beach, FL | 56,570 | 21.56 | 1.27 | $ 19.87 | $ 41,330 |
| Philadelphia-Camden-Wilmington, PA-NJ-DE-MD | 53,130 | 19.18 | 1.13 | $ 21.08 | $ 43,850 |
| Washington-Arlington-Alexandria, DC-VA-MD-WV | 44,730 | 14.77 | 0.87 | $ 22.52 | $ 46,840 |
| Houston-The Woodlands-Sugar Land, TX | 42,160 | 13.80 | 0.81 | $ 18.74 | $ 38,980 |
| Atlanta-Sandy Springs-Roswell, GA | 38,880 | 14.25 | 0.84 | $ 19.42 | $ 40,390 |
| Detroit-Warren-Dearborn, MI | 38,800 | 20.79 | 1.22 | $ 20.77 | $ 43,210 |
Metropolitan areas with the highest concentration of jobs and location quotients in Office Clerks, General:
| Metropolitan area | Employment (1) | Employment per thousand jobs | Location quotient (9) | Hourly mean wage | Annual mean wage (2) |
|---|---|---|---|---|---|
| Lansing-East Lansing, MI | 6,670 | 32.92 | 1.93 | $ 20.70 | $ 43,060 |
| Carbondale-Marion, IL | 1,650 | 31.67 | 1.86 | $ 18.52 | $ 38,520 |
| Springfield, IL | 3,130 | 30.76 | 1.81 | $ 20.11 | $ 41,840 |
| Casper, WY | 1,130 | 30.13 | 1.77 | $ 20.56 | $ 42,760 |
| Champaign-Urbana, IL | 3,040 | 29.68 | 1.74 | $ 20.62 | $ 42,900 |
| Deltona-Daytona Beach-Ormond Beach, FL | 5,770 | 27.95 | 1.64 | $ 17.86 | $ 37,150 |
| Kahului-Wailuku-Lahaina, HI | 2,010 | 27.52 | 1.62 | $ 21.25 | $ 44,190 |
| Urban Honolulu, HI | 11,630 | 27.46 | 1.61 | $ 20.72 | $ 43,100 |
| Manchester, NH | 2,900 | 27.22 | 1.60 | $ 22.10 | $ 45,960 |
| Midland, MI | 970 | 27.22 | 1.60 | $ 21.03 | $ 43,750 |
Top paying metropolitan areas for Office Clerks, General:
| Metropolitan area | Employment (1) | Employment per thousand jobs | Location quotient (9) | Hourly mean wage | Annual mean wage (2) |
|---|---|---|---|---|---|
| San Francisco-Oakland-Hayward, CA | 29,660 | 12.40 | 0.73 | $ 26.29 | $ 54,670 |
| Boulder, CO | 2,340 | 12.19 | 0.72 | $ 25.81 | $ 53,680 |
| San Jose-Sunnyvale-Santa Clara, CA | 12,540 | 11.17 | 0.66 | $ 25.56 | $ 53,170 |
| Denver-Aurora-Lakewood, CO | 17,800 | 11.47 | 0.67 | $ 24.74 | $ 51,470 |
| Seattle-Tacoma-Bellevue, WA | 29,750 | 14.60 | 0.86 | $ 24.29 | $ 50,530 |
| Fort Collins, CO | 2,130 | 12.57 | 0.74 | $ 23.55 | $ 48,980 |
| Bismarck, ND | 1,760 | 24.76 | 1.45 | $ 23.43 | $ 48,730 |
| Boston-Cambridge-Nashua, MA-NH | 37,500 | 13.87 | 0.81 | $ 23.38 | $ 48,620 |
| Greeley, CO | 1,710 | 15.92 | 0.93 | $ 23.36 | $ 48,590 |
| Napa, CA | 1,070 | 14.50 | 0.85 | $ 23.31 | $ 48,480 |
Nonmetropolitan areas with the highest employment in Office Clerks, General:
| Nonmetropolitan area | Employment (1) | Employment per thousand jobs | Location quotient (9) | Hourly mean wage | Annual mean wage (2) |
|---|---|---|---|---|---|
| Balance of Lower Peninsula of Michigan nonmetropolitan area | 6,010 | 22.92 | 1.35 | $ 18.72 | $ 38,930 |
| North Texas Region of Texas nonmetropolitan area | 5,310 | 19.42 | 1.14 | $ 15.71 | $ 32,680 |
| North Northeastern Ohio nonmetropolitan area (noncontiguous) | 5,150 | 16.00 | 0.94 | $ 18.26 | $ 37,980 |
| Northern Indiana nonmetropolitan area | 4,980 | 23.85 | 1.40 | $ 17.71 | $ 36,840 |
| West Central Illinois nonmetropolitan area | 4,170 | 25.95 | 1.52 | $ 18.26 | $ 37,990 |
Nonmetropolitan areas with the highest concentration of jobs and location quotients in Office Clerks, General:
| Nonmetropolitan area | Employment (1) | Employment per thousand jobs | Location quotient (9) | Hourly mean wage | Annual mean wage (2) |
|---|---|---|---|---|---|
| Hawaii / Kauai nonmetropolitan area | 2,880 | 29.45 | 1.73 | $ 20.01 | $ 41,630 |
| South Illinois nonmetropolitan area | 2,290 | 26.34 | 1.55 | $ 18.52 | $ 38,520 |
| West Central Illinois nonmetropolitan area | 4,170 | 25.95 | 1.52 | $ 18.26 | $ 37,990 |
| Western Wyoming nonmetropolitan area | 2,480 | 25.77 | 1.51 | $ 20.45 | $ 42,530 |
| West North Dakota nonmetropolitan area | 2,830 | 25.70 | 1.51 | $ 23.62 | $ 49,120 |
Top paying nonmetropolitan areas for Office Clerks, General:
| Nonmetropolitan area | Employment (1) | Employment per thousand jobs | Location quotient (9) | Hourly mean wage | Annual mean wage (2) |
|---|---|---|---|---|---|
| Alaska nonmetropolitan area | 1,530 | 15.07 | 0.89 | $ 24.38 | $ 50,720 |
| Northwest Colorado nonmetropolitan area | 2,040 | 16.59 | 0.97 | $ 24.01 | $ 49,940 |
| West North Dakota nonmetropolitan area | 2,830 | 25.70 | 1.51 | $ 23.62 | $ 49,120 |
| Southwest Colorado nonmetropolitan area | 1,870 | 18.32 | 1.08 | $ 22.57 | $ 46,940 |
| Massachusetts nonmetropolitan area | 1,110 | 18.16 | 1.07 | $ 22.20 | $ 46,180 |
These estimates are calculated with data collected from employers in all industry sectors, all metropolitan and nonmetropolitan areas, and all states and the District of Columbia. The top employment and wage figures are provided above. The complete list is available in the downloadable XLS files.
The percentile wage estimate is the value of a wage below which a certain percent of workers fall. The median wage is the 50th percentile wage estimate—50 percent of workers earn less than the median and 50 percent of workers earn more than the median. More about percentile wages.
(1) Estimates for detailed occupations do not sum to the totals because the totals include occupations not shown separately. Estimates do not include self-employed workers.
(2) Annual wages have been calculated by multiplying the hourly mean wage by a "year-round, full-time" hours figure of 2,080 hours; for those occupations where there is not an hourly wage published, the annual wage has been directly calculated from the reported survey data.
(3) The relative standard error (RSE) is a measure of the reliability of a survey statistic. The smaller the relative standard error, the more precise the estimate.
(9) The location quotient is the ratio of the area concentration of occupational employment to the national average concentration. A location quotient greater than one indicates the occupation has a higher share of employment than average, and a location quotient less than one indicates the occupation is less prevalent in the area than average.
Other OEWS estimates and related information:
May 2022 National Occupational Employment and Wage Estimates
May 2022 State Occupational Employment and Wage Estimates
May 2022 Metropolitan and Nonmetropolitan Area Occupational Employment and Wage Estimates
May 2022 National Industry-Specific Occupational Employment and Wage Estimates
Last Modified Date: April 25, 2023