An official website of the United States government
 United States Department of Labor
All office and administrative support workers not listed separately.
Employment estimate and mean wage estimates for Office and Administrative Support Workers, All Other:
| Employment (1) | Employment RSE (3) |
Mean hourly wage |
Mean annual wage (2) |
Wage RSE (3) |
|---|---|---|---|---|
| 174,590 | 0.8 % | $ 20.75 | $ 43,150 | 0.3 % |
Percentile wage estimates for Office and Administrative Support Workers, All Other:
| Percentile | 10% | 25% | 50% (Median) |
75% | 90% |
|---|---|---|---|---|---|
| Hourly Wage | $ 12.71 | $ 15.08 | $ 18.59 | $ 23.91 | $ 30.24 |
| Annual Wage (2) | $ 26,440 | $ 31,360 | $ 38,660 | $ 49,720 | $ 62,900 |
Industries with the highest published employment and wages for Office and Administrative Support Workers, All Other are provided. For a list of all industries with employment in Office and Administrative Support Workers, All Other, see the Create Customized Tables function.
Industries with the highest levels of employment in Office and Administrative Support Workers, All Other:
| Industry | Employment (1) | Percent of industry employment | Hourly mean wage | Annual mean wage (2) |
|---|---|---|---|---|
| Colleges, Universities, and Professional Schools | 39,090 | 1.29 | $ 17.99 | $ 37,430 |
| Local Government, excluding schools and hospitals (OEWS Designation) | 22,110 | 0.41 | $ 18.74 | $ 38,970 |
| Federal Executive Branch (OEWS Designation) | 11,350 | 0.54 | $ 25.54 | $ 53,110 |
| State Government, excluding schools and hospitals (OEWS Designation) | 7,780 | 0.37 | $ 22.05 | $ 45,870 |
| Elementary and Secondary Schools | 7,380 | 0.09 | $ 17.62 | $ 36,650 |
Industries with the highest concentration of employment in Office and Administrative Support Workers, All Other:
| Industry | Employment (1) | Percent of industry employment | Hourly mean wage | Annual mean wage (2) |
|---|---|---|---|---|
| Colleges, Universities, and Professional Schools | 39,090 | 1.29 | $ 17.99 | $ 37,430 |
| Media Streaming Distribution Services, Social Networks, and Other Media Networks and Content Providers | 1,750 | 0.75 | $ 29.94 | $ 62,280 |
| Junior Colleges | 3,920 | 0.63 | $ 18.44 | $ 38,360 |
| Federal Executive Branch (OEWS Designation) | 11,350 | 0.54 | $ 25.54 | $ 53,110 |
| Local Government, excluding schools and hospitals (OEWS Designation) | 22,110 | 0.41 | $ 18.74 | $ 38,970 |
Top paying industries for Office and Administrative Support Workers, All Other:
| Industry | Employment (1) | Percent of industry employment | Hourly mean wage | Annual mean wage (2) |
|---|---|---|---|---|
| Scientific Research and Development Services | 1,050 | 0.12 | $ 32.19 | $ 66,960 |
| Local Messengers and Local Delivery | (8) | (8) | $ 30.38 | $ 63,190 |
| Wholesale Trade Agents and Brokers | 790 | 0.16 | $ 30.32 | $ 63,070 |
| Foundation, Structure, and Building Exterior Contractors | 340 | 0.04 | $ 30.30 | $ 63,020 |
| Media Streaming Distribution Services, Social Networks, and Other Media Networks and Content Providers | 1,750 | 0.75 | $ 29.94 | $ 62,280 |
States and areas with the highest published employment, location quotients, and wages for Office and Administrative Support Workers, All Other are provided. For a list of all areas with employment in Office and Administrative Support Workers, All Other, see the Create Customized Tables function.
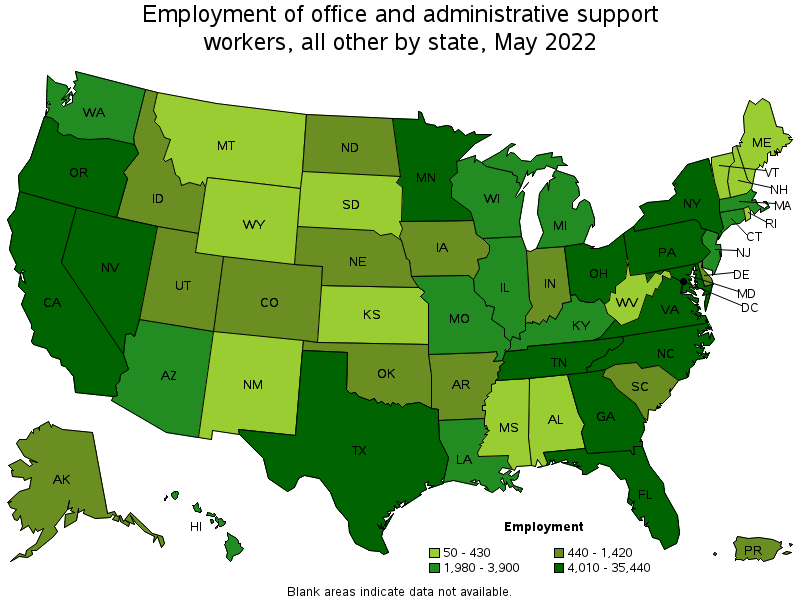
States with the highest employment level in Office and Administrative Support Workers, All Other:
| State | Employment (1) | Employment per thousand jobs | Location quotient (9) | Hourly mean wage | Annual mean wage (2) |
|---|---|---|---|---|---|
| California | 35,440 | 2.01 | 1.70 | $ 23.67 | $ 49,240 |
| Florida | 17,990 | 1.95 | 1.65 | $ 19.54 | $ 40,630 |
| Texas | 9,820 | 0.76 | 0.64 | $ 20.12 | $ 41,860 |
| Maryland | 7,390 | 2.80 | 2.37 | $ 21.87 | $ 45,480 |
| North Carolina | 7,280 | 1.57 | 1.33 | $ 20.29 | $ 42,210 |
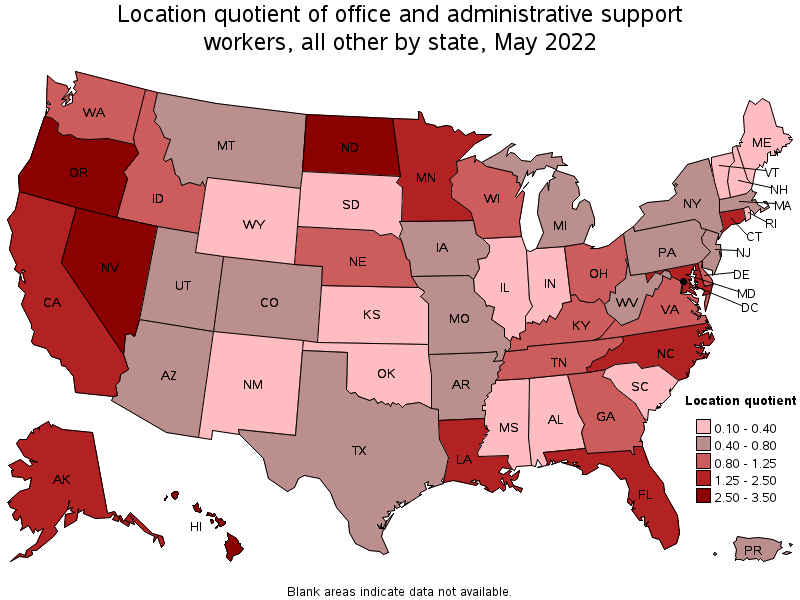
States with the highest concentration of jobs and location quotients in Office and Administrative Support Workers, All Other:
| State | Employment (1) | Employment per thousand jobs | Location quotient (9) | Hourly mean wage | Annual mean wage (2) |
|---|---|---|---|---|---|
| Hawaii | 2,090 | 3.51 | 2.97 | $ 16.03 | $ 33,350 |
| Nevada | 4,590 | 3.25 | 2.75 | $ 15.07 | $ 31,340 |
| District of Columbia | 2,210 | 3.20 | 2.71 | $ 23.91 | $ 49,720 |
| Oregon | 5,940 | 3.13 | 2.65 | $ 21.83 | $ 45,410 |
| North Dakota | 1,260 | 3.12 | 2.64 | $ 24.78 | $ 51,540 |
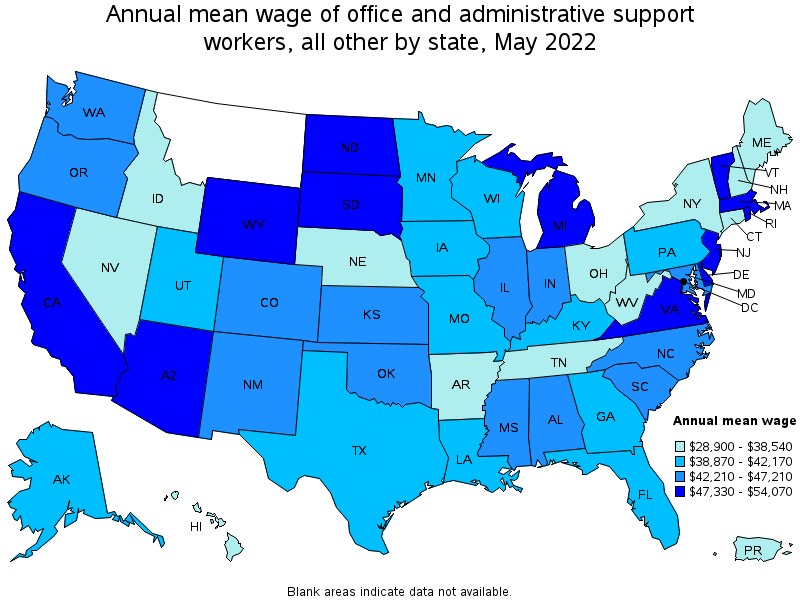
Top paying states for Office and Administrative Support Workers, All Other:
| State | Employment (1) | Employment per thousand jobs | Location quotient (9) | Hourly mean wage | Annual mean wage (2) |
|---|---|---|---|---|---|
| Vermont | 130 | 0.45 | 0.38 | $ 25.99 | $ 54,070 |
| Rhode Island | 110 | 0.23 | 0.19 | $ 25.86 | $ 53,790 |
| Delaware | 490 | 1.08 | 0.92 | $ 25.68 | $ 53,410 |
| North Dakota | 1,260 | 3.12 | 2.64 | $ 24.78 | $ 51,540 |
| Wyoming | 60 | 0.21 | 0.18 | $ 24.33 | $ 50,610 |
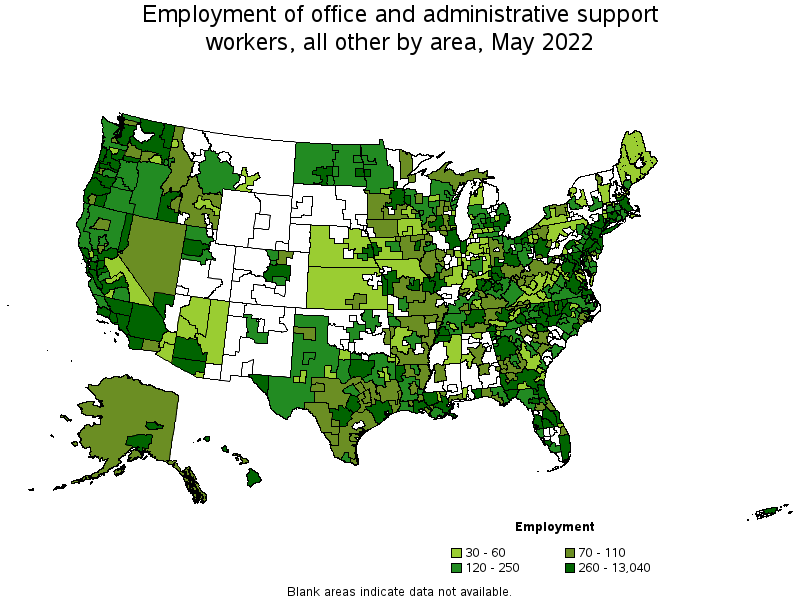
Metropolitan areas with the highest employment level in Office and Administrative Support Workers, All Other:
| Metropolitan area | Employment (1) | Employment per thousand jobs | Location quotient (9) | Hourly mean wage | Annual mean wage (2) |
|---|---|---|---|---|---|
| Los Angeles-Long Beach-Anaheim, CA | 13,040 | 2.14 | 1.81 | $ 23.32 | $ 48,510 |
| New York-Newark-Jersey City, NY-NJ-PA | 6,840 | 0.74 | 0.63 | $ 19.35 | $ 40,240 |
| San Francisco-Oakland-Hayward, CA | 6,230 | 2.60 | 2.21 | $ 25.42 | $ 52,860 |
| Washington-Arlington-Alexandria, DC-VA-MD-WV | 5,400 | 1.79 | 1.51 | $ 24.49 | $ 50,940 |
| Baltimore-Columbia-Towson, MD | 4,040 | 3.12 | 2.64 | $ 21.80 | $ 45,350 |
| Minneapolis-St. Paul-Bloomington, MN-WI | 3,850 | 2.04 | 1.73 | $ 18.64 | $ 38,770 |
| Las Vegas-Henderson-Paradise, NV | 3,690 | 3.61 | 3.05 | $ 13.63 | $ 28,350 |
| Portland-Vancouver-Hillsboro, OR-WA | 3,510 | 2.97 | 2.51 | $ 22.65 | $ 47,100 |
| Miami-Fort Lauderdale-West Palm Beach, FL | 3,310 | 1.26 | 1.07 | $ 20.53 | $ 42,700 |
| Gainesville, FL | 3,170 | 23.11 | 19.58 | $ 18.94 | $ 39,400 |
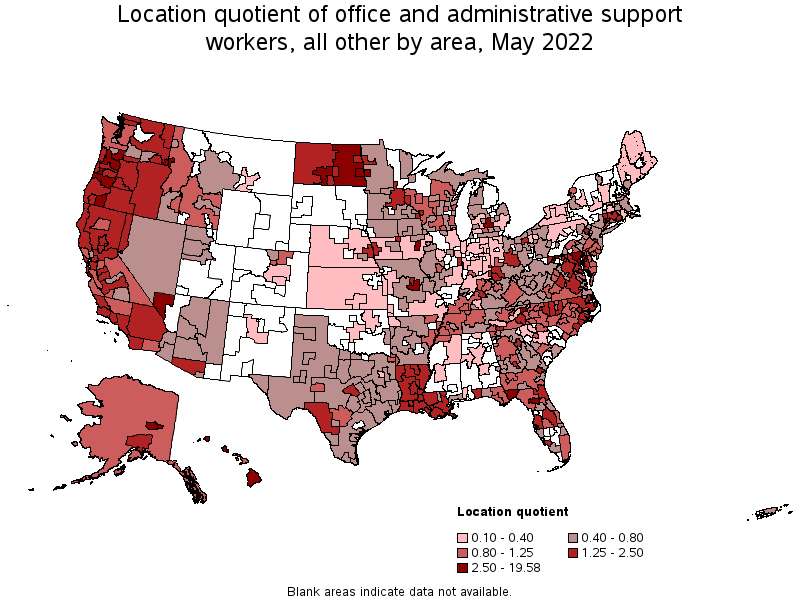
Metropolitan areas with the highest concentration of jobs and location quotients in Office and Administrative Support Workers, All Other:
| Metropolitan area | Employment (1) | Employment per thousand jobs | Location quotient (9) | Hourly mean wage | Annual mean wage (2) |
|---|---|---|---|---|---|
| Gainesville, FL | 3,170 | 23.11 | 19.58 | $ 18.94 | $ 39,400 |
| Jefferson City, MO | 910 | 12.44 | 10.54 | $ 18.46 | $ 38,410 |
| Tallahassee, FL | 2,040 | 11.59 | 9.82 | $ 17.61 | $ 36,620 |
| Fairbanks, AK | 360 | 10.40 | 8.81 | $ 17.28 | $ 35,950 |
| Johnson City, TN | 550 | 6.84 | 5.79 | $ 15.23 | $ 31,680 |
| Carson City, NV | 190 | 6.26 | 5.30 | $ 27.58 | $ 57,360 |
| Lewiston, ID-WA | 150 | 5.48 | 4.64 | $ 18.20 | $ 37,860 |
| Iowa City, IA | 490 | 5.40 | 4.58 | $ 23.72 | $ 49,330 |
| Lansing-East Lansing, MI | 1,010 | 4.97 | 4.21 | $ 26.87 | $ 55,880 |
| Urban Honolulu, HI | 1,640 | 3.88 | 3.29 | $ 15.49 | $ 32,210 |
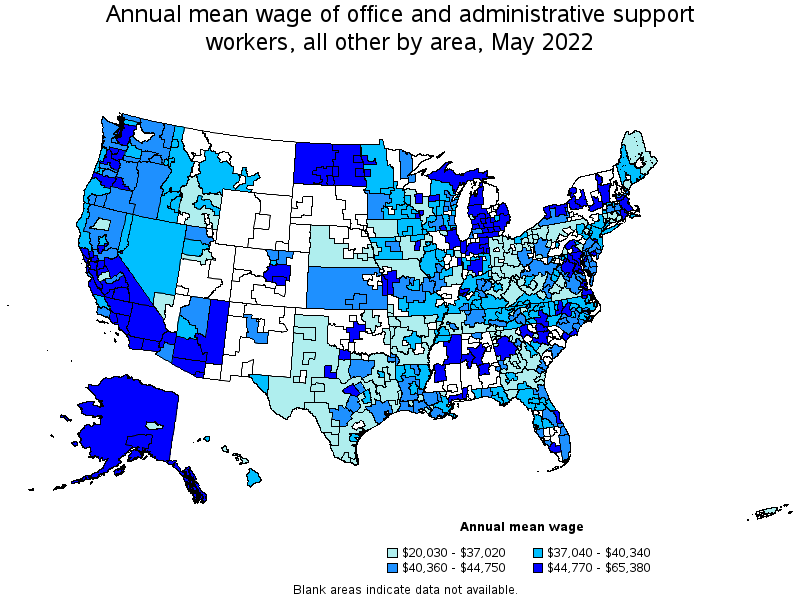
Top paying metropolitan areas for Office and Administrative Support Workers, All Other:
| Metropolitan area | Employment (1) | Employment per thousand jobs | Location quotient (9) | Hourly mean wage | Annual mean wage (2) |
|---|---|---|---|---|---|
| San Jose-Sunnyvale-Santa Clara, CA | 1,640 | 1.46 | 1.24 | $ 31.43 | $ 65,380 |
| Burlington-South Burlington, VT | 80 | 0.64 | 0.54 | $ 29.21 | $ 60,770 |
| Carson City, NV | 190 | 6.26 | 5.30 | $ 27.58 | $ 57,360 |
| Napa, CA | 50 | 0.70 | 0.60 | $ 27.07 | $ 56,310 |
| Lansing-East Lansing, MI | 1,010 | 4.97 | 4.21 | $ 26.87 | $ 55,880 |
| El Centro, CA | 80 | 1.31 | 1.11 | $ 26.59 | $ 55,310 |
| Bismarck, ND | 260 | 3.63 | 3.07 | $ 26.49 | $ 55,110 |
| Yuba City, CA | 110 | 2.25 | 1.91 | $ 26.39 | $ 54,900 |
| Providence-Warwick, RI-MA | 120 | 0.21 | 0.18 | $ 25.82 | $ 53,710 |
| Vallejo-Fairfield, CA | 210 | 1.56 | 1.32 | $ 25.69 | $ 53,440 |
Nonmetropolitan areas with the highest employment in Office and Administrative Support Workers, All Other:
| Nonmetropolitan area | Employment (1) | Employment per thousand jobs | Location quotient (9) | Hourly mean wage | Annual mean wage (2) |
|---|---|---|---|---|---|
| Hawaii / Kauai nonmetropolitan area | 360 | 3.66 | 3.10 | $ 18.25 | $ 37,950 |
| Piedmont North Carolina nonmetropolitan area | 310 | 1.26 | 1.07 | $ 19.19 | $ 39,920 |
| Eastern Washington nonmetropolitan area | 290 | 2.89 | 2.45 | $ 20.89 | $ 43,450 |
| Coast Oregon nonmetropolitan area | 270 | 2.38 | 2.01 | $ 18.95 | $ 39,420 |
| South Georgia nonmetropolitan area | 260 | 1.39 | 1.18 | $ 15.35 | $ 31,930 |
Nonmetropolitan areas with the highest concentration of jobs and location quotients in Office and Administrative Support Workers, All Other:
| Nonmetropolitan area | Employment (1) | Employment per thousand jobs | Location quotient (9) | Hourly mean wage | Annual mean wage (2) |
|---|---|---|---|---|---|
| East North Dakota nonmetropolitan area | 230 | 3.70 | 3.14 | $ 25.79 | $ 53,640 |
| Hawaii / Kauai nonmetropolitan area | 360 | 3.66 | 3.10 | $ 18.25 | $ 37,950 |
| Eastern Washington nonmetropolitan area | 290 | 2.89 | 2.45 | $ 20.89 | $ 43,450 |
| Central Oregon nonmetropolitan area | 180 | 2.86 | 2.43 | $ 20.80 | $ 43,260 |
| North Coast Region of California nonmetropolitan area | 250 | 2.43 | 2.06 | $ 18.78 | $ 39,060 |
Top paying nonmetropolitan areas for Office and Administrative Support Workers, All Other:
| Nonmetropolitan area | Employment (1) | Employment per thousand jobs | Location quotient (9) | Hourly mean wage | Annual mean wage (2) |
|---|---|---|---|---|---|
| Northern Indiana nonmetropolitan area | 50 | 0.23 | 0.20 | $ 28.49 | $ 59,260 |
| East North Dakota nonmetropolitan area | 230 | 3.70 | 3.14 | $ 25.79 | $ 53,640 |
| Arizona nonmetropolitan area | 50 | 0.53 | 0.45 | $ 24.43 | $ 50,820 |
| Eastern Sierra-Mother Lode Region of California nonmetropolitan area | 60 | 0.99 | 0.84 | $ 24.36 | $ 50,670 |
| Upper Peninsula of Michigan nonmetropolitan area | 100 | 0.92 | 0.78 | $ 23.75 | $ 49,410 |
These estimates are calculated with data collected from employers in all industry sectors, all metropolitan and nonmetropolitan areas, and all states and the District of Columbia. The top employment and wage figures are provided above. The complete list is available in the downloadable XLS files.
The percentile wage estimate is the value of a wage below which a certain percent of workers fall. The median wage is the 50th percentile wage estimate—50 percent of workers earn less than the median and 50 percent of workers earn more than the median. More about percentile wages.
(1) Estimates for detailed occupations do not sum to the totals because the totals include occupations not shown separately. Estimates do not include self-employed workers.
(2) Annual wages have been calculated by multiplying the hourly mean wage by a "year-round, full-time" hours figure of 2,080 hours; for those occupations where there is not an hourly wage published, the annual wage has been directly calculated from the reported survey data.
(3) The relative standard error (RSE) is a measure of the reliability of a survey statistic. The smaller the relative standard error, the more precise the estimate.
(8) Estimate not released.
(9) The location quotient is the ratio of the area concentration of occupational employment to the national average concentration. A location quotient greater than one indicates the occupation has a higher share of employment than average, and a location quotient less than one indicates the occupation is less prevalent in the area than average.
Other OEWS estimates and related information:
May 2022 National Occupational Employment and Wage Estimates
May 2022 State Occupational Employment and Wage Estimates
May 2022 Metropolitan and Nonmetropolitan Area Occupational Employment and Wage Estimates
May 2022 National Industry-Specific Occupational Employment and Wage Estimates
Last Modified Date: April 25, 2023