
An official website of the United States government
An official website of the United States government
The .gov means it's official.
Federal government websites often end in .gov or .mil. Before sharing sensitive information,
make sure you're on a federal government site.
The site is secure.
The
https:// ensures that you are connecting to the official website and that any
information you provide is encrypted and transmitted securely.
Directly supervise and coordinate the activities of mechanics, installers, and repairers. May also advise customers on recommended services. Excludes team or work leaders.
Employment estimate and mean wage estimates for First-Line Supervisors of Mechanics, Installers, and Repairers:
| Employment (1) | Employment RSE (3) |
Mean hourly wage |
Mean annual wage (2) |
Wage RSE (3) |
|---|---|---|---|---|
| 559,050 | 0.5 % | $ 36.55 | $ 76,020 | 0.3 % |
Percentile wage estimates for First-Line Supervisors of Mechanics, Installers, and Repairers:
| Percentile | 10% | 25% | 50% (Median) |
75% | 90% |
|---|---|---|---|---|---|
| Hourly Wage | $ 21.59 | $ 27.29 | $ 35.16 | $ 44.50 | $ 53.86 |
| Annual Wage (2) | $ 44,900 | $ 56,760 | $ 73,140 | $ 92,560 | $ 112,020 |
Industries with the highest published employment and wages for First-Line Supervisors of Mechanics, Installers, and Repairers are provided. For a list of all industries with employment in First-Line Supervisors of Mechanics, Installers, and Repairers, see the Create Customized Tables function.
Industries with the highest levels of employment in First-Line Supervisors of Mechanics, Installers, and Repairers:
| Industry | Employment (1) | Percent of industry employment | Hourly mean wage | Annual mean wage (2) |
|---|---|---|---|---|
| Real Estate | 46,700 | 2.63 | $ 30.33 | $ 63,090 |
| Automotive Repair and Maintenance | 44,200 | 4.57 | $ 30.51 | $ 63,460 |
| Building Equipment Contractors | 38,540 | 1.64 | $ 37.97 | $ 78,970 |
| Local Government, excluding schools and hospitals (OEWS Designation) | 33,920 | 0.63 | $ 36.66 | $ 76,250 |
| Automobile Dealers | 29,770 | 2.38 | $ 40.13 | $ 83,480 |
Industries with the highest concentration of employment in First-Line Supervisors of Mechanics, Installers, and Repairers:
| Industry | Employment (1) | Percent of industry employment | Hourly mean wage | Annual mean wage (2) |
|---|---|---|---|---|
| Electric Power Generation, Transmission and Distribution | 17,880 | 4.73 | $ 54.18 | $ 112,700 |
| Automotive Repair and Maintenance | 44,200 | 4.57 | $ 30.51 | $ 63,460 |
| Commercial and Industrial Machinery and Equipment (except Automotive and Electronic) Repair and Maintenance | 8,360 | 3.79 | $ 36.95 | $ 76,850 |
| Support Activities for Rail Transportation | 1,220 | 3.66 | $ 34.78 | $ 72,350 |
| Electronic and Precision Equipment Repair and Maintenance | 3,620 | 3.44 | $ 33.51 | $ 69,700 |
Top paying industries for First-Line Supervisors of Mechanics, Installers, and Repairers:
| Industry | Employment (1) | Percent of industry employment | Hourly mean wage | Annual mean wage (2) |
|---|---|---|---|---|
| Pipeline Transportation of Crude Oil | 160 | 1.43 | $ 60.20 | $ 125,210 |
| Oil and Gas Extraction | 980 | 0.96 | $ 60.01 | $ 124,810 |
| Other Pipeline Transportation | 40 | 0.52 | $ 59.93 | $ 124,650 |
| Petroleum and Coal Products Manufacturing | 1,470 | 1.42 | $ 58.78 | $ 122,270 |
| Pipeline Transportation of Natural Gas | 440 | 1.41 | $ 54.60 | $ 113,560 |
States and areas with the highest published employment, location quotients, and wages for First-Line Supervisors of Mechanics, Installers, and Repairers are provided. For a list of all areas with employment in First-Line Supervisors of Mechanics, Installers, and Repairers, see the Create Customized Tables function.
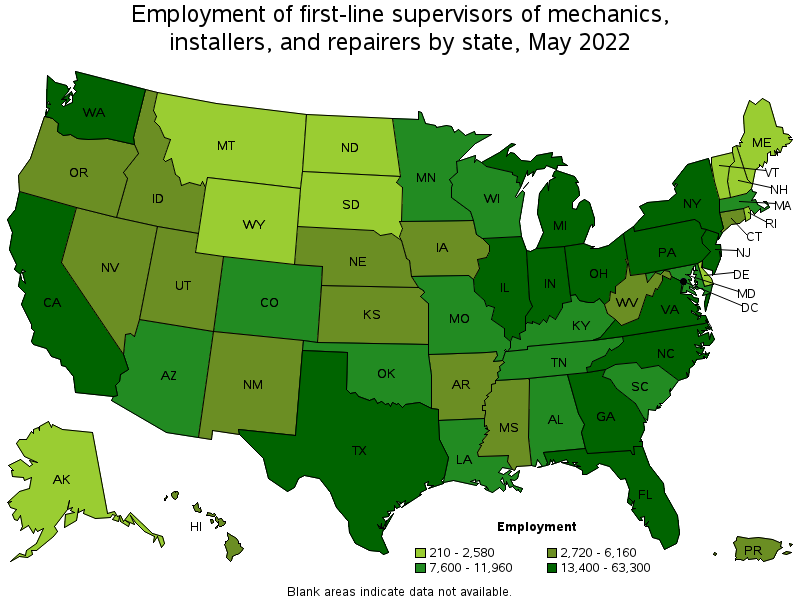
States with the highest employment level in First-Line Supervisors of Mechanics, Installers, and Repairers:
| State | Employment (1) | Employment per thousand jobs | Location quotient (9) | Hourly mean wage | Annual mean wage (2) |
|---|---|---|---|---|---|
| Texas | 63,300 | 4.87 | 1.29 | $ 35.14 | $ 73,080 |
| California | 47,580 | 2.70 | 0.71 | $ 42.12 | $ 87,610 |
| Florida | 34,700 | 3.77 | 1.00 | $ 32.98 | $ 68,600 |
| New York | 29,270 | 3.21 | 0.85 | $ 39.44 | $ 82,040 |
| Pennsylvania | 22,430 | 3.86 | 1.02 | $ 35.83 | $ 74,530 |
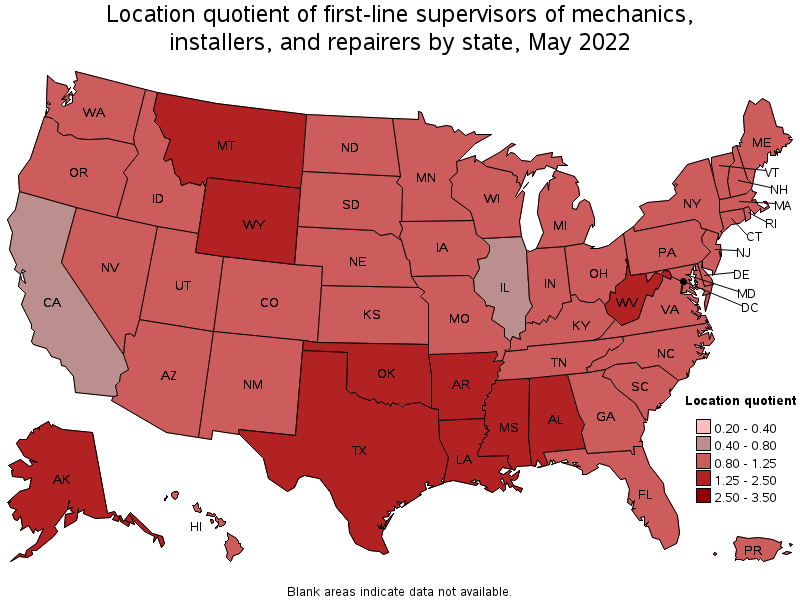
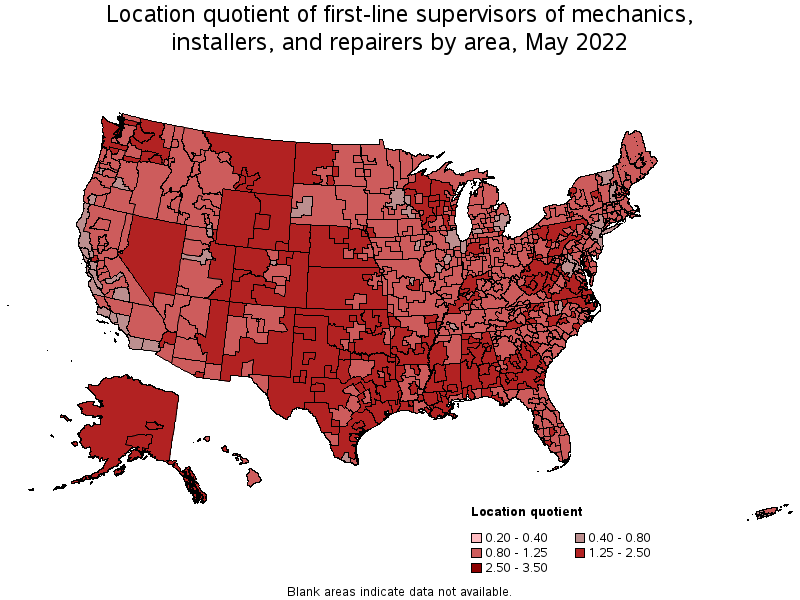
States with the highest concentration of jobs and location quotients in First-Line Supervisors of Mechanics, Installers, and Repairers:
| State | Employment (1) | Employment per thousand jobs | Location quotient (9) | Hourly mean wage | Annual mean wage (2) |
|---|---|---|---|---|---|
| Wyoming | 1,870 | 6.99 | 1.85 | $ 39.54 | $ 82,250 |
| Alaska | 2,050 | 6.69 | 1.77 | $ 41.22 | $ 85,730 |
| Alabama | 11,730 | 5.85 | 1.55 | $ 34.21 | $ 71,150 |
| Louisiana | 9,870 | 5.34 | 1.41 | $ 34.90 | $ 72,600 |
| Montana | 2,580 | 5.26 | 1.39 | $ 34.25 | $ 71,240 |
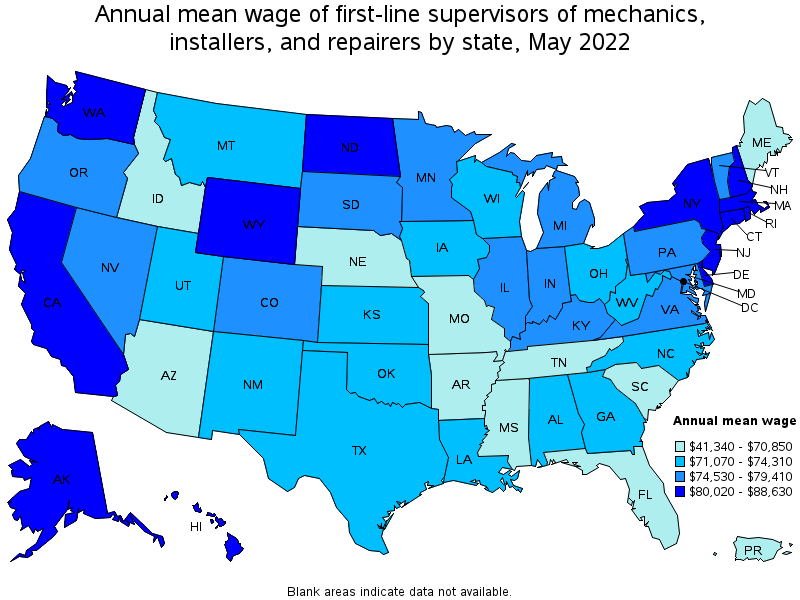
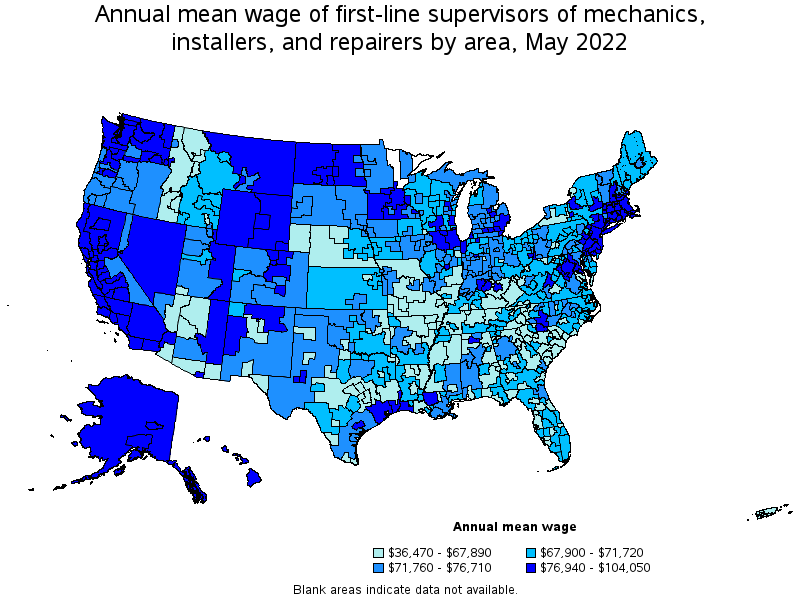
Top paying states for First-Line Supervisors of Mechanics, Installers, and Repairers:
| State | Employment (1) | Employment per thousand jobs | Location quotient (9) | Hourly mean wage | Annual mean wage (2) |
|---|---|---|---|---|---|
| Hawaii | 2,720 | 4.58 | 1.21 | $ 42.61 | $ 88,630 |
| District of Columbia | 720 | 1.05 | 0.28 | $ 42.15 | $ 87,670 |
| California | 47,580 | 2.70 | 0.71 | $ 42.12 | $ 87,610 |
| New Jersey | 13,790 | 3.35 | 0.89 | $ 41.59 | $ 86,520 |
| Washington | 14,090 | 4.14 | 1.09 | $ 41.40 | $ 86,110 |
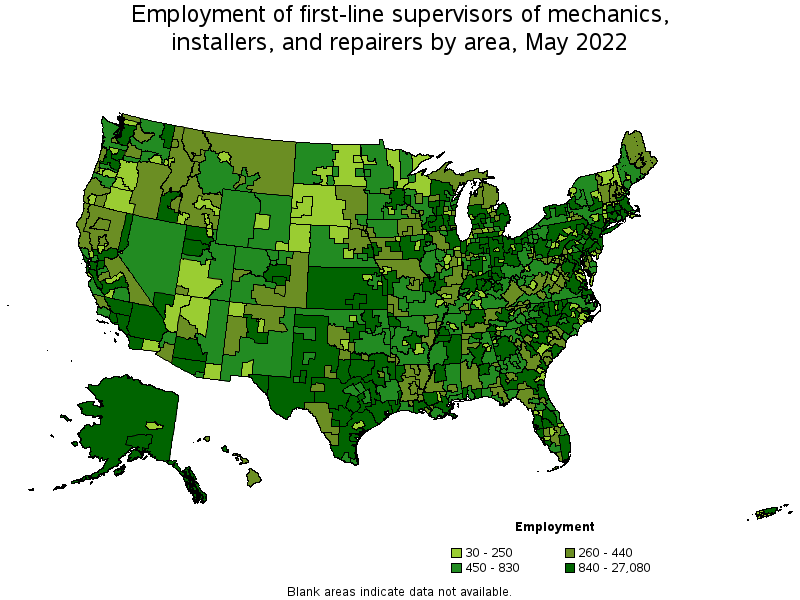
Metropolitan areas with the highest employment level in First-Line Supervisors of Mechanics, Installers, and Repairers:
| Metropolitan area | Employment (1) | Employment per thousand jobs | Location quotient (9) | Hourly mean wage | Annual mean wage (2) |
|---|---|---|---|---|---|
| New York-Newark-Jersey City, NY-NJ-PA | 27,080 | 2.95 | 0.78 | $ 42.40 | $ 88,180 |
| Dallas-Fort Worth-Arlington, TX | 16,760 | 4.40 | 1.17 | $ 35.57 | $ 73,980 |
| Houston-The Woodlands-Sugar Land, TX | 15,850 | 5.19 | 1.37 | $ 37.78 | $ 78,590 |
| Los Angeles-Long Beach-Anaheim, CA | 13,680 | 2.24 | 0.59 | $ 41.87 | $ 87,080 |
| Atlanta-Sandy Springs-Roswell, GA | 11,720 | 4.30 | 1.14 | $ 35.79 | $ 74,450 |
| Chicago-Naperville-Elgin, IL-IN-WI | 11,590 | 2.62 | 0.69 | $ 39.62 | $ 82,410 |
| Miami-Fort Lauderdale-West Palm Beach, FL | 9,410 | 3.59 | 0.95 | $ 34.00 | $ 70,720 |
| Philadelphia-Camden-Wilmington, PA-NJ-DE-MD | 9,300 | 3.36 | 0.89 | $ 38.91 | $ 80,930 |
| Washington-Arlington-Alexandria, DC-VA-MD-WV | 8,830 | 2.92 | 0.77 | $ 40.86 | $ 84,990 |
| Boston-Cambridge-Nashua, MA-NH | 8,450 | 3.13 | 0.83 | $ 42.27 | $ 87,920 |
Metropolitan areas with the highest concentration of jobs and location quotients in First-Line Supervisors of Mechanics, Installers, and Repairers:
| Metropolitan area | Employment (1) | Employment per thousand jobs | Location quotient (9) | Hourly mean wage | Annual mean wage (2) |
|---|---|---|---|---|---|
| Bremerton-Silverdale, WA | 1,080 | 11.93 | 3.16 | $ 46.28 | $ 96,250 |
| Decatur, AL | 490 | 8.63 | 2.28 | $ 37.21 | $ 77,390 |
| Midland, TX | 880 | 8.41 | 2.22 | $ 41.48 | $ 86,280 |
| Odessa, TX | 570 | 7.75 | 2.05 | $ 37.63 | $ 78,270 |
| Beaumont-Port Arthur, TX | 1,150 | 7.60 | 2.01 | $ 37.14 | $ 77,240 |
| Mobile, AL | 1,260 | 7.40 | 1.96 | $ 34.73 | $ 72,230 |
| Houma-Thibodaux, LA | 570 | 7.36 | 1.95 | $ 34.58 | $ 71,920 |
| Texarkana, TX-AR | 390 | 6.89 | 1.82 | $ 32.25 | $ 67,070 |
| Alexandria, LA | 410 | 6.83 | 1.81 | $ 32.06 | $ 66,680 |
| Longview, TX | 630 | 6.73 | 1.78 | $ 33.83 | $ 70,370 |
Top paying metropolitan areas for First-Line Supervisors of Mechanics, Installers, and Repairers:
| Metropolitan area | Employment (1) | Employment per thousand jobs | Location quotient (9) | Hourly mean wage | Annual mean wage (2) |
|---|---|---|---|---|---|
| San Jose-Sunnyvale-Santa Clara, CA | 2,460 | 2.19 | 0.58 | $ 50.02 | $ 104,050 |
| San Francisco-Oakland-Hayward, CA | 6,220 | 2.60 | 0.69 | $ 46.76 | $ 97,270 |
| Bremerton-Silverdale, WA | 1,080 | 11.93 | 3.16 | $ 46.28 | $ 96,250 |
| Jackson, MI | 300 | 5.44 | 1.44 | $ 45.85 | $ 95,370 |
| Napa, CA | 210 | 2.85 | 0.75 | $ 45.69 | $ 95,020 |
| San Luis Obispo-Paso Robles-Arroyo Grande, CA | 440 | 3.68 | 0.97 | $ 44.18 | $ 91,900 |
| Vallejo-Fairfield, CA | 690 | 4.97 | 1.31 | $ 44.11 | $ 91,760 |
| Santa Rosa, CA | 600 | 2.93 | 0.78 | $ 43.97 | $ 91,450 |
| Longview, WA | 240 | 6.01 | 1.59 | $ 43.91 | $ 91,330 |
| Midland, MI | 140 | 3.94 | 1.04 | $ 43.82 | $ 91,150 |
Nonmetropolitan areas with the highest employment in First-Line Supervisors of Mechanics, Installers, and Repairers:
| Nonmetropolitan area | Employment (1) | Employment per thousand jobs | Location quotient (9) | Hourly mean wage | Annual mean wage (2) |
|---|---|---|---|---|---|
| Kansas nonmetropolitan area | 2,310 | 6.03 | 1.60 | $ 32.83 | $ 68,290 |
| North Texas Region of Texas nonmetropolitan area | 1,500 | 5.48 | 1.45 | $ 32.95 | $ 68,540 |
| West Texas Region of Texas nonmetropolitan area | 1,450 | 7.39 | 1.96 | $ 35.41 | $ 73,650 |
| Piedmont North Carolina nonmetropolitan area | 1,420 | 5.68 | 1.50 | $ 34.77 | $ 72,320 |
| Hill Country Region of Texas nonmetropolitan area | 1,330 | 6.79 | 1.80 | $ 30.21 | $ 62,830 |
Nonmetropolitan areas with the highest concentration of jobs and location quotients in First-Line Supervisors of Mechanics, Installers, and Repairers:
| Nonmetropolitan area | Employment (1) | Employment per thousand jobs | Location quotient (9) | Hourly mean wage | Annual mean wage (2) |
|---|---|---|---|---|---|
| Alaska nonmetropolitan area | 860 | 8.42 | 2.23 | $ 39.86 | $ 82,910 |
| Western Wyoming nonmetropolitan area | 750 | 7.82 | 2.07 | $ 39.26 | $ 81,670 |
| Nevada nonmetropolitan area | 740 | 7.44 | 1.97 | $ 40.08 | $ 83,360 |
| West Texas Region of Texas nonmetropolitan area | 1,450 | 7.39 | 1.96 | $ 35.41 | $ 73,650 |
| Eastern Wyoming nonmetropolitan area | 580 | 7.06 | 1.87 | $ 40.98 | $ 85,240 |
Top paying nonmetropolitan areas for First-Line Supervisors of Mechanics, Installers, and Repairers:
| Nonmetropolitan area | Employment (1) | Employment per thousand jobs | Location quotient (9) | Hourly mean wage | Annual mean wage (2) |
|---|---|---|---|---|---|
| West North Dakota nonmetropolitan area | 580 | 5.24 | 1.39 | $ 46.98 | $ 97,720 |
| Eastern Wyoming nonmetropolitan area | 580 | 7.06 | 1.87 | $ 40.98 | $ 85,240 |
| Northern New Mexico nonmetropolitan area | 300 | 3.79 | 1.00 | $ 40.17 | $ 83,550 |
| Nevada nonmetropolitan area | 740 | 7.44 | 1.97 | $ 40.08 | $ 83,360 |
| Alaska nonmetropolitan area | 860 | 8.42 | 2.23 | $ 39.86 | $ 82,910 |
These estimates are calculated with data collected from employers in all industry sectors, all metropolitan and nonmetropolitan areas, and all states and the District of Columbia. The top employment and wage figures are provided above. The complete list is available in the downloadable XLS files.
The percentile wage estimate is the value of a wage below which a certain percent of workers fall. The median wage is the 50th percentile wage estimate—50 percent of workers earn less than the median and 50 percent of workers earn more than the median. More about percentile wages.
(1) Estimates for detailed occupations do not sum to the totals because the totals include occupations not shown separately. Estimates do not include self-employed workers.
(2) Annual wages have been calculated by multiplying the hourly mean wage by a "year-round, full-time" hours figure of 2,080 hours; for those occupations where there is not an hourly wage published, the annual wage has been directly calculated from the reported survey data.
(3) The relative standard error (RSE) is a measure of the reliability of a survey statistic. The smaller the relative standard error, the more precise the estimate.
(9) The location quotient is the ratio of the area concentration of occupational employment to the national average concentration. A location quotient greater than one indicates the occupation has a higher share of employment than average, and a location quotient less than one indicates the occupation is less prevalent in the area than average.
Other OEWS estimates and related information:
May 2022 National Occupational Employment and Wage Estimates
May 2022 State Occupational Employment and Wage Estimates
May 2022 Metropolitan and Nonmetropolitan Area Occupational Employment and Wage Estimates
May 2022 National Industry-Specific Occupational Employment and Wage Estimates
Last Modified Date: April 25, 2023