
An official website of the United States government
An official website of the United States government
The .gov means it's official.
Federal government websites often end in .gov or .mil. Before sharing sensitive information,
make sure you're on a federal government site.
The site is secure.
The
https:// ensures that you are connecting to the official website and that any
information you provide is encrypted and transmitted securely.
Repair and refinish automotive vehicle bodies and straighten vehicle frames. Excludes �Automotive Glass Installers and Repairers� (49-3022) and �Coating, Painting, and Spraying Machine Setters, Operators, and Tenders� (51-9124).
Employment estimate and mean wage estimates for Automotive Body and Related Repairers:
| Employment (1) | Employment RSE (3) |
Mean hourly wage |
Mean annual wage (2) |
Wage RSE (3) |
|---|---|---|---|---|
| 138,760 | 1.2 % | $ 25.59 | $ 53,220 | 0.6 % |
Percentile wage estimates for Automotive Body and Related Repairers:
| Percentile | 10% | 25% | 50% (Median) |
75% | 90% |
|---|---|---|---|---|---|
| Hourly Wage | $ 15.56 | $ 18.59 | $ 22.92 | $ 29.45 | $ 37.72 |
| Annual Wage (2) | $ 32,370 | $ 38,680 | $ 47,670 | $ 61,250 | $ 78,460 |
Industries with the highest published employment and wages for Automotive Body and Related Repairers are provided. For a list of all industries with employment in Automotive Body and Related Repairers, see the Create Customized Tables function.
Industries with the highest levels of employment in Automotive Body and Related Repairers:
| Industry | Employment (1) | Percent of industry employment | Hourly mean wage | Annual mean wage (2) |
|---|---|---|---|---|
| Automotive Repair and Maintenance | 102,450 | 10.60 | $ 25.88 | $ 53,840 |
| Automobile Dealers | 24,750 | 1.98 | $ 24.44 | $ 50,830 |
| Motor Vehicle and Motor Vehicle Parts and Supplies Merchant Wholesalers | 2,330 | 0.66 | $ 24.72 | $ 51,410 |
| Automotive Equipment Rental and Leasing | 1,310 | 0.68 | $ 23.12 | $ 48,090 |
| Automotive Parts, Accessories, and Tire Retailers | 1,170 | 0.21 | $ 20.54 | $ 42,720 |
Industries with the highest concentration of employment in Automotive Body and Related Repairers:
| Industry | Employment (1) | Percent of industry employment | Hourly mean wage | Annual mean wage (2) |
|---|---|---|---|---|
| Automotive Repair and Maintenance | 102,450 | 10.60 | $ 25.88 | $ 53,840 |
| Automobile Dealers | 24,750 | 1.98 | $ 24.44 | $ 50,830 |
| Automotive Equipment Rental and Leasing | 1,310 | 0.68 | $ 23.12 | $ 48,090 |
| Motor Vehicle and Motor Vehicle Parts and Supplies Merchant Wholesalers | 2,330 | 0.66 | $ 24.72 | $ 51,410 |
| Spectator Sports | 680 | 0.51 | $ 33.87 | $ 70,450 |
Top paying industries for Automotive Body and Related Repairers:
| Industry | Employment (1) | Percent of industry employment | Hourly mean wage | Annual mean wage (2) |
|---|---|---|---|---|
| Couriers and Express Delivery Services | 30 | (7) | $ 37.22 | $ 77,410 |
| Postal Service (federal government) | 170 | 0.03 | $ 34.39 | $ 71,530 |
| Spectator Sports | 680 | 0.51 | $ 33.87 | $ 70,450 |
| Local Government, excluding schools and hospitals (OEWS Designation) | 830 | 0.02 | $ 32.34 | $ 67,260 |
| Federal Executive Branch (OEWS Designation) | 130 | 0.01 | $ 31.35 | $ 65,200 |
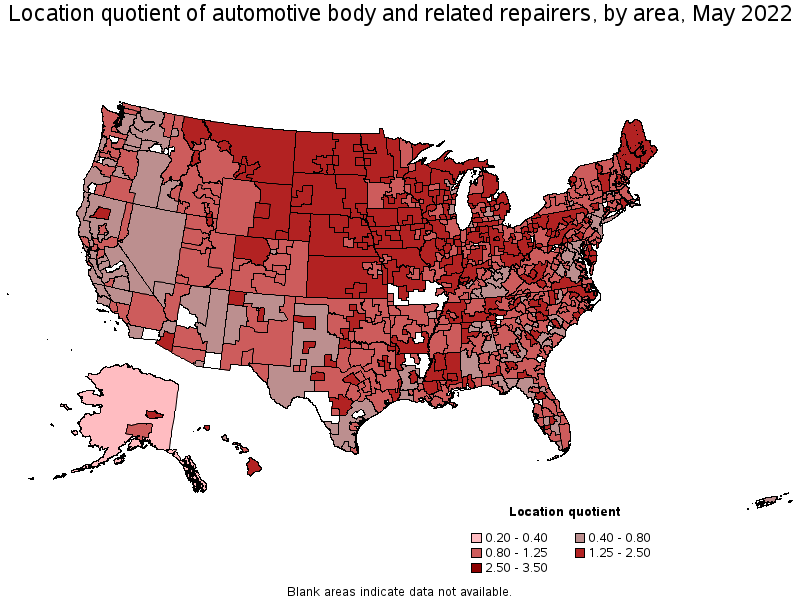
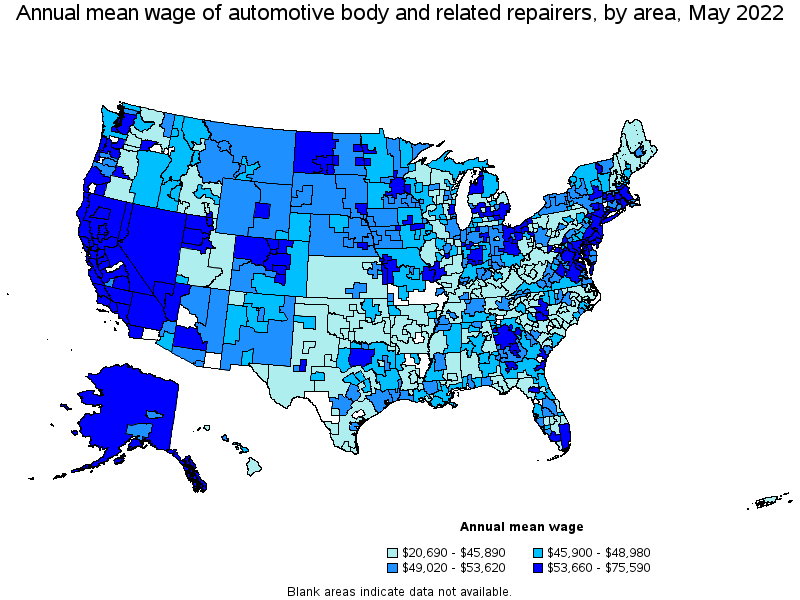
States and areas with the highest published employment, location quotients, and wages for Automotive Body and Related Repairers are provided. For a list of all areas with employment in Automotive Body and Related Repairers, see the Create Customized Tables function.
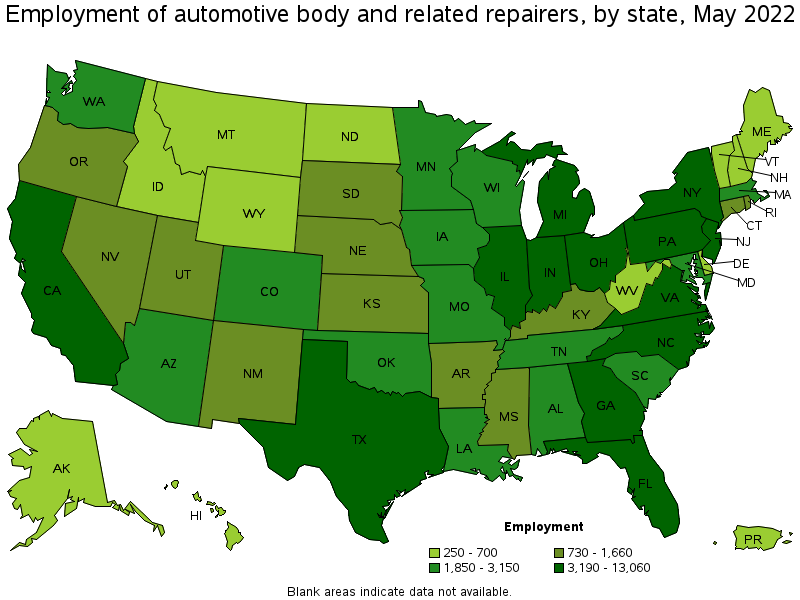
States with the highest employment level in Automotive Body and Related Repairers:
| State | Employment (1) | Employment per thousand jobs | Location quotient (9) | Hourly mean wage | Annual mean wage (2) |
|---|---|---|---|---|---|
| California | 13,060 | 0.74 | 0.79 | $ 28.88 | $ 60,070 |
| Texas | 12,760 | 0.98 | 1.05 | $ 24.52 | $ 50,990 |
| Florida | 7,880 | 0.86 | 0.91 | $ 24.37 | $ 50,690 |
| New York | 6,700 | 0.74 | 0.78 | $ 26.80 | $ 55,740 |
| Ohio | 6,290 | 1.17 | 1.25 | $ 25.45 | $ 52,930 |
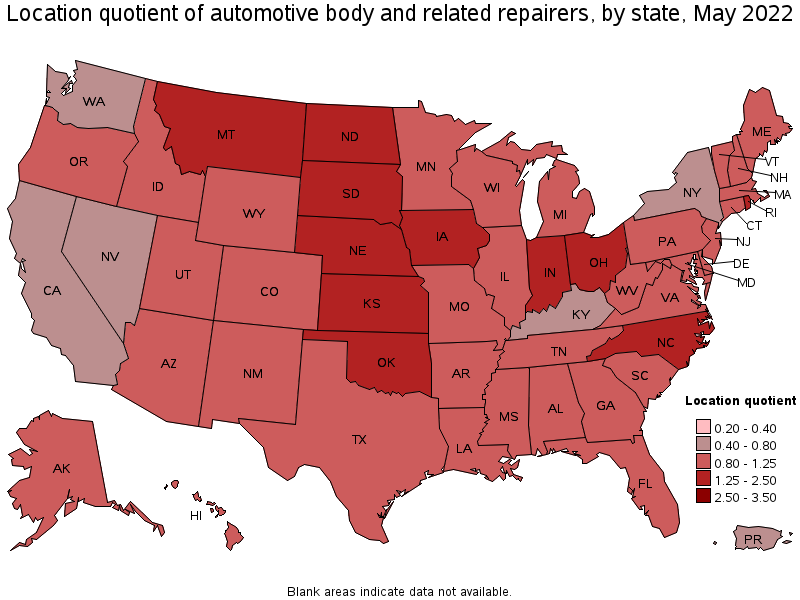
States with the highest concentration of jobs and location quotients in Automotive Body and Related Repairers:
| State | Employment (1) | Employment per thousand jobs | Location quotient (9) | Hourly mean wage | Annual mean wage (2) |
|---|---|---|---|---|---|
| South Dakota | 760 | 1.75 | 1.86 | $ 25.32 | $ 52,660 |
| Rhode Island | 790 | 1.64 | 1.75 | $ 26.84 | $ 55,840 |
| North Dakota | 600 | 1.49 | 1.59 | $ 26.28 | $ 54,660 |
| Indiana | 4,360 | 1.41 | 1.50 | $ 26.41 | $ 54,940 |
| Iowa | 1,990 | 1.31 | 1.39 | $ 24.79 | $ 51,550 |
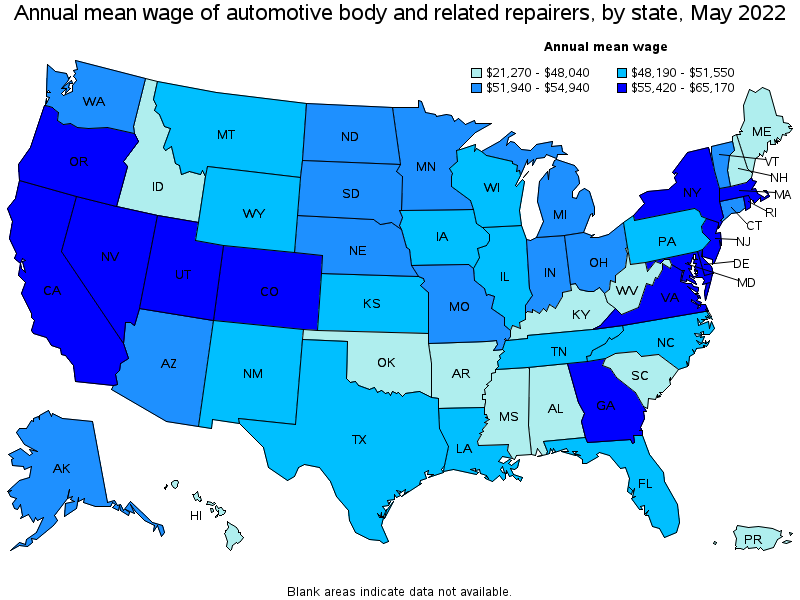
Top paying states for Automotive Body and Related Repairers:
| State | Employment (1) | Employment per thousand jobs | Location quotient (9) | Hourly mean wage | Annual mean wage (2) |
|---|---|---|---|---|---|
| Colorado | 2,770 | 1.00 | 1.07 | $ 31.33 | $ 65,170 |
| Georgia | 4,390 | 0.95 | 1.01 | $ 29.16 | $ 60,650 |
| California | 13,060 | 0.74 | 0.79 | $ 28.88 | $ 60,070 |
| Massachusetts | 2,740 | 0.77 | 0.82 | $ 28.02 | $ 58,280 |
| Maryland | 2,240 | 0.85 | 0.90 | $ 27.92 | $ 58,080 |
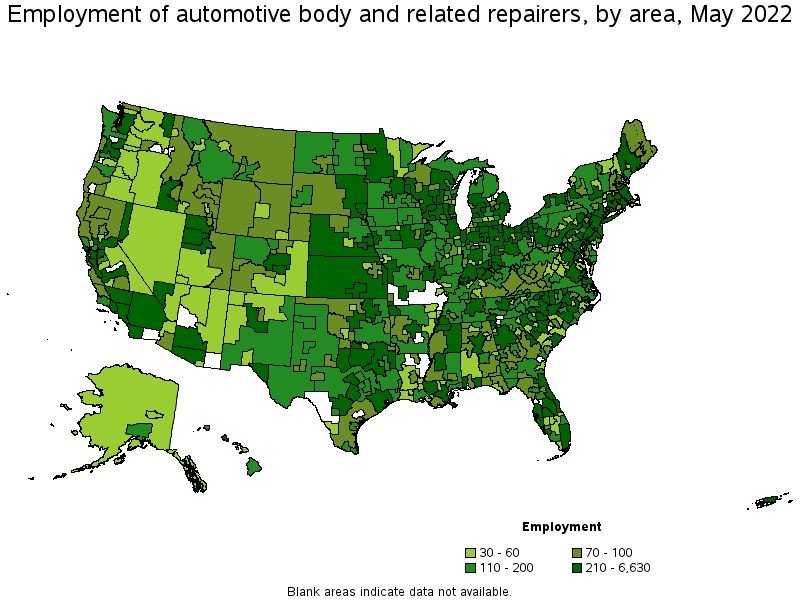
Metropolitan areas with the highest employment level in Automotive Body and Related Repairers:
| Metropolitan area | Employment (1) | Employment per thousand jobs | Location quotient (9) | Hourly mean wage | Annual mean wage (2) |
|---|---|---|---|---|---|
| New York-Newark-Jersey City, NY-NJ-PA | 6,630 | 0.72 | 0.77 | $ 27.48 | $ 57,170 |
| Los Angeles-Long Beach-Anaheim, CA | 5,060 | 0.83 | 0.88 | $ 27.42 | $ 57,030 |
| Chicago-Naperville-Elgin, IL-IN-WI | 4,250 | 0.96 | 1.03 | $ 25.78 | $ 53,620 |
| Dallas-Fort Worth-Arlington, TX | 3,650 | 0.96 | 1.02 | $ 26.79 | $ 55,720 |
| Houston-The Woodlands-Sugar Land, TX | 2,850 | 0.93 | 0.99 | $ 24.37 | $ 50,690 |
| Philadelphia-Camden-Wilmington, PA-NJ-DE-MD | 2,790 | 1.01 | 1.07 | $ 26.50 | $ 55,120 |
| Atlanta-Sandy Springs-Roswell, GA | 2,600 | 0.95 | 1.02 | $ 31.59 | $ 65,710 |
| Detroit-Warren-Dearborn, MI | 2,210 | 1.18 | 1.26 | $ 26.77 | $ 55,690 |
| Washington-Arlington-Alexandria, DC-VA-MD-WV | 2,190 | 0.72 | 0.77 | $ 29.81 | $ 62,010 |
| Miami-Fort Lauderdale-West Palm Beach, FL | 2,090 | 0.80 | 0.85 | $ 26.82 | $ 55,790 |
Metropolitan areas with the highest concentration of jobs and location quotients in Automotive Body and Related Repairers:
| Metropolitan area | Employment (1) | Employment per thousand jobs | Location quotient (9) | Hourly mean wage | Annual mean wage (2) |
|---|---|---|---|---|---|
| Elkhart-Goshen, IN | 370 | 2.61 | 2.78 | $ 28.01 | $ 58,250 |
| Parkersburg-Vienna, WV | 80 | 2.16 | 2.30 | $ 18.67 | $ 38,840 |
| Rapid City, SD | 150 | 2.12 | 2.26 | $ 24.82 | $ 51,620 |
| Waterbury, CT | 130 | 1.99 | 2.13 | $ 25.09 | $ 52,190 |
| Chambersburg-Waynesboro, PA | 110 | 1.96 | 2.09 | $ 25.83 | $ 53,730 |
| Fond du Lac, WI | 90 | 1.94 | 2.06 | $ 19.27 | $ 40,080 |
| San Angelo, TX | 90 | 1.81 | 1.93 | $ 22.36 | $ 46,510 |
| Killeen-Temple, TX | 250 | 1.77 | 1.89 | $ 22.73 | $ 47,280 |
| Sioux City, IA-NE-SD | 150 | 1.76 | 1.87 | $ 25.43 | $ 52,900 |
| Altoona, PA | 100 | 1.69 | 1.80 | $ 21.73 | $ 45,190 |
Top paying metropolitan areas for Automotive Body and Related Repairers:
| Metropolitan area | Employment (1) | Employment per thousand jobs | Location quotient (9) | Hourly mean wage | Annual mean wage (2) |
|---|---|---|---|---|---|
| Ann Arbor, MI | 120 | 0.57 | 0.60 | $ 36.34 | $ 75,590 |
| San Jose-Sunnyvale-Santa Clara, CA | 500 | 0.44 | 0.47 | $ 34.21 | $ 71,150 |
| Denver-Aurora-Lakewood, CO | 1,620 | 1.04 | 1.11 | $ 33.55 | $ 69,790 |
| Vineland-Bridgeton, NJ | 60 | 0.96 | 1.02 | $ 32.69 | $ 68,000 |
| San Francisco-Oakland-Hayward, CA | 1,690 | 0.71 | 0.75 | $ 32.04 | $ 66,630 |
| Atlanta-Sandy Springs-Roswell, GA | 2,600 | 0.95 | 1.02 | $ 31.59 | $ 65,710 |
| Sacramento--Roseville--Arden-Arcade, CA | 810 | 0.79 | 0.84 | $ 30.76 | $ 63,970 |
| Salinas, CA | 90 | 0.50 | 0.54 | $ 30.62 | $ 63,690 |
| Boulder, CO | 100 | 0.51 | 0.55 | $ 30.61 | $ 63,660 |
| Santa Rosa, CA | 190 | 0.94 | 1.00 | $ 30.05 | $ 62,510 |
Nonmetropolitan areas with the highest employment in Automotive Body and Related Repairers:
| Nonmetropolitan area | Employment (1) | Employment per thousand jobs | Location quotient (9) | Hourly mean wage | Annual mean wage (2) |
|---|---|---|---|---|---|
| Kansas nonmetropolitan area | 570 | 1.49 | 1.58 | $ 22.02 | $ 45,790 |
| Balance of Lower Peninsula of Michigan nonmetropolitan area | 470 | 1.80 | 1.91 | $ 21.26 | $ 44,210 |
| North Northeastern Ohio nonmetropolitan area (noncontiguous) | 340 | 1.06 | 1.13 | $ 28.36 | $ 58,980 |
| West Northwestern Ohio nonmetropolitan area | 340 | 1.36 | 1.45 | $ 24.37 | $ 50,680 |
| North Texas Region of Texas nonmetropolitan area | 290 | 1.07 | 1.14 | $ 22.40 | $ 46,590 |
Nonmetropolitan areas with the highest concentration of jobs and location quotients in Automotive Body and Related Repairers:
| Nonmetropolitan area | Employment (1) | Employment per thousand jobs | Location quotient (9) | Hourly mean wage | Annual mean wage (2) |
|---|---|---|---|---|---|
| East North Dakota nonmetropolitan area | 130 | 2.09 | 2.23 | $ 24.31 | $ 50,560 |
| Northeast Lower Peninsula of Michigan nonmetropolitan area | 150 | 2.02 | 2.15 | $ 22.42 | $ 46,630 |
| Northeast Nebraska nonmetropolitan area | 170 | 1.88 | 2.01 | $ 24.77 | $ 51,530 |
| South Illinois nonmetropolitan area | 160 | 1.81 | 1.93 | $ 20.13 | $ 41,880 |
| Balance of Lower Peninsula of Michigan nonmetropolitan area | 470 | 1.80 | 1.91 | $ 21.26 | $ 44,210 |
Top paying nonmetropolitan areas for Automotive Body and Related Repairers:
| Nonmetropolitan area | Employment (1) | Employment per thousand jobs | Location quotient (9) | Hourly mean wage | Annual mean wage (2) |
|---|---|---|---|---|---|
| Northwest Colorado nonmetropolitan area | 150 | 1.22 | 1.31 | $ 31.62 | $ 65,780 |
| Eastern Sierra-Mother Lode Region of California nonmetropolitan area | 30 | 0.54 | 0.58 | $ 29.09 | $ 60,500 |
| North Northeastern Ohio nonmetropolitan area (noncontiguous) | 340 | 1.06 | 1.13 | $ 28.36 | $ 58,980 |
| North Valley-Northern Mountains Region of California nonmetropolitan area | 70 | 0.70 | 0.74 | $ 27.67 | $ 57,560 |
| Northeast Virginia nonmetropolitan area | 40 | 0.91 | 0.97 | $ 27.47 | $ 57,140 |
These estimates are calculated with data collected from employers in all industry sectors, all metropolitan and nonmetropolitan areas, and all states and the District of Columbia. The top employment and wage figures are provided above. The complete list is available in the downloadable XLS files.
The percentile wage estimate is the value of a wage below which a certain percent of workers fall. The median wage is the 50th percentile wage estimate—50 percent of workers earn less than the median and 50 percent of workers earn more than the median. More about percentile wages.
(1) Estimates for detailed occupations do not sum to the totals because the totals include occupations not shown separately. Estimates do not include self-employed workers.
(2) Annual wages have been calculated by multiplying the hourly mean wage by a "year-round, full-time" hours figure of 2,080 hours; for those occupations where there is not an hourly wage published, the annual wage has been directly calculated from the reported survey data.
(3) The relative standard error (RSE) is a measure of the reliability of a survey statistic. The smaller the relative standard error, the more precise the estimate.
(7) The value is less than .005 percent of industry employment.
(9) The location quotient is the ratio of the area concentration of occupational employment to the national average concentration. A location quotient greater than one indicates the occupation has a higher share of employment than average, and a location quotient less than one indicates the occupation is less prevalent in the area than average.
Other OEWS estimates and related information:
May 2022 National Occupational Employment and Wage Estimates
May 2022 State Occupational Employment and Wage Estimates
May 2022 Metropolitan and Nonmetropolitan Area Occupational Employment and Wage Estimates
May 2022 National Industry-Specific Occupational Employment and Wage Estimates
Last Modified Date: April 25, 2023