
An official website of the United States government
An official website of the United States government
The .gov means it's official.
Federal government websites often end in .gov or .mil. Before sharing sensitive information,
make sure you're on a federal government site.
The site is secure.
The
https:// ensures that you are connecting to the official website and that any
information you provide is encrypted and transmitted securely.
Diagnose, adjust, repair, or overhaul mobile mechanical, hydraulic, and pneumatic equipment, such as cranes, bulldozers, graders, and conveyors, used in construction, logging, and mining. Excludes �Bus and Truck Mechanics and Diesel Engine Specialists� (49-3031) and �Rail Car Repairers� (49-3043).
Employment estimate and mean wage estimates for Mobile Heavy Equipment Mechanics, Except Engines:
| Employment (1) | Employment RSE (3) |
Mean hourly wage |
Mean annual wage (2) |
Wage RSE (3) |
|---|---|---|---|---|
| 158,350 | 1.2 % | $ 28.64 | $ 59,560 | 0.3 % |
Percentile wage estimates for Mobile Heavy Equipment Mechanics, Except Engines:
| Percentile | 10% | 25% | 50% (Median) |
75% | 90% |
|---|---|---|---|---|---|
| Hourly Wage | $ 18.73 | $ 23.00 | $ 28.58 | $ 33.04 | $ 38.50 |
| Annual Wage (2) | $ 38,950 | $ 47,840 | $ 59,440 | $ 68,720 | $ 80,080 |
Industries with the highest published employment and wages for Mobile Heavy Equipment Mechanics, Except Engines are provided. For a list of all industries with employment in Mobile Heavy Equipment Mechanics, Except Engines, see the Create Customized Tables function.
Industries with the highest levels of employment in Mobile Heavy Equipment Mechanics, Except Engines:
| Industry | Employment (1) | Percent of industry employment | Hourly mean wage | Annual mean wage (2) |
|---|---|---|---|---|
| Machinery, Equipment, and Supplies Merchant Wholesalers | 42,030 | 5.94 | $ 29.69 | $ 61,740 |
| Rental and leasing services (5322, 5323, and 5324 only) | 16,380 | 5.03 | $ 26.83 | $ 55,800 |
| Other Specialty Trade Contractors | 13,860 | 1.83 | $ 28.60 | $ 59,490 |
| Commercial and Industrial Machinery and Equipment (except Automotive and Electronic) Repair and Maintenance | 9,530 | 4.32 | $ 27.27 | $ 56,730 |
| Highway, Street, and Bridge Construction | 8,490 | 2.36 | $ 28.61 | $ 59,500 |
Industries with the highest concentration of employment in Mobile Heavy Equipment Mechanics, Except Engines:
| Industry | Employment (1) | Percent of industry employment | Hourly mean wage | Annual mean wage (2) |
|---|---|---|---|---|
| Metal Ore Mining | 3,280 | 7.77 | $ 31.52 | $ 65,570 |
| Machinery, Equipment, and Supplies Merchant Wholesalers | 42,030 | 5.94 | $ 29.69 | $ 61,740 |
| Rental and leasing services (5322, 5323, and 5324 only) | 16,380 | 5.03 | $ 26.83 | $ 55,800 |
| Coal Mining | 1,880 | 4.82 | $ 32.01 | $ 66,570 |
| Commercial and Industrial Machinery and Equipment (except Automotive and Electronic) Repair and Maintenance | 9,530 | 4.32 | $ 27.27 | $ 56,730 |
Top paying industries for Mobile Heavy Equipment Mechanics, Except Engines:
| Industry | Employment (1) | Percent of industry employment | Hourly mean wage | Annual mean wage (2) |
|---|---|---|---|---|
| Electric Power Generation, Transmission and Distribution | 740 | 0.20 | $ 41.97 | $ 87,300 |
| Scientific Research and Development Services | 30 | (7) | $ 39.28 | $ 81,710 |
| Natural Gas Distribution | 60 | 0.05 | $ 38.99 | $ 81,090 |
| Iron and Steel Mills and Ferroalloy Manufacturing | 130 | 0.16 | $ 38.46 | $ 80,000 |
| Building Finishing Contractors | 240 | 0.03 | $ 37.95 | $ 78,930 |
States and areas with the highest published employment, location quotients, and wages for Mobile Heavy Equipment Mechanics, Except Engines are provided. For a list of all areas with employment in Mobile Heavy Equipment Mechanics, Except Engines, see the Create Customized Tables function.
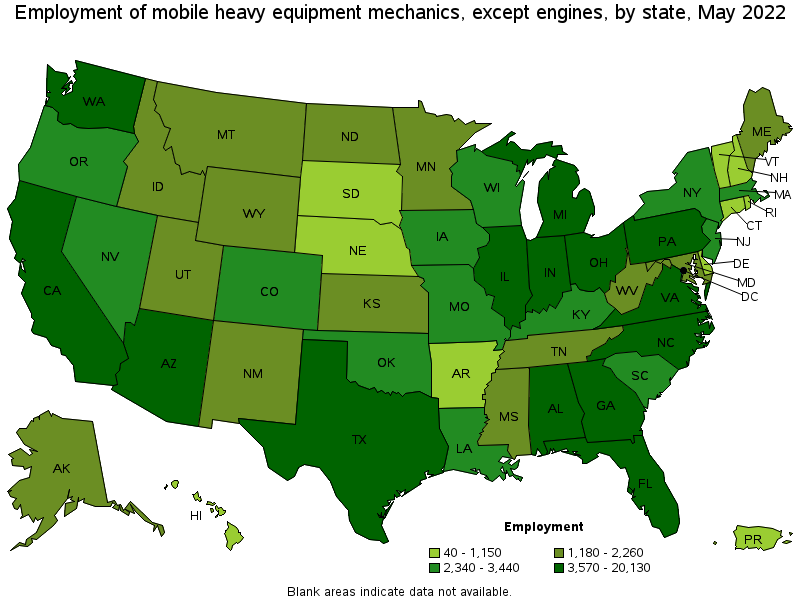
States with the highest employment level in Mobile Heavy Equipment Mechanics, Except Engines:
| State | Employment (1) | Employment per thousand jobs | Location quotient (9) | Hourly mean wage | Annual mean wage (2) |
|---|---|---|---|---|---|
| Texas | 20,130 | 1.55 | 1.45 | $ 27.30 | $ 56,780 |
| California | 13,300 | 0.75 | 0.70 | $ 32.75 | $ 68,120 |
| Arizona | 7,690 | 2.54 | 2.37 | $ 28.12 | $ 58,500 |
| Pennsylvania | 7,480 | 1.29 | 1.20 | $ 27.55 | $ 57,300 |
| Florida | 7,080 | 0.77 | 0.72 | $ 27.11 | $ 56,390 |
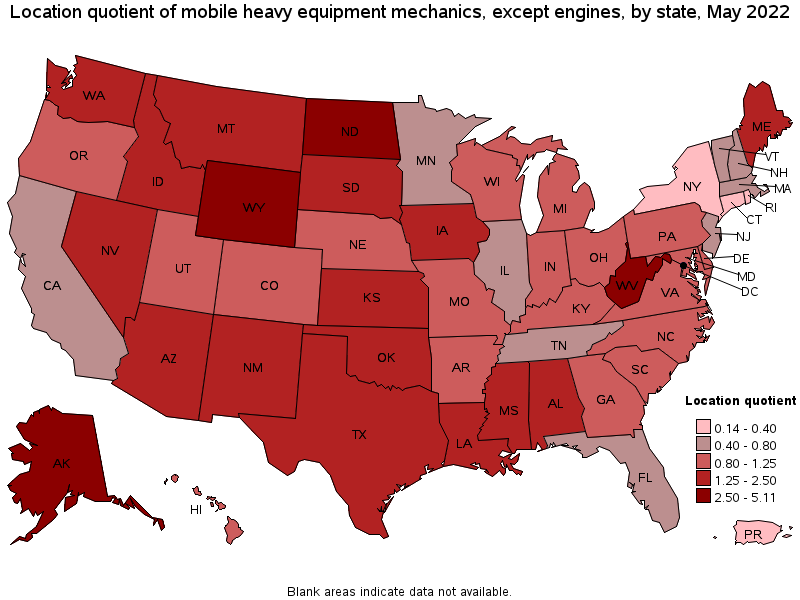
States with the highest concentration of jobs and location quotients in Mobile Heavy Equipment Mechanics, Except Engines:
| State | Employment (1) | Employment per thousand jobs | Location quotient (9) | Hourly mean wage | Annual mean wage (2) |
|---|---|---|---|---|---|
| Wyoming | 1,470 | 5.47 | 5.11 | $ 31.46 | $ 65,440 |
| North Dakota | 1,690 | 4.17 | 3.89 | $ 32.23 | $ 67,030 |
| Alaska | 1,180 | 3.87 | 3.61 | $ 37.02 | $ 77,000 |
| West Virginia | 1,890 | 2.78 | 2.60 | $ 24.06 | $ 50,050 |
| Montana | 1,280 | 2.61 | 2.43 | $ 29.76 | $ 61,900 |
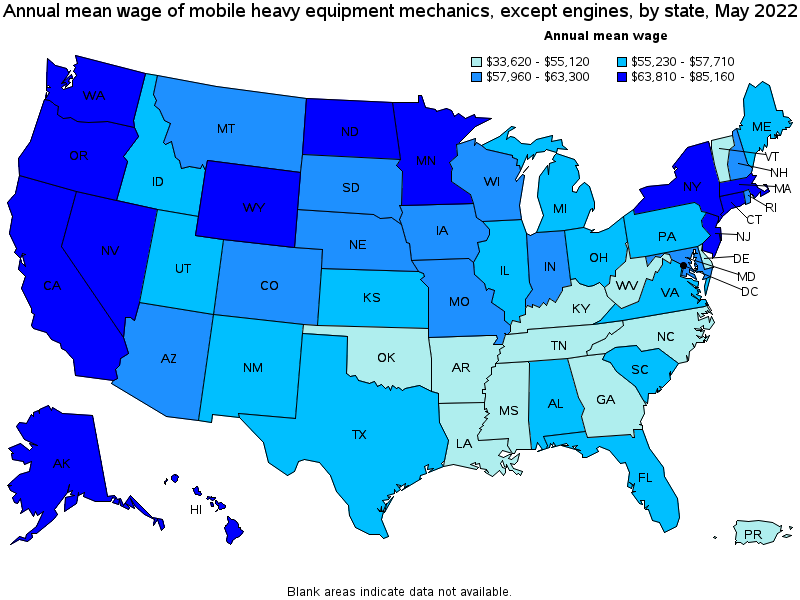
Top paying states for Mobile Heavy Equipment Mechanics, Except Engines:
| State | Employment (1) | Employment per thousand jobs | Location quotient (9) | Hourly mean wage | Annual mean wage (2) |
|---|---|---|---|---|---|
| Hawaii | 570 | 0.96 | 0.89 | $ 40.94 | $ 85,160 |
| Alaska | 1,180 | 3.87 | 3.61 | $ 37.02 | $ 77,000 |
| Massachusetts | 2,610 | 0.73 | 0.68 | $ 34.80 | $ 72,390 |
| New Jersey | 2,340 | 0.57 | 0.53 | $ 34.54 | $ 71,840 |
| Connecticut | 630 | 0.39 | 0.36 | $ 33.35 | $ 69,360 |
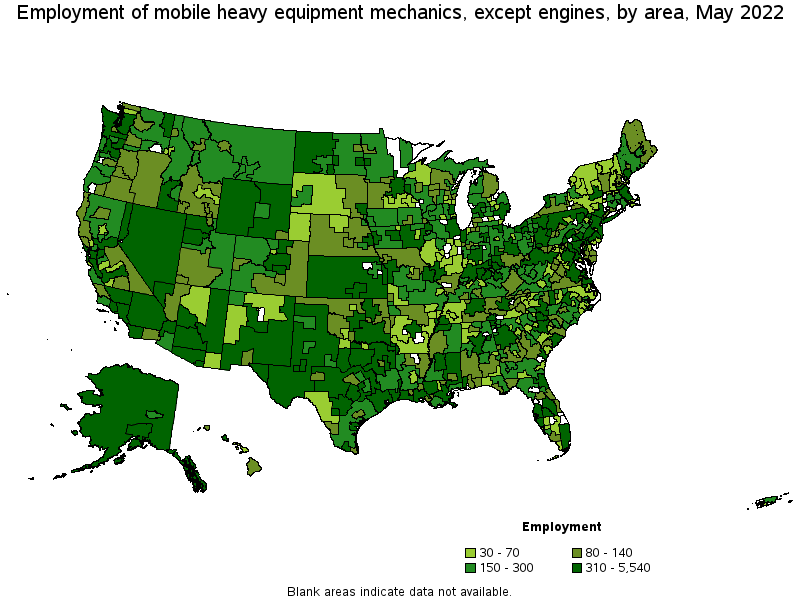
Metropolitan areas with the highest employment level in Mobile Heavy Equipment Mechanics, Except Engines:
| Metropolitan area | Employment (1) | Employment per thousand jobs | Location quotient (9) | Hourly mean wage | Annual mean wage (2) |
|---|---|---|---|---|---|
| Houston-The Woodlands-Sugar Land, TX | 5,540 | 1.82 | 1.70 | $ 28.53 | $ 59,340 |
| Phoenix-Mesa-Scottsdale, AZ | 5,020 | 2.26 | 2.11 | $ 27.73 | $ 57,670 |
| Dallas-Fort Worth-Arlington, TX | 4,480 | 1.18 | 1.10 | $ 28.91 | $ 60,130 |
| Los Angeles-Long Beach-Anaheim, CA | 3,490 | 0.57 | 0.53 | $ 31.99 | $ 66,540 |
| New York-Newark-Jersey City, NY-NJ-PA | 2,860 | 0.31 | 0.29 | $ 36.63 | $ 76,190 |
| Chicago-Naperville-Elgin, IL-IN-WI | 2,610 | 0.59 | 0.55 | $ 28.06 | $ 58,360 |
| Seattle-Tacoma-Bellevue, WA | 2,370 | 1.16 | 1.08 | $ 34.92 | $ 72,630 |
| Boston-Cambridge-Nashua, MA-NH | 2,090 | 0.77 | 0.72 | $ 35.45 | $ 73,740 |
| Riverside-San Bernardino-Ontario, CA | 2,030 | 1.24 | 1.16 | $ 31.60 | $ 65,730 |
| Atlanta-Sandy Springs-Roswell, GA | 2,020 | 0.74 | 0.69 | $ 27.07 | $ 56,300 |
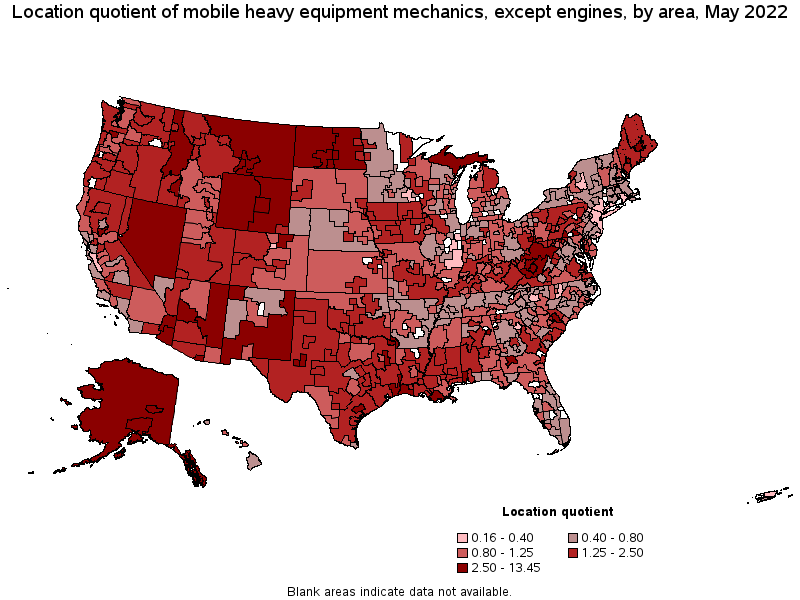
Metropolitan areas with the highest concentration of jobs and location quotients in Mobile Heavy Equipment Mechanics, Except Engines:
| Metropolitan area | Employment (1) | Employment per thousand jobs | Location quotient (9) | Hourly mean wage | Annual mean wage (2) |
|---|---|---|---|---|---|
| Anniston-Oxford-Jacksonville, AL | 570 | 13.16 | 12.29 | $ 26.05 | $ 54,180 |
| Texarkana, TX-AR | 440 | 7.81 | 7.29 | $ 27.39 | $ 56,980 |
| Odessa, TX | 540 | 7.42 | 6.93 | $ 29.55 | $ 61,450 |
| Chambersburg-Waynesboro, PA | 400 | 6.90 | 6.45 | $ 28.76 | $ 59,830 |
| Fairbanks, AK | 230 | 6.69 | 6.24 | $ 40.07 | $ 83,350 |
| York-Hanover, PA | 1,090 | 6.11 | 5.71 | $ 27.94 | $ 58,110 |
| Casper, WY | 200 | 5.40 | 5.05 | $ 30.13 | $ 62,680 |
| Prescott, AZ | 340 | 5.03 | 4.70 | $ 29.31 | $ 60,970 |
| Longview, TX | 440 | 4.73 | 4.42 | $ 25.72 | $ 53,500 |
| Midland, TX | 470 | 4.51 | 4.21 | $ 28.01 | $ 58,270 |
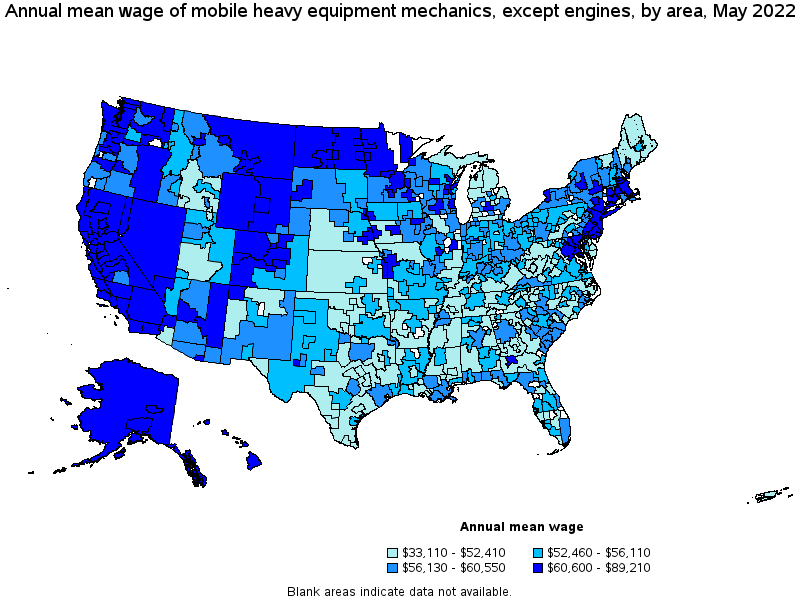
Top paying metropolitan areas for Mobile Heavy Equipment Mechanics, Except Engines:
| Metropolitan area | Employment (1) | Employment per thousand jobs | Location quotient (9) | Hourly mean wage | Annual mean wage (2) |
|---|---|---|---|---|---|
| Kahului-Wailuku-Lahaina, HI | 60 | 0.87 | 0.81 | $ 42.89 | $ 89,210 |
| Urban Honolulu, HI | 430 | 1.01 | 0.94 | $ 41.91 | $ 87,170 |
| Fairbanks, AK | 230 | 6.69 | 6.24 | $ 40.07 | $ 83,350 |
| San Luis Obispo-Paso Robles-Arroyo Grande, CA | 120 | 1.03 | 0.97 | $ 39.69 | $ 82,550 |
| San Francisco-Oakland-Hayward, CA | 1,660 | 0.69 | 0.65 | $ 37.67 | $ 78,350 |
| New York-Newark-Jersey City, NY-NJ-PA | 2,860 | 0.31 | 0.29 | $ 36.63 | $ 76,190 |
| San Jose-Sunnyvale-Santa Clara, CA | 410 | 0.36 | 0.34 | $ 36.39 | $ 75,680 |
| Anchorage, AK | 450 | 2.72 | 2.54 | $ 36.19 | $ 75,260 |
| Boston-Cambridge-Nashua, MA-NH | 2,090 | 0.77 | 0.72 | $ 35.45 | $ 73,740 |
| Bridgeport-Stamford-Norwalk, CT | 90 | 0.23 | 0.22 | $ 35.36 | $ 73,540 |
Nonmetropolitan areas with the highest employment in Mobile Heavy Equipment Mechanics, Except Engines:
| Nonmetropolitan area | Employment (1) | Employment per thousand jobs | Location quotient (9) | Hourly mean wage | Annual mean wage (2) |
|---|---|---|---|---|---|
| Nevada nonmetropolitan area | 1,430 | 14.40 | 13.45 | $ 33.12 | $ 68,900 |
| Arizona nonmetropolitan area | 1,140 | 12.44 | 11.62 | $ 29.83 | $ 62,040 |
| West North Dakota nonmetropolitan area | 810 | 7.33 | 6.84 | $ 33.06 | $ 68,770 |
| Eastern Wyoming nonmetropolitan area | 630 | 7.61 | 7.11 | $ 34.36 | $ 71,460 |
| Western Wyoming nonmetropolitan area | 530 | 5.49 | 5.13 | $ 29.43 | $ 61,210 |
Nonmetropolitan areas with the highest concentration of jobs and location quotients in Mobile Heavy Equipment Mechanics, Except Engines:
| Nonmetropolitan area | Employment (1) | Employment per thousand jobs | Location quotient (9) | Hourly mean wage | Annual mean wage (2) |
|---|---|---|---|---|---|
| Nevada nonmetropolitan area | 1,430 | 14.40 | 13.45 | $ 33.12 | $ 68,900 |
| Arizona nonmetropolitan area | 1,140 | 12.44 | 11.62 | $ 29.83 | $ 62,040 |
| Eastern Wyoming nonmetropolitan area | 630 | 7.61 | 7.11 | $ 34.36 | $ 71,460 |
| West North Dakota nonmetropolitan area | 810 | 7.33 | 6.84 | $ 33.06 | $ 68,770 |
| Western Wyoming nonmetropolitan area | 530 | 5.49 | 5.13 | $ 29.43 | $ 61,210 |
Top paying nonmetropolitan areas for Mobile Heavy Equipment Mechanics, Except Engines:
| Nonmetropolitan area | Employment (1) | Employment per thousand jobs | Location quotient (9) | Hourly mean wage | Annual mean wage (2) |
|---|---|---|---|---|---|
| Alaska nonmetropolitan area | 500 | 4.89 | 4.56 | $ 36.36 | $ 75,630 |
| Eastern Wyoming nonmetropolitan area | 630 | 7.61 | 7.11 | $ 34.36 | $ 71,460 |
| Hawaii / Kauai nonmetropolitan area | 80 | 0.78 | 0.73 | $ 34.19 | $ 71,120 |
| Nevada nonmetropolitan area | 1,430 | 14.40 | 13.45 | $ 33.12 | $ 68,900 |
| West North Dakota nonmetropolitan area | 810 | 7.33 | 6.84 | $ 33.06 | $ 68,770 |
These estimates are calculated with data collected from employers in all industry sectors, all metropolitan and nonmetropolitan areas, and all states and the District of Columbia. The top employment and wage figures are provided above. The complete list is available in the downloadable XLS files.
The percentile wage estimate is the value of a wage below which a certain percent of workers fall. The median wage is the 50th percentile wage estimate—50 percent of workers earn less than the median and 50 percent of workers earn more than the median. More about percentile wages.
(1) Estimates for detailed occupations do not sum to the totals because the totals include occupations not shown separately. Estimates do not include self-employed workers.
(2) Annual wages have been calculated by multiplying the hourly mean wage by a "year-round, full-time" hours figure of 2,080 hours; for those occupations where there is not an hourly wage published, the annual wage has been directly calculated from the reported survey data.
(3) The relative standard error (RSE) is a measure of the reliability of a survey statistic. The smaller the relative standard error, the more precise the estimate.
(7) The value is less than .005 percent of industry employment.
(9) The location quotient is the ratio of the area concentration of occupational employment to the national average concentration. A location quotient greater than one indicates the occupation has a higher share of employment than average, and a location quotient less than one indicates the occupation is less prevalent in the area than average.
Other OEWS estimates and related information:
May 2022 National Occupational Employment and Wage Estimates
May 2022 State Occupational Employment and Wage Estimates
May 2022 Metropolitan and Nonmetropolitan Area Occupational Employment and Wage Estimates
May 2022 National Industry-Specific Occupational Employment and Wage Estimates
Last Modified Date: April 25, 2023