
An official website of the United States government
An official website of the United States government
The .gov means it's official.
Federal government websites often end in .gov or .mil. Before sharing sensitive information,
make sure you're on a federal government site.
The site is secure.
The
https:// ensures that you are connecting to the official website and that any
information you provide is encrypted and transmitted securely.
All production workers not listed separately. Excludes �Packers and Packagers, Hand� (53-7064).
Employment estimate and mean wage estimates for Production Workers, All Other:
| Employment (1) | Employment RSE (3) |
Mean hourly wage |
Mean annual wage (2) |
Wage RSE (3) |
|---|---|---|---|---|
| 252,660 | 1.2 % | $ 18.68 | $ 38,860 | 0.3 % |
Percentile wage estimates for Production Workers, All Other:
| Percentile | 10% | 25% | 50% (Median) |
75% | 90% |
|---|---|---|---|---|---|
| Hourly Wage | $ 13.23 | $ 14.68 | $ 17.06 | $ 21.00 | $ 27.01 |
| Annual Wage (2) | $ 27,510 | $ 30,530 | $ 35,490 | $ 43,690 | $ 56,180 |
Industries with the highest published employment and wages for Production Workers, All Other are provided. For a list of all industries with employment in Production Workers, All Other, see the Create Customized Tables function.
Industries with the highest levels of employment in Production Workers, All Other:
| Industry | Employment (1) | Percent of industry employment | Hourly mean wage | Annual mean wage (2) |
|---|---|---|---|---|
| Employment Services | 99,840 | 2.54 | $ 16.61 | $ 34,550 |
| Plastics Product Manufacturing | 7,290 | 1.19 | $ 18.35 | $ 38,180 |
| Nonmetallic Mineral Product Manufacturing | 6,800 | 1.65 | $ 19.15 | $ 39,830 |
| Merchant Wholesalers, Durable Goods (4232, 4233, 4235, 4236, 4237, and 4239 only) | 6,520 | 0.45 | $ 19.61 | $ 40,800 |
| Other Miscellaneous Manufacturing | 6,080 | 2.07 | $ 17.46 | $ 36,310 |
Industries with the highest concentration of employment in Production Workers, All Other:
| Industry | Employment (1) | Percent of industry employment | Hourly mean wage | Annual mean wage (2) |
|---|---|---|---|---|
| Other Transportation Equipment Manufacturing | 1,220 | 3.04 | $ 19.45 | $ 40,450 |
| Other Furniture Related Product Manufacturing | 1,040 | 2.88 | $ 17.04 | $ 35,450 |
| Leather and Hide Tanning and Finishing | 90 | 2.59 | $ 13.97 | $ 29,060 |
| Employment Services | 99,840 | 2.54 | $ 16.61 | $ 34,550 |
| Rubber Product Manufacturing | 3,150 | 2.37 | $ 18.17 | $ 37,790 |
Top paying industries for Production Workers, All Other:
| Industry | Employment (1) | Percent of industry employment | Hourly mean wage | Annual mean wage (2) |
|---|---|---|---|---|
| Natural Gas Distribution | 1,000 | 0.92 | $ 42.31 | $ 88,010 |
| Support Activities for Mining | 450 | 0.18 | $ 33.26 | $ 69,180 |
| Accounting, Tax Preparation, Bookkeeping, and Payroll Services | 510 | 0.05 | $ 31.09 | $ 64,680 |
| Scientific Research and Development Services | 1,260 | 0.15 | $ 31.00 | $ 64,480 |
| Federal Executive Branch (OEWS Designation) | 320 | 0.02 | $ 30.88 | $ 64,230 |
States and areas with the highest published employment, location quotients, and wages for Production Workers, All Other are provided. For a list of all areas with employment in Production Workers, All Other, see the Create Customized Tables function.
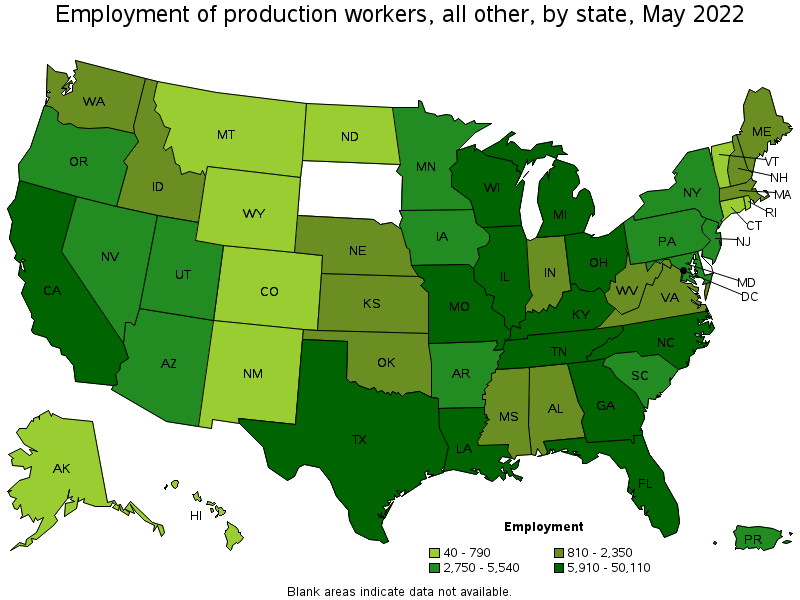
States with the highest employment level in Production Workers, All Other:
| State | Employment (1) | Employment per thousand jobs | Location quotient (9) | Hourly mean wage | Annual mean wage (2) |
|---|---|---|---|---|---|
| California | 50,110 | 2.84 | 1.66 | $ 20.34 | $ 42,310 |
| Georgia | 25,580 | 5.55 | 3.25 | $ 18.19 | $ 37,840 |
| Tennessee | 18,450 | 5.91 | 3.46 | $ 17.02 | $ 35,400 |
| Illinois | 10,930 | 1.86 | 1.09 | $ 20.10 | $ 41,800 |
| Kentucky | 10,890 | 5.73 | 3.36 | $ 17.57 | $ 36,540 |
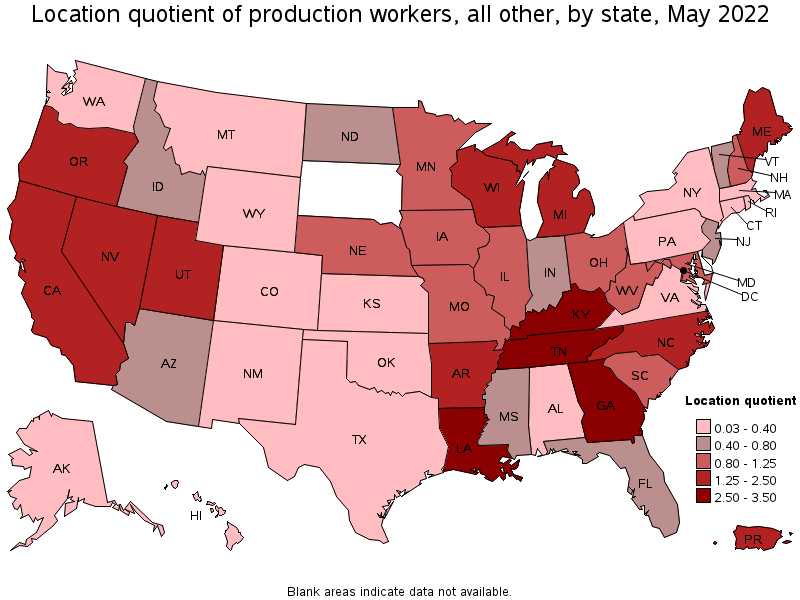
States with the highest concentration of jobs and location quotients in Production Workers, All Other:
| State | Employment (1) | Employment per thousand jobs | Location quotient (9) | Hourly mean wage | Annual mean wage (2) |
|---|---|---|---|---|---|
| Tennessee | 18,450 | 5.91 | 3.46 | $ 17.02 | $ 35,400 |
| Kentucky | 10,890 | 5.73 | 3.36 | $ 17.57 | $ 36,540 |
| Georgia | 25,580 | 5.55 | 3.25 | $ 18.19 | $ 37,840 |
| Louisiana | 10,060 | 5.44 | 3.18 | $ 20.45 | $ 42,530 |
| Nevada | 4,520 | 3.20 | 1.87 | $ 18.50 | $ 38,470 |
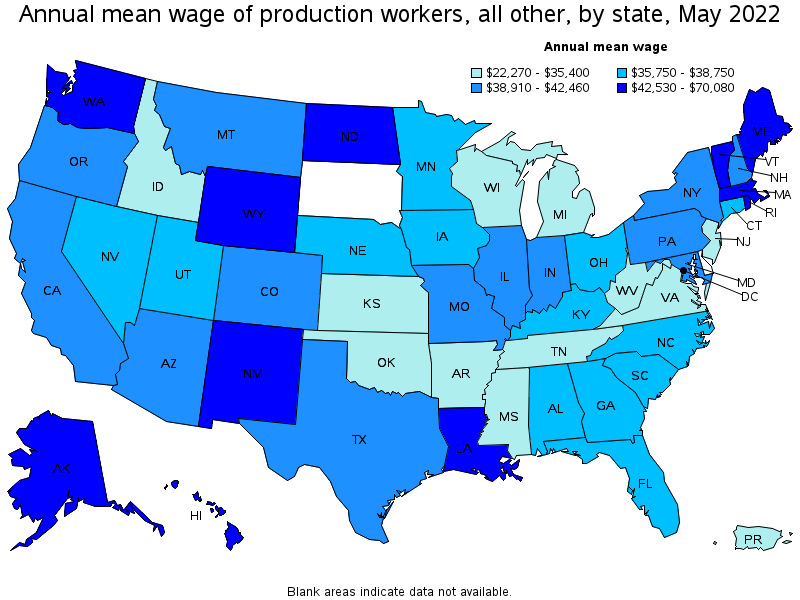
Top paying states for Production Workers, All Other:
| State | Employment (1) | Employment per thousand jobs | Location quotient (9) | Hourly mean wage | Annual mean wage (2) |
|---|---|---|---|---|---|
| District of Columbia | 40 | 0.06 | 0.03 | $ 33.69 | $ 70,080 |
| Hawaii | 70 | 0.13 | 0.07 | $ 27.54 | $ 57,290 |
| Wyoming | 130 | 0.47 | 0.28 | $ 24.90 | $ 51,790 |
| Massachusetts | 2,050 | 0.58 | 0.34 | $ 24.86 | $ 51,700 |
| Alaska | 120 | 0.38 | 0.22 | $ 24.78 | $ 51,540 |
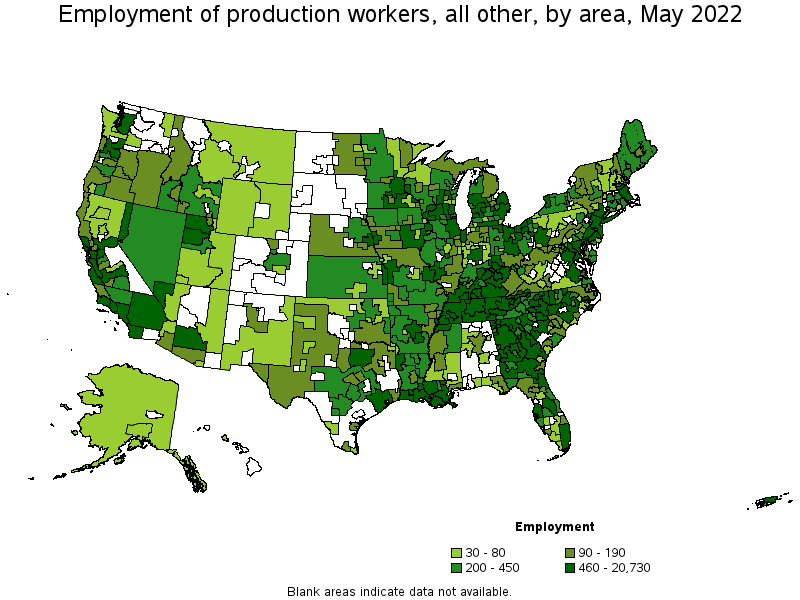
Metropolitan areas with the highest employment level in Production Workers, All Other:
| Metropolitan area | Employment (1) | Employment per thousand jobs | Location quotient (9) | Hourly mean wage | Annual mean wage (2) |
|---|---|---|---|---|---|
| Los Angeles-Long Beach-Anaheim, CA | 20,730 | 3.40 | 1.99 | $ 20.67 | $ 42,990 |
| Atlanta-Sandy Springs-Roswell, GA | 14,080 | 5.16 | 3.02 | $ 18.38 | $ 38,230 |
| Chicago-Naperville-Elgin, IL-IN-WI | 6,810 | 1.54 | 0.90 | $ 18.92 | $ 39,360 |
| New York-Newark-Jersey City, NY-NJ-PA | 6,160 | 0.67 | 0.39 | $ 18.58 | $ 38,650 |
| Riverside-San Bernardino-Ontario, CA | 5,180 | 3.17 | 1.86 | $ 18.19 | $ 37,830 |
| Nashville-Davidson--Murfreesboro--Franklin, TN | 4,190 | 4.04 | 2.37 | $ 17.44 | $ 36,270 |
| San Francisco-Oakland-Hayward, CA | 3,620 | 1.51 | 0.89 | $ 23.42 | $ 48,720 |
| Detroit-Warren-Dearborn, MI | 3,580 | 1.92 | 1.12 | $ 17.46 | $ 36,310 |
| San Diego-Carlsbad, CA | 3,380 | 2.27 | 1.33 | $ 21.01 | $ 43,700 |
| Memphis, TN-MS-AR | 3,060 | 4.92 | 2.88 | $ 16.82 | $ 34,980 |
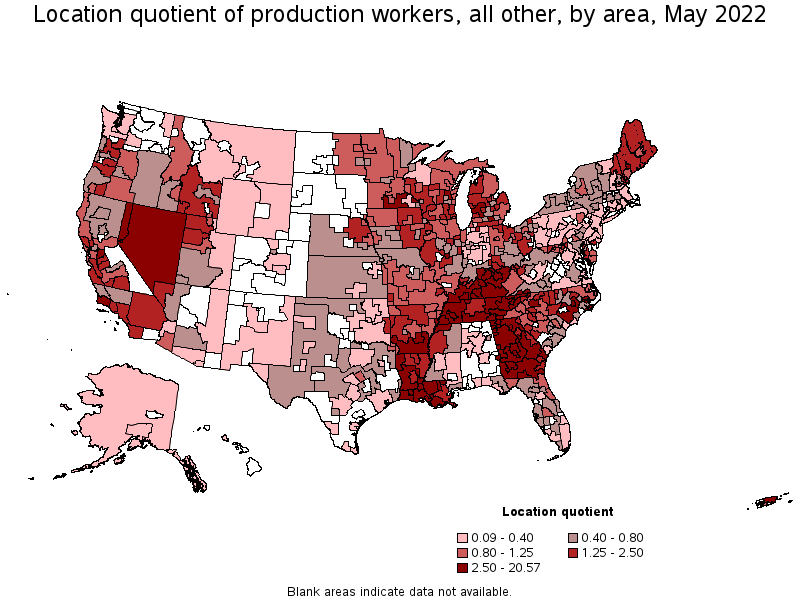
Metropolitan areas with the highest concentration of jobs and location quotients in Production Workers, All Other:
| Metropolitan area | Employment (1) | Employment per thousand jobs | Location quotient (9) | Hourly mean wage | Annual mean wage (2) |
|---|---|---|---|---|---|
| Decatur, IL | 1,600 | 35.14 | 20.57 | $ 29.00 | $ 60,320 |
| Pine Bluff, AR | 490 | 16.85 | 9.86 | $ 14.10 | $ 29,330 |
| Morristown, TN | 690 | 15.00 | 8.78 | $ 15.97 | $ 33,220 |
| Dalton, GA | 710 | 11.00 | 6.44 | $ 15.98 | $ 33,250 |
| Carson City, NV | 310 | 10.53 | 6.16 | $ 17.92 | $ 37,270 |
| Lafayette, LA | 1,960 | 10.24 | 5.99 | $ 20.10 | $ 41,800 |
| Cleveland, TN | 450 | 9.93 | 5.81 | $ 15.98 | $ 33,240 |
| Bowling Green, KY | 720 | 9.54 | 5.59 | $ 17.51 | $ 36,420 |
| Gainesville, GA | 890 | 9.44 | 5.53 | $ 19.29 | $ 40,120 |
| Houma-Thibodaux, LA | 720 | 9.22 | 5.40 | $ 23.44 | $ 48,760 |
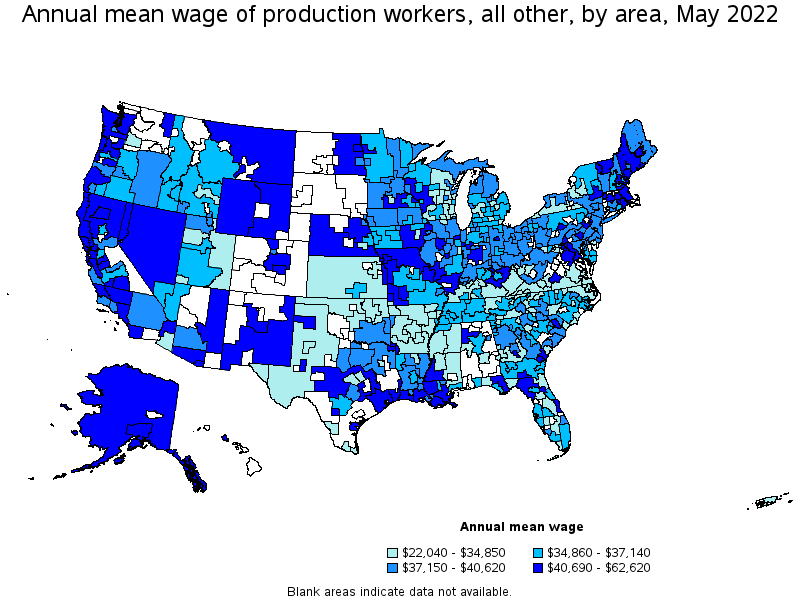
Top paying metropolitan areas for Production Workers, All Other:
| Metropolitan area | Employment (1) | Employment per thousand jobs | Location quotient (9) | Hourly mean wage | Annual mean wage (2) |
|---|---|---|---|---|---|
| Hanford-Corcoran, CA | 140 | 3.10 | 1.81 | $ 29.13 | $ 60,600 |
| Decatur, IL | 1,600 | 35.14 | 20.57 | $ 29.00 | $ 60,320 |
| Midland, TX | 50 | 0.43 | 0.25 | $ 28.47 | $ 59,210 |
| Urban Honolulu, HI | 70 | 0.16 | 0.09 | $ 26.38 | $ 54,860 |
| Bremerton-Silverdale, WA | 90 | 1.00 | 0.58 | $ 25.80 | $ 53,670 |
| Boston-Cambridge-Nashua, MA-NH | 1,530 | 0.57 | 0.33 | $ 25.52 | $ 53,090 |
| Seattle-Tacoma-Bellevue, WA | 720 | 0.35 | 0.21 | $ 25.27 | $ 52,570 |
| Albuquerque, NM | 90 | 0.24 | 0.14 | $ 25.07 | $ 52,150 |
| Palm Bay-Melbourne-Titusville, FL | 220 | 0.94 | 0.55 | $ 24.86 | $ 51,700 |
| Grand Forks, ND-MN | 70 | 1.41 | 0.82 | $ 23.81 | $ 49,530 |
Nonmetropolitan areas with the highest employment in Production Workers, All Other:
| Nonmetropolitan area | Employment (1) | Employment per thousand jobs | Location quotient (9) | Hourly mean wage | Annual mean wage (2) |
|---|---|---|---|---|---|
| North Central Tennessee nonmetropolitan area | 1,490 | 13.27 | 7.77 | $ 15.85 | $ 32,970 |
| East Tennessee nonmetropolitan area | 1,320 | 9.55 | 5.59 | $ 17.37 | $ 36,140 |
| North Georgia nonmetropolitan area | 1,300 | 7.16 | 4.19 | $ 17.30 | $ 35,990 |
| South Central Kentucky nonmetropolitan area | 1,240 | 7.53 | 4.41 | $ 16.45 | $ 34,210 |
| West Tennessee nonmetropolitan area | 1,200 | 9.27 | 5.42 | $ 17.14 | $ 35,650 |
Nonmetropolitan areas with the highest concentration of jobs and location quotients in Production Workers, All Other:
| Nonmetropolitan area | Employment (1) | Employment per thousand jobs | Location quotient (9) | Hourly mean wage | Annual mean wage (2) |
|---|---|---|---|---|---|
| North Central Tennessee nonmetropolitan area | 1,490 | 13.27 | 7.77 | $ 15.85 | $ 32,970 |
| South Central Tennessee nonmetropolitan area | 1,190 | 11.02 | 6.45 | $ 17.55 | $ 36,500 |
| East Tennessee nonmetropolitan area | 1,320 | 9.55 | 5.59 | $ 17.37 | $ 36,140 |
| West Tennessee nonmetropolitan area | 1,200 | 9.27 | 5.42 | $ 17.14 | $ 35,650 |
| Southwest Louisiana nonmetropolitan area | 520 | 7.86 | 4.60 | $ 18.78 | $ 39,060 |
Top paying nonmetropolitan areas for Production Workers, All Other:
| Nonmetropolitan area | Employment (1) | Employment per thousand jobs | Location quotient (9) | Hourly mean wage | Annual mean wage (2) |
|---|---|---|---|---|---|
| Western Wyoming nonmetropolitan area | 50 | 0.47 | 0.27 | $ 30.11 | $ 62,620 |
| Alaska nonmetropolitan area | 50 | 0.52 | 0.30 | $ 28.41 | $ 59,090 |
| Eastern New Mexico nonmetropolitan area | 30 | 0.20 | 0.12 | $ 26.49 | $ 55,110 |
| Northwest Alabama nonmetropolitan area | 40 | 0.61 | 0.36 | $ 25.30 | $ 52,620 |
| Western Washington nonmetropolitan area | 30 | 0.25 | 0.14 | $ 23.67 | $ 49,230 |
These estimates are calculated with data collected from employers in all industry sectors, all metropolitan and nonmetropolitan areas, and all states and the District of Columbia. The top employment and wage figures are provided above. The complete list is available in the downloadable XLS files.
The percentile wage estimate is the value of a wage below which a certain percent of workers fall. The median wage is the 50th percentile wage estimate—50 percent of workers earn less than the median and 50 percent of workers earn more than the median. More about percentile wages.
(1) Estimates for detailed occupations do not sum to the totals because the totals include occupations not shown separately. Estimates do not include self-employed workers.
(2) Annual wages have been calculated by multiplying the hourly mean wage by a "year-round, full-time" hours figure of 2,080 hours; for those occupations where there is not an hourly wage published, the annual wage has been directly calculated from the reported survey data.
(3) The relative standard error (RSE) is a measure of the reliability of a survey statistic. The smaller the relative standard error, the more precise the estimate.
(9) The location quotient is the ratio of the area concentration of occupational employment to the national average concentration. A location quotient greater than one indicates the occupation has a higher share of employment than average, and a location quotient less than one indicates the occupation is less prevalent in the area than average.
Other OEWS estimates and related information:
May 2022 National Occupational Employment and Wage Estimates
May 2022 State Occupational Employment and Wage Estimates
May 2022 Metropolitan and Nonmetropolitan Area Occupational Employment and Wage Estimates
May 2022 National Industry-Specific Occupational Employment and Wage Estimates
Last Modified Date: April 25, 2023