
An official website of the United States government
An official website of the United States government
The .gov means it's official.
Federal government websites often end in .gov or .mil. Before sharing sensitive information,
make sure you're on a federal government site.
The site is secure.
The
https:// ensures that you are connecting to the official website and that any
information you provide is encrypted and transmitted securely.
Advise clients on financial plans using knowledge of tax and investment strategies, securities, insurance, pension plans, and real estate. Duties include assessing clients' assets, liabilities, cash flow, insurance coverage, tax status, and financial objectives. May also buy and sell financial assets for clients. Excludes �Securities, Commodities, and Financial Services Sales Agents� (41-3031).
Employment estimate and mean wage estimates for Personal Financial Advisors:
| Employment (1) | Employment RSE (3) |
Mean hourly wage |
Mean annual wage (2) |
Wage RSE (3) |
|---|---|---|---|---|
| 272,190 | 1.4 % | $ 72.44 | $ 150,670 | 1.7 % |
Percentile wage estimates for Personal Financial Advisors:
| Percentile | 10% | 25% | 50% (Median) |
75% | 90% |
|---|---|---|---|---|---|
| Hourly Wage | $ 23.43 | $ 31.41 | $ 47.88 | $ 81.69 | (5) |
| Annual Wage (2) | $ 48,730 | $ 65,320 | $ 99,580 | $ 169,910 | (5) |
Industries with the highest published employment and wages for Personal Financial Advisors are provided. For a list of all industries with employment in Personal Financial Advisors, see the Create Customized Tables function.
Industries with the highest levels of employment in Personal Financial Advisors:
| Industry | Employment (1) | Percent of industry employment | Hourly mean wage | Annual mean wage (2) |
|---|---|---|---|---|
| Securities, Commodity Contracts, and Other Financial Investments and Related Activities | 191,490 | 18.00 | $ 78.95 | $ 164,210 |
| Credit Intermediation and Related Activities (5221 and 5223 only) | 48,360 | 2.37 | $ 54.18 | $ 112,700 |
| Agencies, Brokerages, and Other Insurance Related Activities | 7,560 | 0.57 | $ 49.93 | $ 103,860 |
| Management of Companies and Enterprises | 5,050 | 0.18 | (8) | (8) |
| Management, Scientific, and Technical Consulting Services | 3,470 | 0.19 | $ 58.77 | $ 122,240 |
Industries with the highest concentration of employment in Personal Financial Advisors:
| Industry | Employment (1) | Percent of industry employment | Hourly mean wage | Annual mean wage (2) |
|---|---|---|---|---|
| Securities, Commodity Contracts, and Other Financial Investments and Related Activities | 191,490 | 18.00 | $ 78.95 | $ 164,210 |
| Other Investment Pools and Funds | 1,120 | 6.05 | $ 61.79 | $ 128,510 |
| Insurance and Employee Benefit Funds | 390 | 3.39 | $ 38.86 | $ 80,820 |
| Credit Intermediation and Related Activities (5221 and 5223 only) | 48,360 | 2.37 | $ 54.18 | $ 112,700 |
| Agencies, Brokerages, and Other Insurance Related Activities | 7,560 | 0.57 | $ 49.93 | $ 103,860 |
Top paying industries for Personal Financial Advisors:
| Industry | Employment (1) | Percent of industry employment | Hourly mean wage | Annual mean wage (2) |
|---|---|---|---|---|
| Securities, Commodity Contracts, and Other Financial Investments and Related Activities | 191,490 | 18.00 | $ 78.95 | $ 164,210 |
| Oil and Gas Extraction | 60 | 0.05 | $ 70.97 | $ 147,620 |
| Business, Professional, Labor, Political, and Similar Organizations | (8) | (8) | $ 65.66 | $ 136,570 |
| Other Investment Pools and Funds | 1,120 | 6.05 | $ 61.79 | $ 128,510 |
| Automobile Dealers | 430 | 0.03 | $ 60.59 | $ 126,030 |
States and areas with the highest published employment, location quotients, and wages for Personal Financial Advisors are provided. For a list of all areas with employment in Personal Financial Advisors, see the Create Customized Tables function.
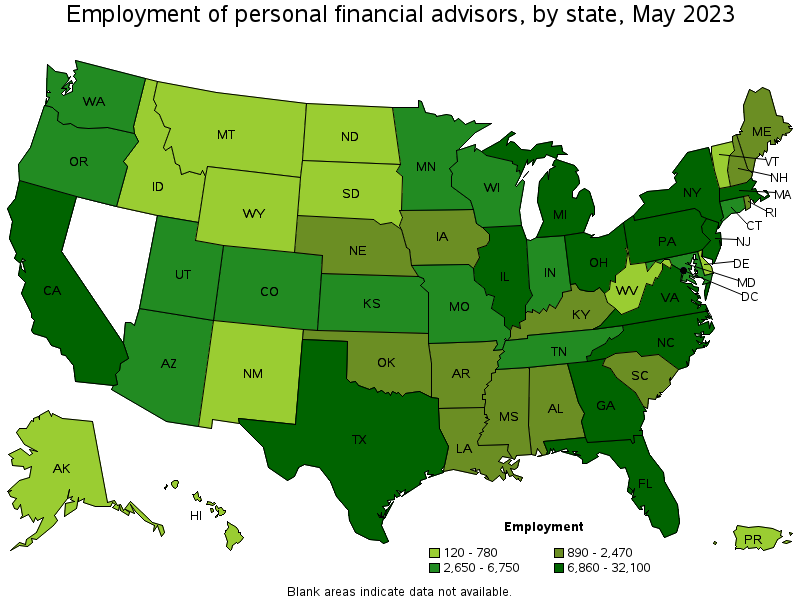
States with the highest employment level in Personal Financial Advisors:
| State | Employment (1) | Employment per thousand jobs | Location quotient (9) | Hourly mean wage | Annual mean wage (2) |
|---|---|---|---|---|---|
| California | 32,100 | 1.79 | 1.00 | $ 68.86 | $ 143,240 |
| New York | 27,440 | 2.92 | 1.63 | $ 98.98 | $ 205,870 |
| Florida | 20,920 | 2.19 | 1.22 | $ 72.38 | $ 150,550 |
| Texas | 18,740 | 1.38 | 0.77 | $ 56.92 | $ 118,390 |
| North Carolina | 14,500 | 3.02 | 1.69 | $ 65.98 | $ 137,240 |
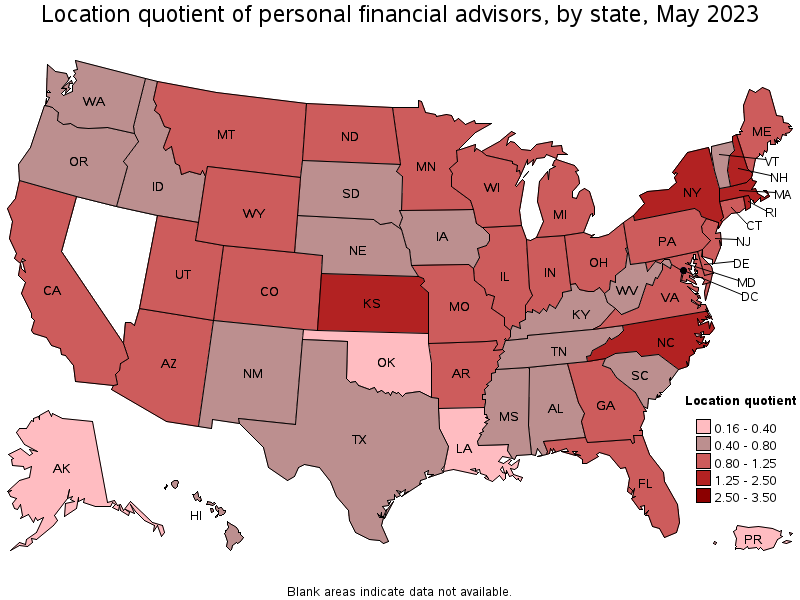
States with the highest concentration of jobs and location quotients in Personal Financial Advisors:
| State | Employment (1) | Employment per thousand jobs | Location quotient (9) | Hourly mean wage | Annual mean wage (2) |
|---|---|---|---|---|---|
| New Hampshire | 2,100 | 3.11 | 1.74 | $ 48.47 | $ 100,820 |
| North Carolina | 14,500 | 3.02 | 1.69 | $ 65.98 | $ 137,240 |
| New York | 27,440 | 2.92 | 1.63 | $ 98.98 | $ 205,870 |
| Massachusetts | 8,840 | 2.43 | 1.35 | $ 75.35 | $ 156,730 |
| Kansas | 3,310 | 2.35 | 1.31 | $ 75.75 | $ 157,570 |
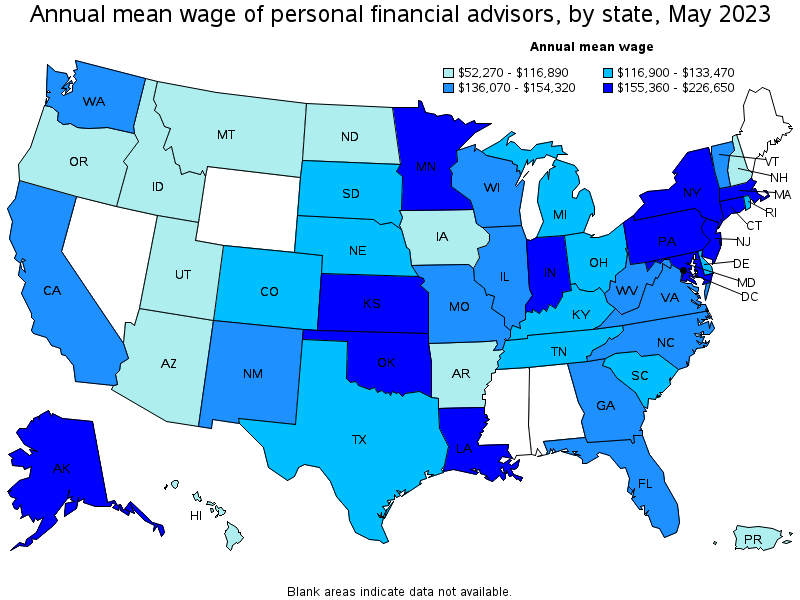
Top paying states for Personal Financial Advisors:
| State | Employment (1) | Employment per thousand jobs | Location quotient (9) | Hourly mean wage | Annual mean wage (2) |
|---|---|---|---|---|---|
| Alaska | 120 | 0.39 | 0.22 | $ 108.97 | $ 226,650 |
| New York | 27,440 | 2.92 | 1.63 | $ 98.98 | $ 205,870 |
| Louisiana | 1,070 | 0.58 | 0.32 | $ 88.92 | $ 184,950 |
| New Jersey | 8,320 | 1.98 | 1.10 | $ 85.72 | $ 178,300 |
| Pennsylvania | 11,360 | 1.91 | 1.07 | $ 84.08 | $ 174,890 |
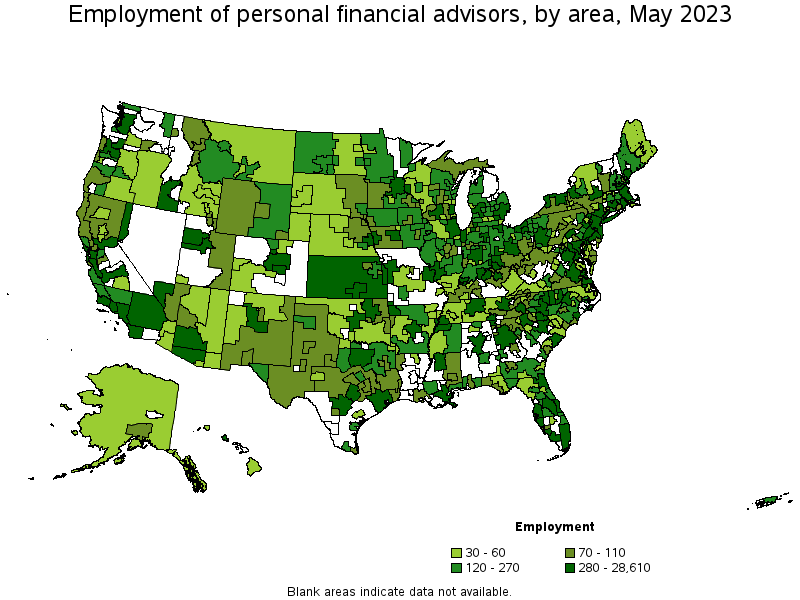
Metropolitan areas with the highest employment level in Personal Financial Advisors:
| Metropolitan area | Employment (1) | Employment per thousand jobs | Location quotient (9) | Hourly mean wage | Annual mean wage (2) |
|---|---|---|---|---|---|
| New York-Newark-Jersey City, NY-NJ-PA | 28,610 | 3.01 | 1.68 | $ 102.79 | $ 213,810 |
| Los Angeles-Long Beach-Anaheim, CA | 11,490 | 1.86 | 1.04 | $ 62.84 | $ 130,700 |
| Boston-Cambridge-Nashua, MA-NH | 8,250 | 2.99 | 1.67 | $ 72.59 | $ 150,980 |
| San Francisco-Oakland-Hayward, CA | 8,230 | 3.40 | 1.90 | $ 81.31 | $ 169,110 |
| Miami-Fort Lauderdale-West Palm Beach, FL | 8,190 | 3.01 | 1.68 | $ 75.62 | $ 157,290 |
| Dallas-Fort Worth-Arlington, TX | 7,700 | 1.94 | 1.08 | $ 59.54 | $ 123,840 |
| Chicago-Naperville-Elgin, IL-IN-WI | 7,480 | 1.66 | 0.93 | $ 78.12 | $ 162,490 |
| Philadelphia-Camden-Wilmington, PA-NJ-DE-MD | 7,400 | 2.62 | 1.46 | $ 79.50 | $ 165,350 |
| Charlotte-Concord-Gastonia, NC-SC | 6,530 | 4.98 | 2.78 | $ 66.02 | $ 137,320 |
| Washington-Arlington-Alexandria, DC-VA-MD-WV | 5,290 | 1.71 | 0.95 | $ 77.46 | $ 161,110 |
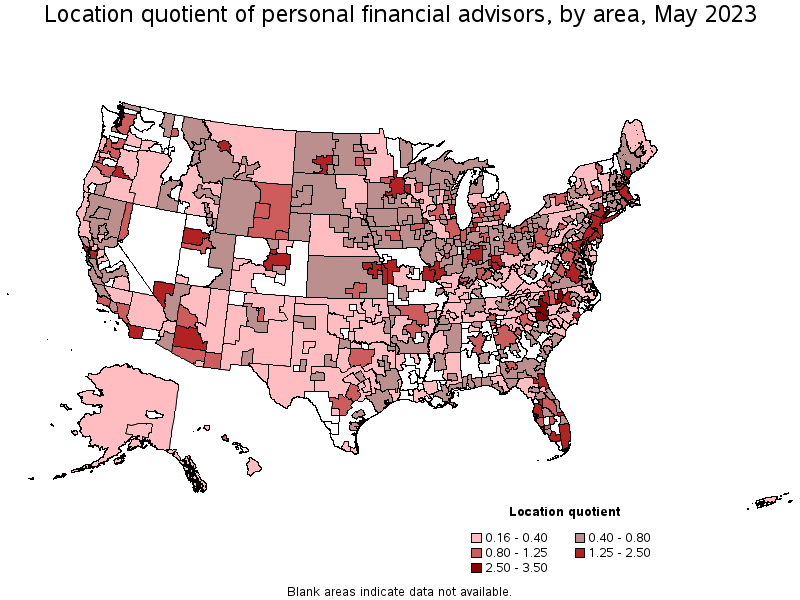
Metropolitan areas with the highest concentration of jobs and location quotients in Personal Financial Advisors:
| Metropolitan area | Employment (1) | Employment per thousand jobs | Location quotient (9) | Hourly mean wage | Annual mean wage (2) |
|---|---|---|---|---|---|
| Durham-Chapel Hill, NC | 1,860 | 5.53 | 3.08 | $ 57.23 | $ 119,050 |
| Bridgeport-Stamford-Norwalk, CT | 2,150 | 5.36 | 2.99 | $ 84.82 | $ 176,430 |
| Charlotte-Concord-Gastonia, NC-SC | 6,530 | 4.98 | 2.78 | $ 66.02 | $ 137,320 |
| The Villages, FL | 160 | 4.33 | 2.42 | $ 58.88 | $ 122,470 |
| Great Falls, MT | 130 | 3.69 | 2.06 | $ 60.63 | $ 126,110 |
| Trenton, NJ | 870 | 3.67 | 2.05 | $ 74.30 | $ 154,540 |
| Portsmouth, NH-ME | 330 | 3.56 | 1.98 | $ 55.86 | $ 116,180 |
| San Francisco-Oakland-Hayward, CA | 8,230 | 3.40 | 1.90 | $ 81.31 | $ 169,110 |
| Raleigh, NC | 2,130 | 3.03 | 1.69 | $ 75.45 | $ 156,940 |
| New York-Newark-Jersey City, NY-NJ-PA | 28,610 | 3.01 | 1.68 | $ 102.79 | $ 213,810 |
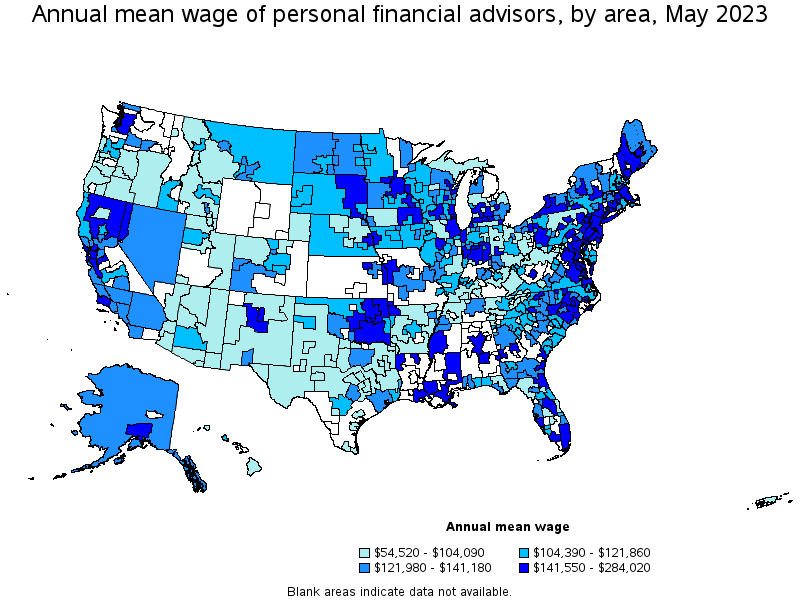
Top paying metropolitan areas for Personal Financial Advisors:
| Metropolitan area | Employment (1) | Employment per thousand jobs | Location quotient (9) | Hourly mean wage | Annual mean wage (2) |
|---|---|---|---|---|---|
| Anchorage, AK | 70 | 0.42 | 0.24 | $ 136.55 | $ 284,020 |
| New Orleans-Metairie, LA | 420 | 0.81 | 0.45 | $ 104.92 | $ 218,230 |
| Portland-South Portland, ME | 540 | 2.60 | 1.45 | $ 103.37 | $ 215,010 |
| New York-Newark-Jersey City, NY-NJ-PA | 28,610 | 3.01 | 1.68 | $ 102.79 | $ 213,810 |
| Pittsburgh, PA | 2,230 | 2.08 | 1.16 | $ 100.76 | $ 209,580 |
| Lafayette, LA | 90 | 0.47 | 0.26 | $ 93.88 | $ 195,270 |
| Indianapolis-Carmel-Anderson, IN | 2,460 | 2.27 | 1.27 | $ 92.00 | $ 191,350 |
| Baton Rouge, LA | 230 | 0.60 | 0.34 | $ 91.83 | $ 191,000 |
| York-Hanover, PA | 100 | 0.54 | 0.30 | $ 90.51 | $ 188,260 |
| Macon, GA | 110 | 1.20 | 0.67 | $ 89.41 | $ 185,960 |
Nonmetropolitan areas with the highest employment in Personal Financial Advisors:
| Nonmetropolitan area | Employment (1) | Employment per thousand jobs | Location quotient (9) | Hourly mean wage | Annual mean wage (2) |
|---|---|---|---|---|---|
| Kansas nonmetropolitan area | 360 | 0.94 | 0.52 | (8) | (8) |
| North Northeastern Ohio nonmetropolitan area (noncontiguous) | 250 | 0.77 | 0.43 | $ 49.18 | $ 102,300 |
| Southwest Montana nonmetropolitan area | 200 | 1.32 | 0.73 | $ 50.00 | $ 104,000 |
| North Arkansas nonmetropolitan area | 200 | 1.66 | 0.93 | $ 35.14 | $ 73,090 |
| Southeast Iowa nonmetropolitan area | 190 | 0.92 | 0.51 | $ 57.31 | $ 119,210 |
Nonmetropolitan areas with the highest concentration of jobs and location quotients in Personal Financial Advisors:
| Nonmetropolitan area | Employment (1) | Employment per thousand jobs | Location quotient (9) | Hourly mean wage | Annual mean wage (2) |
|---|---|---|---|---|---|
| Eastern Wyoming nonmetropolitan area | 170 | 2.04 | 1.14 | (8) | (8) |
| North Arkansas nonmetropolitan area | 200 | 1.66 | 0.93 | $ 35.14 | $ 73,090 |
| Northwest Lower Peninsula of Michigan nonmetropolitan area | 170 | 1.36 | 0.76 | $ 65.37 | $ 135,960 |
| West Montana nonmetropolitan area | 110 | 1.33 | 0.74 | $ 50.04 | $ 104,090 |
| Northeast Iowa nonmetropolitan area | 130 | 1.32 | 0.74 | $ 71.44 | $ 148,590 |
Top paying nonmetropolitan areas for Personal Financial Advisors:
| Nonmetropolitan area | Employment (1) | Employment per thousand jobs | Location quotient (9) | Hourly mean wage | Annual mean wage (2) |
|---|---|---|---|---|---|
| Northwest Mississippi nonmetropolitan area | 50 | 0.58 | 0.32 | $ 105.03 | $ 218,470 |
| Central Indiana nonmetropolitan area | 130 | 0.84 | 0.47 | $ 93.65 | $ 194,800 |
| Southeast Mississippi nonmetropolitan area | 80 | 0.52 | 0.29 | $ 80.38 | $ 167,200 |
| Southwest Maine nonmetropolitan area | 140 | 0.75 | 0.42 | $ 78.42 | $ 163,120 |
| East South Dakota nonmetropolitan area | 80 | 0.62 | 0.34 | $ 75.54 | $ 157,130 |
These estimates are calculated with data collected from employers in all industry sectors, all metropolitan and nonmetropolitan areas, and all states and the District of Columbia. The top employment and wage figures are provided above. The complete list is available in the downloadable XLS files.
The percentile wage estimate is the value of a wage below which a certain percent of workers fall. The median wage is the 50th percentile wage estimate—50 percent of workers earn less than the median and 50 percent of workers earn more than the median. More about percentile wages.
(1) Estimates for detailed occupations do not sum to the totals because the totals include occupations not shown separately. Estimates do not include self-employed workers.
(2) Annual wages have been calculated by multiplying the hourly mean wage by a "year-round, full-time" hours figure of 2,080 hours; for those occupations where there is not an hourly wage published, the annual wage has been directly calculated from the reported survey data.
(3) The relative standard error (RSE) is a measure of the reliability of a survey statistic. The smaller the relative standard error, the more precise the estimate.
(5) This wage is equal to or greater than $115.00 per hour or $239,200 per year.
(8) Estimate not released.
(9) The location quotient is the ratio of the area concentration of occupational employment to the national average concentration. A location quotient greater than one indicates the occupation has a higher share of employment than average, and a location quotient less than one indicates the occupation is less prevalent in the area than average.
Other OEWS estimates and related information:
May 2023 National Occupational Employment and Wage Estimates
May 2023 State Occupational Employment and Wage Estimates
May 2023 Metropolitan and Nonmetropolitan Area Occupational Employment and Wage Estimates
May 2023 National Industry-Specific Occupational Employment and Wage Estimates
Last Modified Date: April 3, 2024