
An official website of the United States government
An official website of the United States government
The .gov means it's official.
Federal government websites often end in .gov or .mil. Before sharing sensitive information,
make sure you're on a federal government site.
The site is secure.
The
https:// ensures that you are connecting to the official website and that any
information you provide is encrypted and transmitted securely.
Dispense drugs prescribed by physicians and other health practitioners and provide information to patients about medications and their use. May advise physicians and other health practitioners on the selection, dosage, interactions, and side effects of medications.
Employment estimate and mean wage estimates for Pharmacists:
| Employment (1) | Employment RSE (3) |
Mean hourly wage |
Mean annual wage (2) |
Wage RSE (3) |
|---|---|---|---|---|
| 331,700 | 0.6 % | $ 64.81 | $ 134,790 | 0.3 % |
Percentile wage estimates for Pharmacists:
| Percentile | 10% | 25% | 50% (Median) |
75% | 90% |
|---|---|---|---|---|---|
| Hourly Wage | $ 43.26 | $ 60.51 | $ 65.40 | $ 74.78 | $ 81.08 |
| Annual Wage (2) | $ 89,980 | $ 125,860 | $ 136,030 | $ 155,550 | $ 168,650 |
Industries with the highest published employment and wages for Pharmacists are provided. For a list of all industries with employment in Pharmacists, see the Create Customized Tables function.
Industries with the highest levels of employment in Pharmacists:
| Industry | Employment (1) | Percent of industry employment | Hourly mean wage | Annual mean wage (2) |
|---|---|---|---|---|
| Health and Personal Care Retailers | 134,050 | 12.09 | $ 61.06 | $ 126,990 |
| General Medical and Surgical Hospitals | 86,810 | 1.52 | $ 69.36 | $ 144,270 |
| Food and Beverage Retailers (4451 and 4452 only) | 23,750 | 0.78 | $ 60.72 | $ 126,300 |
| General Merchandise Retailers | 20,740 | 0.65 | $ 65.52 | $ 136,290 |
| Merchant Wholesalers, Nondurable Goods (4242 and 4246 only) | 7,690 | 1.95 | $ 66.46 | $ 138,240 |
Industries with the highest concentration of employment in Pharmacists:
| Industry | Employment (1) | Percent of industry employment | Hourly mean wage | Annual mean wage (2) |
|---|---|---|---|---|
| Health and Personal Care Retailers | 134,050 | 12.09 | $ 61.06 | $ 126,990 |
| Merchant Wholesalers, Nondurable Goods (4242 and 4246 only) | 7,690 | 1.95 | $ 66.46 | $ 138,240 |
| Specialty (except Psychiatric and Substance Abuse) Hospitals | 4,470 | 1.56 | $ 69.20 | $ 143,940 |
| General Medical and Surgical Hospitals | 86,810 | 1.52 | $ 69.36 | $ 144,270 |
| Food and Beverage Retailers (4451 and 4452 only) | 23,750 | 0.78 | $ 60.72 | $ 126,300 |
Top paying industries for Pharmacists:
| Industry | Employment (1) | Percent of industry employment | Hourly mean wage | Annual mean wage (2) |
|---|---|---|---|---|
| Outpatient Care Centers | 7,620 | 0.72 | $ 78.93 | $ 164,180 |
| Other Miscellaneous Retailers | 510 | 0.10 | $ 74.14 | $ 154,200 |
| Home Health Care Services | 2,660 | 0.17 | $ 70.36 | $ 146,350 |
| Management of Companies and Enterprises | 6,460 | 0.23 | $ 70.19 | $ 145,990 |
| Psychiatric and Substance Abuse Hospitals | 1,470 | 0.63 | $ 69.92 | $ 145,440 |
States and areas with the highest published employment, location quotients, and wages for Pharmacists are provided. For a list of all areas with employment in Pharmacists, see the Create Customized Tables function.
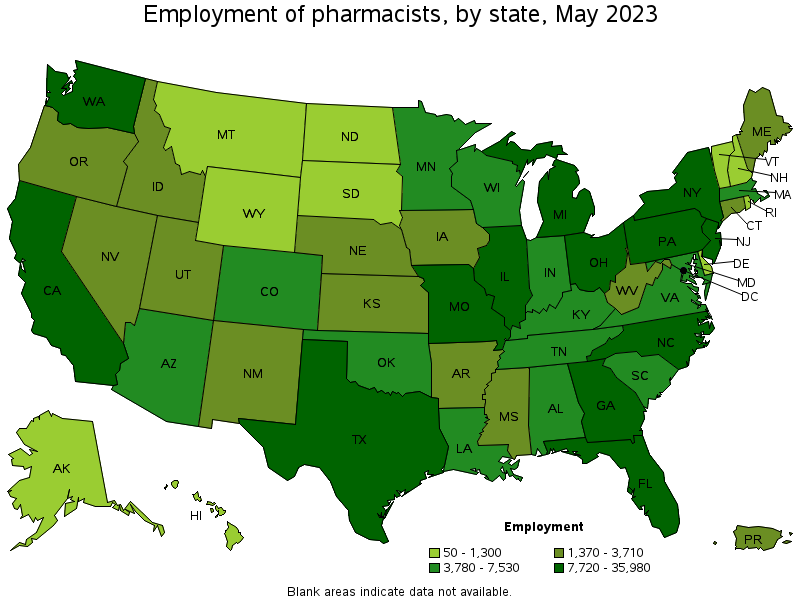
States with the highest employment level in Pharmacists:
| State | Employment (1) | Employment per thousand jobs | Location quotient (9) | Hourly mean wage | Annual mean wage (2) |
|---|---|---|---|---|---|
| California | 35,980 | 2.00 | 0.92 | $ 75.62 | $ 157,280 |
| Texas | 24,740 | 1.82 | 0.84 | $ 64.23 | $ 133,600 |
| Florida | 21,360 | 2.23 | 1.02 | $ 61.63 | $ 128,190 |
| New York | 20,310 | 2.16 | 0.99 | $ 63.96 | $ 133,040 |
| Pennsylvania | 15,230 | 2.56 | 1.17 | $ 63.08 | $ 131,200 |
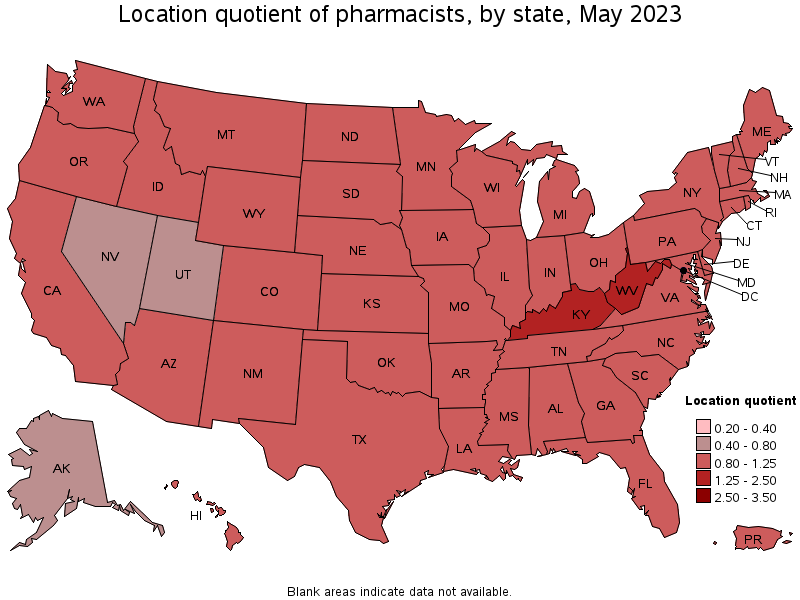
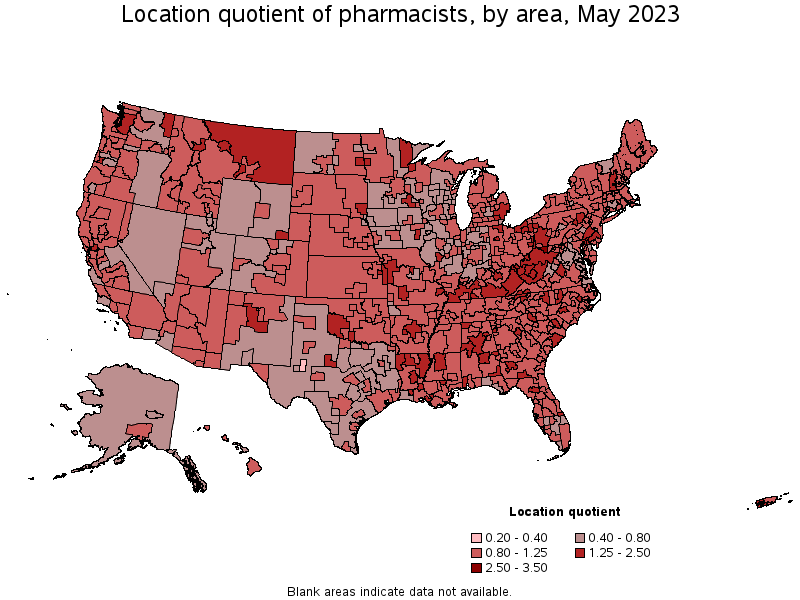
States with the highest concentration of jobs and location quotients in Pharmacists:
| State | Employment (1) | Employment per thousand jobs | Location quotient (9) | Hourly mean wage | Annual mean wage (2) |
|---|---|---|---|---|---|
| West Virginia | 2,530 | 3.67 | 1.68 | $ 58.17 | $ 121,000 |
| Kentucky | 5,480 | 2.79 | 1.28 | $ 62.99 | $ 131,020 |
| Washington | 9,450 | 2.70 | 1.24 | $ 71.42 | $ 148,550 |
| Missouri | 7,720 | 2.68 | 1.23 | $ 63.74 | $ 132,570 |
| Ohio | 14,620 | 2.67 | 1.22 | $ 60.03 | $ 124,850 |
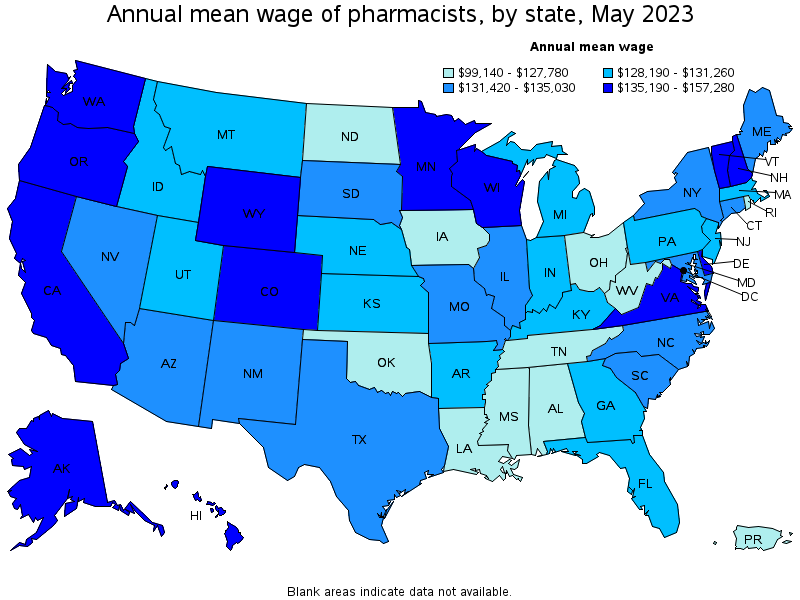
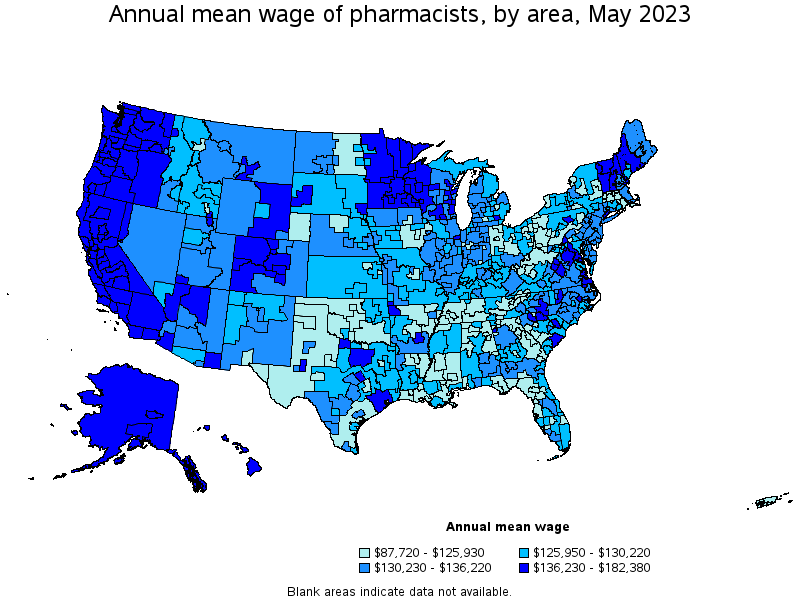
Top paying states for Pharmacists:
| State | Employment (1) | Employment per thousand jobs | Location quotient (9) | Hourly mean wage | Annual mean wage (2) |
|---|---|---|---|---|---|
| California | 35,980 | 2.00 | 0.92 | $ 75.62 | $ 157,280 |
| Alaska | 520 | 1.67 | 0.76 | $ 72.89 | $ 151,600 |
| Oregon | 3,710 | 1.91 | 0.87 | $ 71.90 | $ 149,550 |
| Washington | 9,450 | 2.70 | 1.24 | $ 71.42 | $ 148,550 |
| Minnesota | 6,250 | 2.17 | 0.99 | $ 68.85 | $ 143,210 |
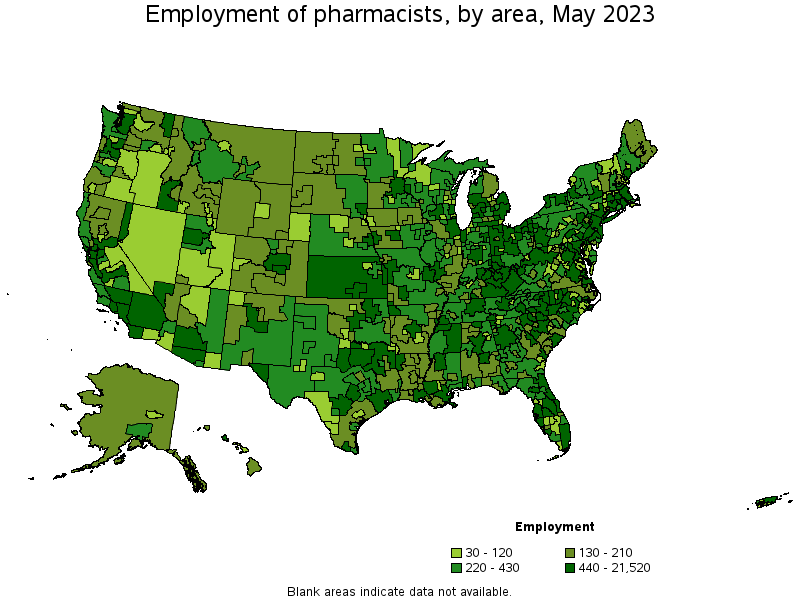
Metropolitan areas with the highest employment level in Pharmacists:
| Metropolitan area | Employment (1) | Employment per thousand jobs | Location quotient (9) | Hourly mean wage | Annual mean wage (2) |
|---|---|---|---|---|---|
| New York-Newark-Jersey City, NY-NJ-PA | 21,520 | 2.27 | 1.04 | $ 64.65 | $ 134,470 |
| Los Angeles-Long Beach-Anaheim, CA | 13,110 | 2.12 | 0.97 | $ 71.44 | $ 148,600 |
| Chicago-Naperville-Elgin, IL-IN-WI | 9,420 | 2.09 | 0.96 | $ 64.59 | $ 134,350 |
| Philadelphia-Camden-Wilmington, PA-NJ-DE-MD | 7,760 | 2.74 | 1.25 | $ 64.27 | $ 133,680 |
| Dallas-Fort Worth-Arlington, TX | 6,800 | 1.72 | 0.79 | $ 65.50 | $ 136,230 |
| Houston-The Woodlands-Sugar Land, TX | 6,760 | 2.13 | 0.97 | $ 65.89 | $ 137,040 |
| Seattle-Tacoma-Bellevue, WA | 6,380 | 3.07 | 1.40 | $ 73.05 | $ 151,940 |
| Atlanta-Sandy Springs-Roswell, GA | 6,200 | 2.20 | 1.01 | $ 63.13 | $ 131,300 |
| Miami-Fort Lauderdale-West Palm Beach, FL | 5,680 | 2.09 | 0.95 | $ 62.45 | $ 129,890 |
| Boston-Cambridge-Nashua, MA-NH | 5,630 | 2.04 | 0.93 | $ 63.09 | $ 131,220 |
Metropolitan areas with the highest concentration of jobs and location quotients in Pharmacists:
| Metropolitan area | Employment (1) | Employment per thousand jobs | Location quotient (9) | Hourly mean wage | Annual mean wage (2) |
|---|---|---|---|---|---|
| Morgantown, WV | 440 | 6.73 | 3.08 | $ 54.69 | $ 113,750 |
| Iowa City, IA | 420 | 4.60 | 2.11 | $ 59.76 | $ 124,300 |
| Bloomsburg-Berwick, PA | 180 | 4.51 | 2.06 | $ 61.27 | $ 127,450 |
| Huntington-Ashland, WV-KY-OH | 520 | 4.01 | 1.84 | $ 57.86 | $ 120,360 |
| Beckley, WV | 160 | 3.90 | 1.79 | $ 57.29 | $ 119,170 |
| Florence, SC | 340 | 3.85 | 1.76 | $ 81.58 | $ 169,680 |
| Charleston, WV | 370 | 3.63 | 1.66 | $ 57.85 | $ 120,320 |
| Lexington-Fayette, KY | 1,010 | 3.63 | 1.66 | $ 60.84 | $ 126,550 |
| Johnson City, TN | 290 | 3.61 | 1.65 | $ 58.02 | $ 120,690 |
| Cape Girardeau, MO-IL | 160 | 3.59 | 1.64 | $ 62.42 | $ 129,820 |
Top paying metropolitan areas for Pharmacists:
| Metropolitan area | Employment (1) | Employment per thousand jobs | Location quotient (9) | Hourly mean wage | Annual mean wage (2) |
|---|---|---|---|---|---|
| Napa, CA | 180 | 2.28 | 1.04 | $ 87.68 | $ 182,380 |
| San Francisco-Oakland-Hayward, CA | 4,520 | 1.87 | 0.85 | $ 86.30 | $ 179,500 |
| San Jose-Sunnyvale-Santa Clara, CA | 2,090 | 1.83 | 0.84 | $ 86.02 | $ 178,920 |
| Vallejo-Fairfield, CA | 450 | 3.28 | 1.50 | $ 83.95 | $ 174,620 |
| Florence, SC | 340 | 3.85 | 1.76 | $ 81.58 | $ 169,680 |
| Santa Rosa, CA | 370 | 1.77 | 0.81 | $ 79.74 | $ 165,860 |
| Sacramento--Roseville--Arden-Arcade, CA | 2,270 | 2.17 | 0.99 | $ 78.55 | $ 163,380 |
| Madera, CA | 120 | 2.27 | 1.04 | $ 77.68 | $ 161,570 |
| San Luis Obispo-Paso Robles-Arroyo Grande, CA | 260 | 2.13 | 0.98 | $ 77.22 | $ 160,630 |
| Santa Maria-Santa Barbara, CA | 290 | 1.44 | 0.66 | $ 77.21 | $ 160,590 |
Nonmetropolitan areas with the highest employment in Pharmacists:
| Nonmetropolitan area | Employment (1) | Employment per thousand jobs | Location quotient (9) | Hourly mean wage | Annual mean wage (2) |
|---|---|---|---|---|---|
| Kansas nonmetropolitan area | 850 | 2.19 | 1.00 | $ 61.95 | $ 128,860 |
| North Northeastern Ohio nonmetropolitan area (noncontiguous) | 590 | 1.82 | 0.83 | $ 60.87 | $ 126,600 |
| Northeast Mississippi nonmetropolitan area | 570 | 2.52 | 1.15 | $ 60.85 | $ 126,570 |
| Piedmont North Carolina nonmetropolitan area | 570 | 2.23 | 1.02 | $ 63.99 | $ 133,100 |
| Southeast Coastal North Carolina nonmetropolitan area | 560 | 2.25 | 1.03 | $ 62.78 | $ 130,590 |
Nonmetropolitan areas with the highest concentration of jobs and location quotients in Pharmacists:
| Nonmetropolitan area | Employment (1) | Employment per thousand jobs | Location quotient (9) | Hourly mean wage | Annual mean wage (2) |
|---|---|---|---|---|---|
| East Kentucky nonmetropolitan area | 440 | 4.39 | 2.01 | $ 63.47 | $ 132,010 |
| Northern West Virginia nonmetropolitan area | 450 | 3.33 | 1.53 | $ 58.25 | $ 121,160 |
| Southern West Virginia nonmetropolitan area | 230 | 3.27 | 1.50 | $ 62.14 | $ 129,250 |
| Northeast Louisiana nonmetropolitan area | 200 | 3.14 | 1.44 | $ 59.67 | $ 124,110 |
| East-Central Montana nonmetropolitan area | 190 | 2.94 | 1.35 | $ 62.63 | $ 130,260 |
Top paying nonmetropolitan areas for Pharmacists:
| Nonmetropolitan area | Employment (1) | Employment per thousand jobs | Location quotient (9) | Hourly mean wage | Annual mean wage (2) |
|---|---|---|---|---|---|
| North Valley-Northern Mountains Region of California nonmetropolitan area | 190 | 1.89 | 0.87 | $ 79.20 | $ 164,740 |
| Alaska nonmetropolitan area | 150 | 1.50 | 0.69 | $ 74.81 | $ 155,610 |
| Eastern Sierra-Mother Lode Region of California nonmetropolitan area | 90 | 1.55 | 0.71 | $ 73.79 | $ 153,490 |
| North Coast Region of California nonmetropolitan area | 220 | 2.05 | 0.94 | $ 73.05 | $ 151,940 |
| Northwest Colorado nonmetropolitan area | 190 | 1.47 | 0.67 | $ 70.61 | $ 146,860 |
These estimates are calculated with data collected from employers in all industry sectors, all metropolitan and nonmetropolitan areas, and all states and the District of Columbia. The top employment and wage figures are provided above. The complete list is available in the downloadable XLS files.
The percentile wage estimate is the value of a wage below which a certain percent of workers fall. The median wage is the 50th percentile wage estimate—50 percent of workers earn less than the median and 50 percent of workers earn more than the median. More about percentile wages.
(1) Estimates for detailed occupations do not sum to the totals because the totals include occupations not shown separately. Estimates do not include self-employed workers.
(2) Annual wages have been calculated by multiplying the hourly mean wage by a "year-round, full-time" hours figure of 2,080 hours; for those occupations where there is not an hourly wage published, the annual wage has been directly calculated from the reported survey data.
(3) The relative standard error (RSE) is a measure of the reliability of a survey statistic. The smaller the relative standard error, the more precise the estimate.
(9) The location quotient is the ratio of the area concentration of occupational employment to the national average concentration. A location quotient greater than one indicates the occupation has a higher share of employment than average, and a location quotient less than one indicates the occupation is less prevalent in the area than average.
Other OEWS estimates and related information:
May 2023 National Occupational Employment and Wage Estimates
May 2023 State Occupational Employment and Wage Estimates
May 2023 Metropolitan and Nonmetropolitan Area Occupational Employment and Wage Estimates
May 2023 National Industry-Specific Occupational Employment and Wage Estimates
Last Modified Date: April 3, 2024