
An official website of the United States government
An official website of the United States government
The .gov means it's official.
Federal government websites often end in .gov or .mil. Before sharing sensitive information,
make sure you're on a federal government site.
The site is secure.
The
https:// ensures that you are connecting to the official website and that any
information you provide is encrypted and transmitted securely.
Direct and may participate in the preparation, seasoning, and cooking of salads, soups, fish, meats, vegetables, desserts, or other foods. May plan and price menu items, order supplies, and keep records and accounts.
Employment estimate and mean wage estimates for Chefs and Head Cooks:
| Employment (1) | Employment RSE (3) |
Mean hourly wage |
Mean annual wage (2) |
Wage RSE (3) |
|---|---|---|---|---|
| 172,370 | 3.1 % | $ 30.12 | $ 62,640 | 0.9 % |
Percentile wage estimates for Chefs and Head Cooks:
| Percentile | 10% | 25% | 50% (Median) |
75% | 90% |
|---|---|---|---|---|---|
| Hourly Wage | $ 17.33 | $ 21.92 | $ 28.33 | $ 36.34 | $ 45.14 |
| Annual Wage (2) | $ 36,040 | $ 45,590 | $ 58,920 | $ 75,590 | $ 93,900 |
Industries with the highest published employment and wages for Chefs and Head Cooks are provided. For a list of all industries with employment in Chefs and Head Cooks, see the Create Customized Tables function.
Industries with the highest levels of employment in Chefs and Head Cooks:
| Industry | Employment (1) | Percent of industry employment | Hourly mean wage | Annual mean wage (2) |
|---|---|---|---|---|
| Restaurants and Other Eating Places | 91,660 | 0.84 | $ 28.15 | $ 58,560 |
| Special Food Services | 18,990 | 2.64 | $ 32.30 | $ 67,190 |
| Traveler Accommodation | 17,870 | 0.97 | $ 35.24 | $ 73,300 |
| Other Amusement and Recreation Industries | 9,590 | 0.70 | $ 36.81 | $ 76,560 |
| Continuing Care Retirement Communities and Assisted Living Facilities for the Elderly | 4,250 | 0.46 | $ 27.75 | $ 57,710 |
Industries with the highest concentration of employment in Chefs and Head Cooks:
| Industry | Employment (1) | Percent of industry employment | Hourly mean wage | Annual mean wage (2) |
|---|---|---|---|---|
| Special Food Services | 18,990 | 2.64 | $ 32.30 | $ 67,190 |
| Traveler Accommodation | 17,870 | 0.97 | $ 35.24 | $ 73,300 |
| Rooming and Boarding Houses, Dormitories, and Workers' Camps | 90 | 0.91 | $ 27.11 | $ 56,380 |
| Restaurants and Other Eating Places | 91,660 | 0.84 | $ 28.15 | $ 58,560 |
| Other Amusement and Recreation Industries | 9,590 | 0.70 | $ 36.81 | $ 76,560 |
Top paying industries for Chefs and Head Cooks:
| Industry | Employment (1) | Percent of industry employment | Hourly mean wage | Annual mean wage (2) |
|---|---|---|---|---|
| Merchant Wholesalers, Nondurable Goods (4244 and 4248 only) | 350 | 0.03 | $ 55.45 | $ 115,330 |
| Securities, Commodity Contracts, and Other Financial Investments and Related Activities | (8) | (8) | $ 52.07 | $ 108,300 |
| Scientific Research and Development Services | 70 | 0.01 | $ 48.58 | $ 101,040 |
| Motion Picture and Video Industries | 130 | 0.03 | $ 40.90 | $ 85,060 |
| Federal, State, and Local Government, excluding State and Local Government Schools and Hospitals and the U.S. Postal Service (OEWS Designation) | 1,420 | 0.07 | $ 40.07 | $ 83,340 |
States and areas with the highest published employment, location quotients, and wages for Chefs and Head Cooks are provided. For a list of all areas with employment in Chefs and Head Cooks, see the Create Customized Tables function.
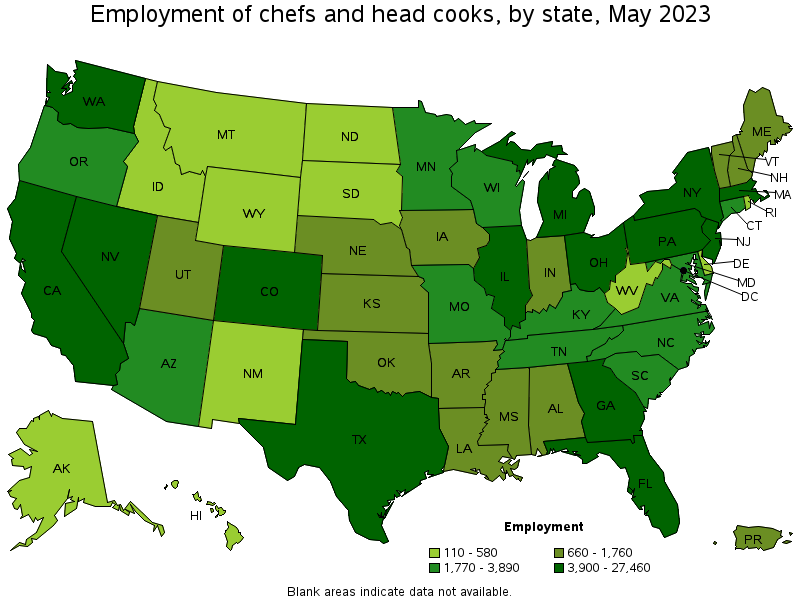
States with the highest employment level in Chefs and Head Cooks:
| State | Employment (1) | Employment per thousand jobs | Location quotient (9) | Hourly mean wage | Annual mean wage (2) |
|---|---|---|---|---|---|
| California | 27,460 | 1.53 | 1.35 | $ 32.28 | $ 67,150 |
| Florida | 14,910 | 1.56 | 1.37 | $ 29.75 | $ 61,880 |
| Texas | 13,670 | 1.01 | 0.89 | $ 25.46 | $ 52,950 |
| New York | 13,670 | 1.45 | 1.28 | $ 32.89 | $ 68,410 |
| Illinois | 7,650 | 1.27 | 1.12 | $ 32.03 | $ 66,610 |
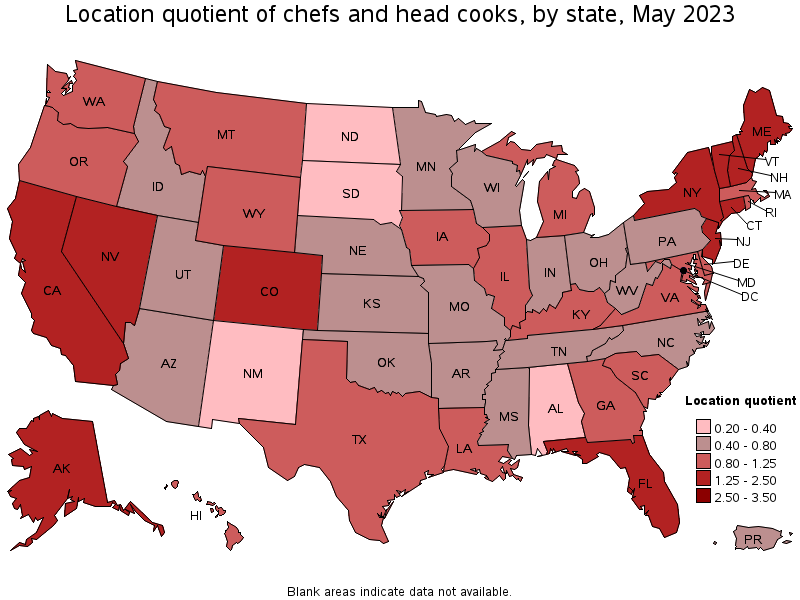
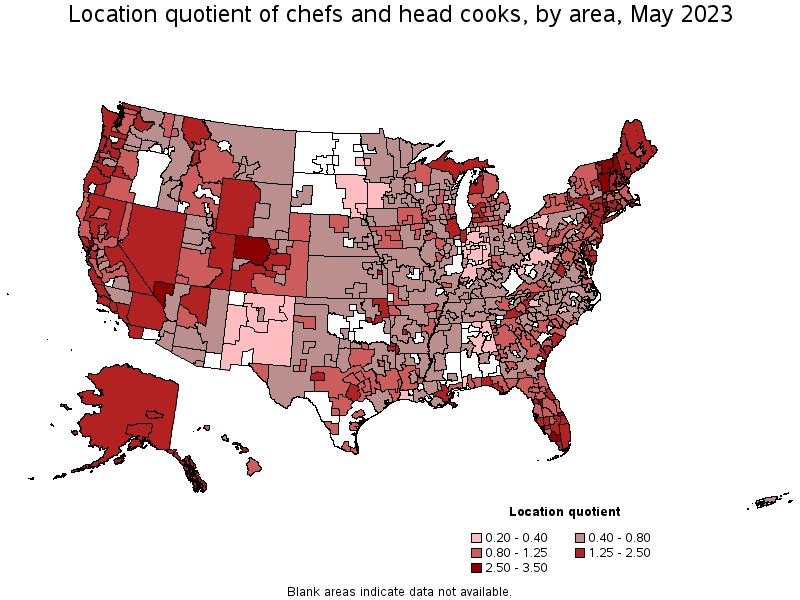
States with the highest concentration of jobs and location quotients in Chefs and Head Cooks:
| State | Employment (1) | Employment per thousand jobs | Location quotient (9) | Hourly mean wage | Annual mean wage (2) |
|---|---|---|---|---|---|
| Nevada | 3,900 | 2.63 | 2.32 | $ 29.82 | $ 62,020 |
| Vermont | 770 | 2.57 | 2.27 | $ 31.19 | $ 64,870 |
| District of Columbia | 1,770 | 2.52 | 2.22 | $ 36.31 | $ 75,520 |
| Connecticut | 3,490 | 2.10 | 1.85 | $ 32.19 | $ 66,950 |
| Alaska | 570 | 1.81 | 1.60 | $ 31.59 | $ 65,710 |
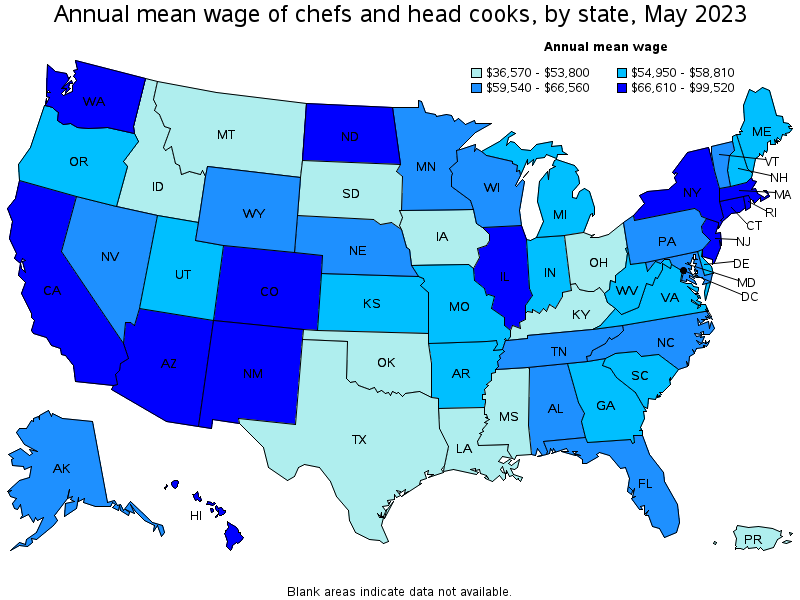
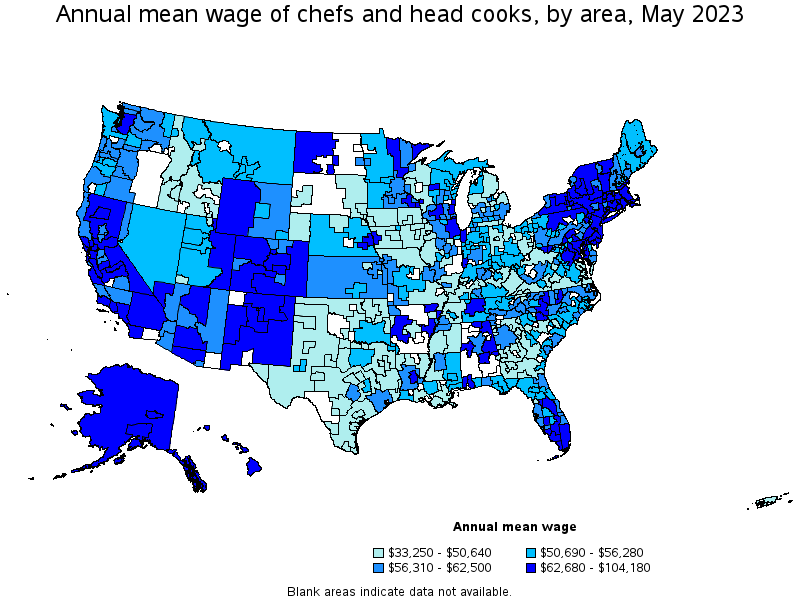
Top paying states for Chefs and Head Cooks:
| State | Employment (1) | Employment per thousand jobs | Location quotient (9) | Hourly mean wage | Annual mean wage (2) |
|---|---|---|---|---|---|
| Hawaii | 580 | 0.94 | 0.83 | $ 47.84 | $ 99,520 |
| Rhode Island | 500 | 1.02 | 0.90 | $ 39.03 | $ 81,170 |
| Massachusetts | 4,470 | 1.23 | 1.08 | $ 37.08 | $ 77,120 |
| District of Columbia | 1,770 | 2.52 | 2.22 | $ 36.31 | $ 75,520 |
| New Jersey | 6,350 | 1.51 | 1.33 | $ 34.18 | $ 71,100 |
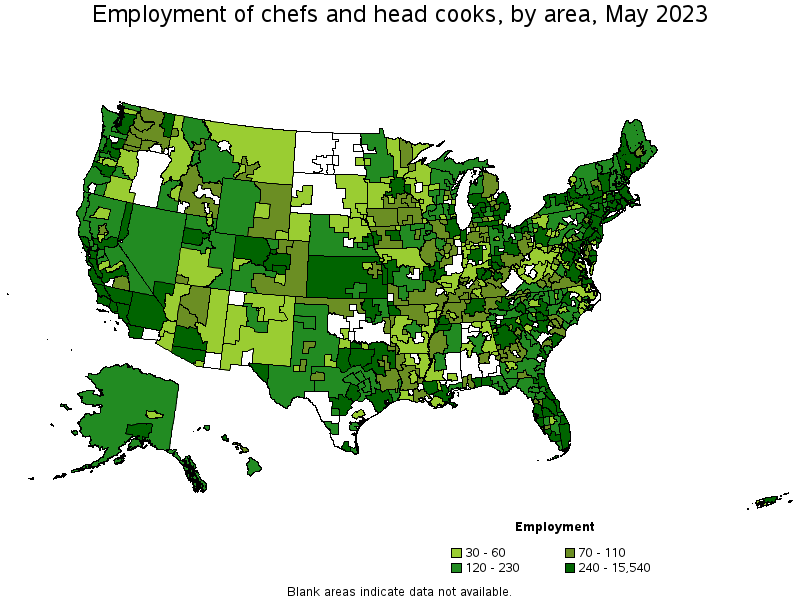
Metropolitan areas with the highest employment level in Chefs and Head Cooks:
| Metropolitan area | Employment (1) | Employment per thousand jobs | Location quotient (9) | Hourly mean wage | Annual mean wage (2) |
|---|---|---|---|---|---|
| New York-Newark-Jersey City, NY-NJ-PA | 15,540 | 1.64 | 1.44 | $ 33.68 | $ 70,060 |
| Los Angeles-Long Beach-Anaheim, CA | 9,480 | 1.53 | 1.35 | $ 31.28 | $ 65,060 |
| Chicago-Naperville-Elgin, IL-IN-WI | 6,500 | 1.44 | 1.27 | $ 32.99 | $ 68,620 |
| Miami-Fort Lauderdale-West Palm Beach, FL | 5,600 | 2.06 | 1.81 | $ 30.35 | $ 63,130 |
| San Francisco-Oakland-Hayward, CA | 4,820 | 1.99 | 1.75 | $ 34.14 | $ 71,020 |
| Washington-Arlington-Alexandria, DC-VA-MD-WV | 4,160 | 1.35 | 1.19 | $ 33.54 | $ 69,770 |
| Dallas-Fort Worth-Arlington, TX | 3,690 | 0.93 | 0.82 | $ 26.19 | $ 54,460 |
| Boston-Cambridge-Nashua, MA-NH | 3,400 | 1.23 | 1.08 | $ 37.52 | $ 78,040 |
| Las Vegas-Henderson-Paradise, NV | 3,380 | 3.12 | 2.75 | $ 30.15 | $ 62,700 |
| Philadelphia-Camden-Wilmington, PA-NJ-DE-MD | 2,940 | 1.04 | 0.91 | $ 34.35 | $ 71,440 |
Metropolitan areas with the highest concentration of jobs and location quotients in Chefs and Head Cooks:
| Metropolitan area | Employment (1) | Employment per thousand jobs | Location quotient (9) | Hourly mean wage | Annual mean wage (2) |
|---|---|---|---|---|---|
| Brunswick, GA | 160 | 3.51 | 3.09 | $ 26.61 | $ 55,350 |
| Ocean City, NJ | 140 | 3.46 | 3.05 | $ 33.99 | $ 70,690 |
| Naples-Immokalee-Marco Island, FL | 540 | 3.33 | 2.93 | $ 33.99 | $ 70,700 |
| Sebastian-Vero Beach, FL | 180 | 3.32 | 2.92 | $ 28.70 | $ 59,700 |
| Las Vegas-Henderson-Paradise, NV | 3,380 | 3.12 | 2.75 | $ 30.15 | $ 62,700 |
| Napa, CA | 230 | 2.95 | 2.60 | $ 38.62 | $ 80,320 |
| The Villages, FL | 110 | 2.92 | 2.57 | $ 32.03 | $ 66,630 |
| Kingston, NY | 160 | 2.82 | 2.49 | $ 29.69 | $ 61,760 |
| Barnstable Town, MA | 280 | 2.76 | 2.43 | $ 35.92 | $ 74,720 |
| Bridgeport-Stamford-Norwalk, CT | 1,100 | 2.75 | 2.42 | $ 34.68 | $ 72,130 |
Top paying metropolitan areas for Chefs and Head Cooks:
| Metropolitan area | Employment (1) | Employment per thousand jobs | Location quotient (9) | Hourly mean wage | Annual mean wage (2) |
|---|---|---|---|---|---|
| Kahului-Wailuku-Lahaina, HI | 110 | 1.51 | 1.33 | $ 50.09 | $ 104,180 |
| Urban Honolulu, HI | 330 | 0.75 | 0.66 | $ 47.22 | $ 98,220 |
| Napa, CA | 230 | 2.95 | 2.60 | $ 38.62 | $ 80,320 |
| Providence-Warwick, RI-MA | 580 | 1.02 | 0.90 | $ 37.70 | $ 78,410 |
| Terre Haute, IN | 40 | 0.56 | 0.49 | $ 37.67 | $ 78,360 |
| Boston-Cambridge-Nashua, MA-NH | 3,400 | 1.23 | 1.08 | $ 37.52 | $ 78,040 |
| Barnstable Town, MA | 280 | 2.76 | 2.43 | $ 35.92 | $ 74,720 |
| Seattle-Tacoma-Bellevue, WA | 2,860 | 1.38 | 1.21 | $ 35.63 | $ 74,100 |
| Santa Fe, NM | 50 | 0.88 | 0.78 | $ 35.35 | $ 73,530 |
| Atlantic City-Hammonton, NJ | 330 | 2.67 | 2.35 | $ 35.02 | $ 72,840 |
Nonmetropolitan areas with the highest employment in Chefs and Head Cooks:
| Nonmetropolitan area | Employment (1) | Employment per thousand jobs | Location quotient (9) | Hourly mean wage | Annual mean wage (2) |
|---|---|---|---|---|---|
| Northwest Colorado nonmetropolitan area | 430 | 3.40 | 3.00 | $ 36.23 | $ 75,360 |
| Southwest Maine nonmetropolitan area | 340 | 1.77 | 1.56 | $ 26.64 | $ 55,410 |
| Kansas nonmetropolitan area | 330 | 0.86 | 0.76 | $ 27.83 | $ 57,890 |
| Southern Vermont nonmetropolitan area | 310 | 3.07 | 2.71 | $ 31.67 | $ 65,870 |
| Balance of Lower Peninsula of Michigan nonmetropolitan area | 280 | 1.08 | 0.95 | $ 22.35 | $ 46,480 |
Nonmetropolitan areas with the highest concentration of jobs and location quotients in Chefs and Head Cooks:
| Nonmetropolitan area | Employment (1) | Employment per thousand jobs | Location quotient (9) | Hourly mean wage | Annual mean wage (2) |
|---|---|---|---|---|---|
| Connecticut nonmetropolitan area | 120 | 3.60 | 3.17 | $ 29.74 | $ 61,860 |
| Northern New Hampshire nonmetropolitan area | 120 | 3.41 | 3.01 | $ 28.17 | $ 58,590 |
| Northwest Colorado nonmetropolitan area | 430 | 3.40 | 3.00 | $ 36.23 | $ 75,360 |
| Northern Vermont nonmetropolitan area | 230 | 3.27 | 2.88 | $ 32.17 | $ 66,910 |
| Southern Vermont nonmetropolitan area | 310 | 3.07 | 2.71 | $ 31.67 | $ 65,870 |
Top paying nonmetropolitan areas for Chefs and Head Cooks:
| Nonmetropolitan area | Employment (1) | Employment per thousand jobs | Location quotient (9) | Hourly mean wage | Annual mean wage (2) |
|---|---|---|---|---|---|
| Hawaii / Kauai nonmetropolitan area | 140 | 1.38 | 1.21 | $ 47.47 | $ 98,740 |
| West North Dakota nonmetropolitan area | (8) | (8) | (8) | $ 37.51 | $ 78,020 |
| Northwest Colorado nonmetropolitan area | 430 | 3.40 | 3.00 | $ 36.23 | $ 75,360 |
| West Arkansas nonmetropolitan area | 50 | 0.62 | 0.55 | $ 35.66 | $ 74,160 |
| Massachusetts nonmetropolitan area | 140 | 2.24 | 1.97 | $ 35.61 | $ 74,060 |
These estimates are calculated with data collected from employers in all industry sectors, all metropolitan and nonmetropolitan areas, and all states and the District of Columbia. The top employment and wage figures are provided above. The complete list is available in the downloadable XLS files.
The percentile wage estimate is the value of a wage below which a certain percent of workers fall. The median wage is the 50th percentile wage estimate—50 percent of workers earn less than the median and 50 percent of workers earn more than the median. More about percentile wages.
(1) Estimates for detailed occupations do not sum to the totals because the totals include occupations not shown separately. Estimates do not include self-employed workers.
(2) Annual wages have been calculated by multiplying the hourly mean wage by a "year-round, full-time" hours figure of 2,080 hours; for those occupations where there is not an hourly wage published, the annual wage has been directly calculated from the reported survey data.
(3) The relative standard error (RSE) is a measure of the reliability of a survey statistic. The smaller the relative standard error, the more precise the estimate.
(8) Estimate not released.
(9) The location quotient is the ratio of the area concentration of occupational employment to the national average concentration. A location quotient greater than one indicates the occupation has a higher share of employment than average, and a location quotient less than one indicates the occupation is less prevalent in the area than average.
Other OEWS estimates and related information:
May 2023 National Occupational Employment and Wage Estimates
May 2023 State Occupational Employment and Wage Estimates
May 2023 Metropolitan and Nonmetropolitan Area Occupational Employment and Wage Estimates
May 2023 National Industry-Specific Occupational Employment and Wage Estimates
Last Modified Date: April 3, 2024