
An official website of the United States government
An official website of the United States government
The .gov means it's official.
Federal government websites often end in .gov or .mil. Before sharing sensitive information,
make sure you're on a federal government site.
The site is secure.
The
https:// ensures that you are connecting to the official website and that any
information you provide is encrypted and transmitted securely.
Compile information and records to draw up purchase orders for procurement of materials and services. Excludes �Wholesale and Retail Buyers, Except Farm Products� (13-1022).
Employment estimate and mean wage estimates for Procurement Clerks:
| Employment (1) | Employment RSE (3) |
Mean hourly wage |
Mean annual wage (2) |
Wage RSE (3) |
|---|---|---|---|---|
| 61,580 | 1.1 % | $ 23.05 | $ 47,940 | 0.3 % |
Percentile wage estimates for Procurement Clerks:
| Percentile | 10% | 25% | 50% (Median) |
75% | 90% |
|---|---|---|---|---|---|
| Hourly Wage | $ 16.60 | $ 18.72 | $ 22.44 | $ 26.34 | $ 30.36 |
| Annual Wage (2) | $ 34,520 | $ 38,940 | $ 46,670 | $ 54,790 | $ 63,140 |
Industries with the highest published employment and wages for Procurement Clerks are provided. For a list of all industries with employment in Procurement Clerks, see the Create Customized Tables function.
Industries with the highest levels of employment in Procurement Clerks:
| Industry | Employment (1) | Percent of industry employment | Hourly mean wage | Annual mean wage (2) |
|---|---|---|---|---|
| Federal, State, and Local Government, excluding State and Local Government Schools and Hospitals and the U.S. Postal Service (OEWS Designation) | 9,230 | 0.43 | $ 25.11 | $ 52,230 |
| Management of Companies and Enterprises | 3,800 | 0.14 | $ 24.88 | $ 51,750 |
| General Medical and Surgical Hospitals | 3,000 | 0.05 | $ 20.78 | $ 43,220 |
| Local Government, excluding Schools and Hospitals (OEWS Designation) | 2,310 | 0.04 | $ 26.91 | $ 55,960 |
| Apparel, Piece Goods, and Notions Merchant Wholesalers | 2,290 | 1.58 | $ 18.03 | $ 37,490 |
Industries with the highest concentration of employment in Procurement Clerks:
| Industry | Employment (1) | Percent of industry employment | Hourly mean wage | Annual mean wage (2) |
|---|---|---|---|---|
| Apparel, Piece Goods, and Notions Merchant Wholesalers | 2,290 | 1.58 | $ 18.03 | $ 37,490 |
| Federal, State, and Local Government, excluding State and Local Government Schools and Hospitals and the U.S. Postal Service (OEWS Designation) | 9,230 | 0.43 | $ 25.11 | $ 52,230 |
| Electric Lighting Equipment Manufacturing | 70 | 0.18 | $ 20.11 | $ 41,820 |
| Cut and Sew Apparel Manufacturing | 120 | 0.17 | $ 21.10 | $ 43,900 |
| Miscellaneous Store Retailers (4594 and 4595 only) | 680 | 0.16 | $ 17.96 | $ 37,360 |
Top paying industries for Procurement Clerks:
| Industry | Employment (1) | Percent of industry employment | Hourly mean wage | Annual mean wage (2) |
|---|---|---|---|---|
| Specialized Design Services | 220 | 0.14 | $ 32.95 | $ 68,530 |
| Computer and Peripheral Equipment Manufacturing | 60 | 0.04 | $ 31.21 | $ 64,910 |
| Electric Power Generation, Transmission and Distribution | 200 | 0.05 | $ 31.14 | $ 64,780 |
| Scientific Research and Development Services | 260 | 0.03 | $ 30.69 | $ 63,830 |
| Rail Transportation | 100 | 0.06 | $ 30.53 | $ 63,490 |
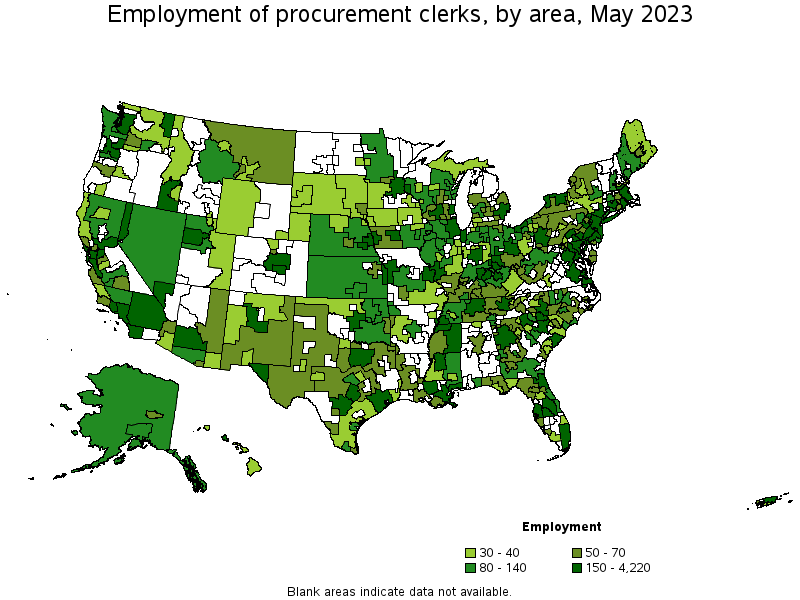
States and areas with the highest published employment, location quotients, and wages for Procurement Clerks are provided. For a list of all areas with employment in Procurement Clerks, see the Create Customized Tables function.
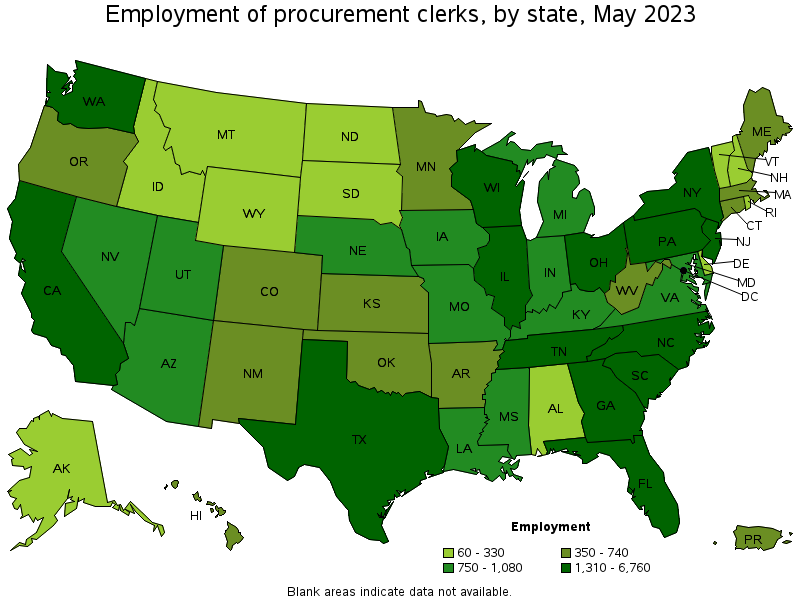
States with the highest employment level in Procurement Clerks:
| State | Employment (1) | Employment per thousand jobs | Location quotient (9) | Hourly mean wage | Annual mean wage (2) |
|---|---|---|---|---|---|
| California | 6,760 | 0.38 | 0.93 | $ 25.66 | $ 53,370 |
| Texas | 4,350 | 0.32 | 0.79 | $ 21.71 | $ 45,160 |
| Florida | 3,820 | 0.40 | 0.99 | $ 22.85 | $ 47,520 |
| Illinois | 3,410 | 0.57 | 1.40 | $ 22.47 | $ 46,740 |
| Tennessee | 3,410 | 1.06 | 2.61 | $ 19.51 | $ 40,570 |
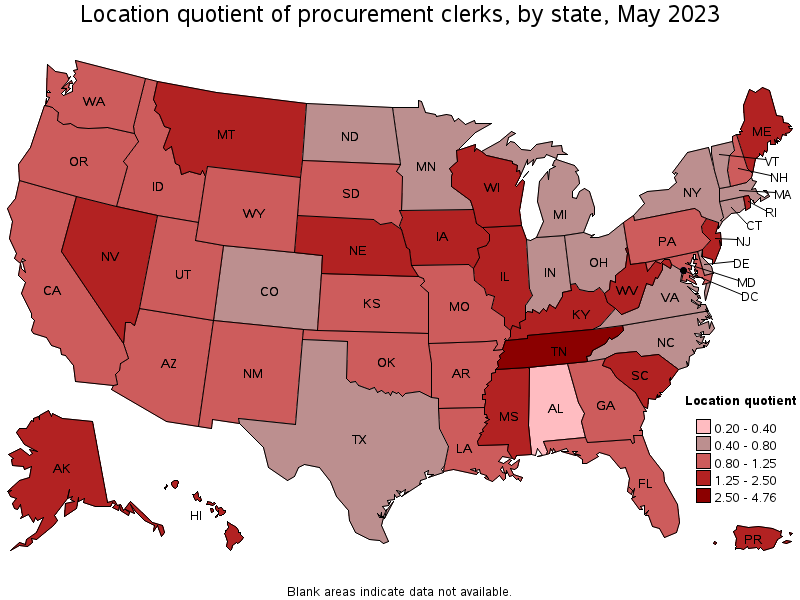
States with the highest concentration of jobs and location quotients in Procurement Clerks:
| State | Employment (1) | Employment per thousand jobs | Location quotient (9) | Hourly mean wage | Annual mean wage (2) |
|---|---|---|---|---|---|
| Tennessee | 3,410 | 1.06 | 2.61 | $ 19.51 | $ 40,570 |
| Nebraska | 950 | 0.95 | 2.35 | $ 22.00 | $ 45,760 |
| New Jersey | 3,340 | 0.79 | 1.96 | $ 24.71 | $ 51,400 |
| Alaska | 240 | 0.78 | 1.93 | $ 25.84 | $ 53,740 |
| West Virginia | 490 | 0.72 | 1.77 | $ 20.71 | $ 43,080 |
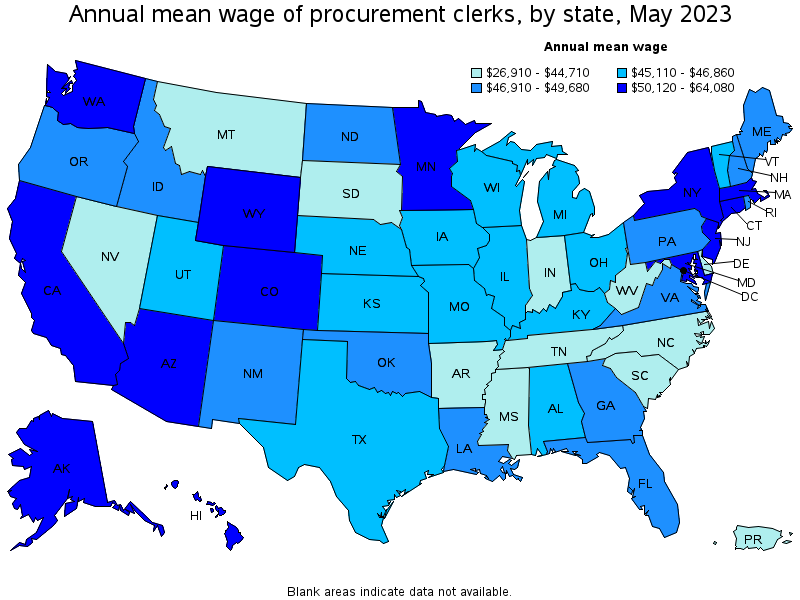
Top paying states for Procurement Clerks:
| State | Employment (1) | Employment per thousand jobs | Location quotient (9) | Hourly mean wage | Annual mean wage (2) |
|---|---|---|---|---|---|
| Massachusetts | 610 | 0.17 | 0.41 | $ 30.81 | $ 64,080 |
| District of Columbia | 220 | 0.32 | 0.78 | $ 30.61 | $ 63,680 |
| Connecticut | 520 | 0.31 | 0.77 | $ 26.08 | $ 54,250 |
| Alaska | 240 | 0.78 | 1.93 | $ 25.84 | $ 53,740 |
| California | 6,760 | 0.38 | 0.93 | $ 25.66 | $ 53,370 |
Metropolitan areas with the highest employment level in Procurement Clerks:
| Metropolitan area | Employment (1) | Employment per thousand jobs | Location quotient (9) | Hourly mean wage | Annual mean wage (2) |
|---|---|---|---|---|---|
| New York-Newark-Jersey City, NY-NJ-PA | 4,220 | 0.44 | 1.09 | $ 25.14 | $ 52,290 |
| Chicago-Naperville-Elgin, IL-IN-WI | 2,360 | 0.52 | 1.29 | $ 22.92 | $ 47,660 |
| Los Angeles-Long Beach-Anaheim, CA | 2,350 | 0.38 | 0.94 | $ 25.49 | $ 53,010 |
| Memphis, TN-MS-AR | 2,000 | 3.20 | 7.88 | $ 18.20 | $ 37,860 |
| Dallas-Fort Worth-Arlington, TX | 1,230 | 0.31 | 0.77 | $ 22.46 | $ 46,710 |
| Miami-Fort Lauderdale-West Palm Beach, FL | 1,200 | 0.44 | 1.09 | $ 24.51 | $ 50,980 |
| Philadelphia-Camden-Wilmington, PA-NJ-DE-MD | 1,160 | 0.41 | 1.01 | $ 23.44 | $ 48,760 |
| Houston-The Woodlands-Sugar Land, TX | 850 | 0.27 | 0.66 | $ 22.24 | $ 46,250 |
| Seattle-Tacoma-Bellevue, WA | 840 | 0.40 | 0.99 | $ 23.78 | $ 49,460 |
| Riverside-San Bernardino-Ontario, CA | 830 | 0.50 | 1.23 | $ 23.63 | $ 49,150 |
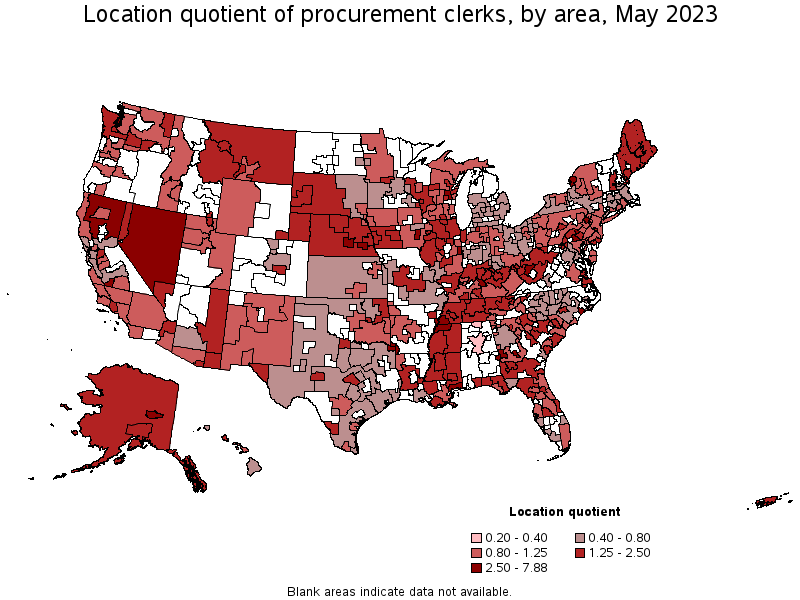
Metropolitan areas with the highest concentration of jobs and location quotients in Procurement Clerks:
| Metropolitan area | Employment (1) | Employment per thousand jobs | Location quotient (9) | Hourly mean wage | Annual mean wage (2) |
|---|---|---|---|---|---|
| Memphis, TN-MS-AR | 2,000 | 3.20 | 7.88 | $ 18.20 | $ 37,860 |
| Hanford-Corcoran, CA | 80 | 1.65 | 4.07 | $ 24.24 | $ 50,410 |
| Bremerton-Silverdale, WA | 140 | 1.51 | 3.72 | $ 27.71 | $ 57,630 |
| Elizabethtown-Fort Knox, KY | 80 | 1.50 | 3.69 | $ 22.95 | $ 47,740 |
| Warner Robins, GA | 110 | 1.48 | 3.66 | $ 25.02 | $ 52,040 |
| Iowa City, IA | 130 | 1.45 | 3.57 | $ 21.73 | $ 45,190 |
| Lebanon, PA | 70 | 1.39 | 3.43 | $ 23.17 | $ 48,200 |
| Grand Island, NE | 60 | 1.36 | 3.35 | $ 21.85 | $ 45,460 |
| Fairbanks, AK | 50 | 1.33 | 3.28 | $ 25.64 | $ 53,340 |
| Texarkana, TX-AR | 70 | 1.31 | 3.23 | $ 24.11 | $ 50,140 |
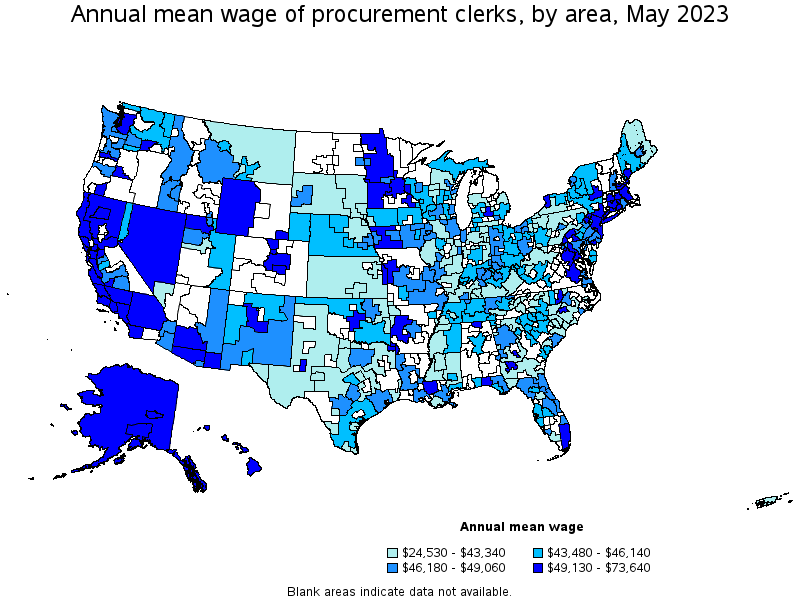
Top paying metropolitan areas for Procurement Clerks:
| Metropolitan area | Employment (1) | Employment per thousand jobs | Location quotient (9) | Hourly mean wage | Annual mean wage (2) |
|---|---|---|---|---|---|
| Kennewick-Richland, WA | 90 | 0.69 | 1.71 | $ 35.40 | $ 73,640 |
| Worcester, MA-CT | 60 | 0.20 | 0.49 | $ 31.60 | $ 65,740 |
| New Haven, CT | 100 | 0.35 | 0.87 | $ 29.40 | $ 61,140 |
| San Francisco-Oakland-Hayward, CA | 670 | 0.28 | 0.68 | $ 29.36 | $ 61,080 |
| East Stroudsburg, PA | 60 | 1.17 | 2.89 | $ 29.02 | $ 60,360 |
| San Jose-Sunnyvale-Santa Clara, CA | 290 | 0.25 | 0.62 | $ 27.99 | $ 58,220 |
| Bremerton-Silverdale, WA | 140 | 1.51 | 3.72 | $ 27.71 | $ 57,630 |
| Washington-Arlington-Alexandria, DC-VA-MD-WV | 690 | 0.22 | 0.55 | $ 27.51 | $ 57,210 |
| York-Hanover, PA | 220 | 1.20 | 2.96 | $ 27.39 | $ 56,970 |
| Boston-Cambridge-Nashua, MA-NH | 450 | 0.16 | 0.40 | $ 27.22 | $ 56,610 |
Nonmetropolitan areas with the highest employment in Procurement Clerks:
| Nonmetropolitan area | Employment (1) | Employment per thousand jobs | Location quotient (9) | Hourly mean wage | Annual mean wage (2) |
|---|---|---|---|---|---|
| Northeast Mississippi nonmetropolitan area | 170 | 0.74 | 1.82 | $ 21.30 | $ 44,300 |
| South Nebraska nonmetropolitan area | 140 | 0.94 | 2.33 | $ 21.18 | $ 44,050 |
| Central Missouri nonmetropolitan area | 120 | 0.76 | 1.87 | $ 23.20 | $ 48,250 |
| North Valley-Northern Mountains Region of California nonmetropolitan area | 110 | 1.12 | 2.76 | $ 24.56 | $ 51,080 |
| Nevada nonmetropolitan area | 110 | 1.12 | 2.77 | $ 24.69 | $ 51,350 |
Nonmetropolitan areas with the highest concentration of jobs and location quotients in Procurement Clerks:
| Nonmetropolitan area | Employment (1) | Employment per thousand jobs | Location quotient (9) | Hourly mean wage | Annual mean wage (2) |
|---|---|---|---|---|---|
| Nevada nonmetropolitan area | 110 | 1.12 | 2.77 | $ 24.69 | $ 51,350 |
| North Valley-Northern Mountains Region of California nonmetropolitan area | 110 | 1.12 | 2.76 | $ 24.56 | $ 51,080 |
| Northeast Nebraska nonmetropolitan area | 90 | 0.96 | 2.36 | $ 19.34 | $ 40,230 |
| South Nebraska nonmetropolitan area | 140 | 0.94 | 2.33 | $ 21.18 | $ 44,050 |
| East-Central Montana nonmetropolitan area | 60 | 0.91 | 2.24 | $ 20.73 | $ 43,120 |
Top paying nonmetropolitan areas for Procurement Clerks:
| Nonmetropolitan area | Employment (1) | Employment per thousand jobs | Location quotient (9) | Hourly mean wage | Annual mean wage (2) |
|---|---|---|---|---|---|
| Western Wyoming nonmetropolitan area | 40 | 0.39 | 0.97 | $ 27.18 | $ 56,530 |
| Alaska nonmetropolitan area | 80 | 0.73 | 1.80 | $ 26.30 | $ 54,700 |
| Hawaii / Kauai nonmetropolitan area | 30 | 0.31 | 0.75 | $ 25.06 | $ 52,120 |
| Southwest Minnesota nonmetropolitan area | 40 | 0.31 | 0.77 | $ 24.95 | $ 51,900 |
| Nevada nonmetropolitan area | 110 | 1.12 | 2.77 | $ 24.69 | $ 51,350 |
These estimates are calculated with data collected from employers in all industry sectors, all metropolitan and nonmetropolitan areas, and all states and the District of Columbia. The top employment and wage figures are provided above. The complete list is available in the downloadable XLS files.
The percentile wage estimate is the value of a wage below which a certain percent of workers fall. The median wage is the 50th percentile wage estimate—50 percent of workers earn less than the median and 50 percent of workers earn more than the median. More about percentile wages.
(1) Estimates for detailed occupations do not sum to the totals because the totals include occupations not shown separately. Estimates do not include self-employed workers.
(2) Annual wages have been calculated by multiplying the hourly mean wage by a "year-round, full-time" hours figure of 2,080 hours; for those occupations where there is not an hourly wage published, the annual wage has been directly calculated from the reported survey data.
(3) The relative standard error (RSE) is a measure of the reliability of a survey statistic. The smaller the relative standard error, the more precise the estimate.
(9) The location quotient is the ratio of the area concentration of occupational employment to the national average concentration. A location quotient greater than one indicates the occupation has a higher share of employment than average, and a location quotient less than one indicates the occupation is less prevalent in the area than average.
Other OEWS estimates and related information:
May 2023 National Occupational Employment and Wage Estimates
May 2023 State Occupational Employment and Wage Estimates
May 2023 Metropolitan and Nonmetropolitan Area Occupational Employment and Wage Estimates
May 2023 National Industry-Specific Occupational Employment and Wage Estimates
Last Modified Date: April 3, 2024