
An official website of the United States government
An official website of the United States government
The .gov means it's official.
Federal government websites often end in .gov or .mil. Before sharing sensitive information,
make sure you're on a federal government site.
The site is secure.
The
https:// ensures that you are connecting to the official website and that any
information you provide is encrypted and transmitted securely.
Interact with customers to provide basic or scripted information in response to routine inquiries about products and services. May handle and resolve general complaints. Excludes individuals whose duties are primarily installation, sales, repair, and technical support.
Employment estimate and mean wage estimates for Customer Service Representatives:
| Employment (1) | Employment RSE (3) |
Mean hourly wage |
Mean annual wage (2) |
Wage RSE (3) |
|---|---|---|---|---|
| 2,858,710 | 0.5 % | $ 20.92 | $ 43,520 | 0.1 % |
Percentile wage estimates for Customer Service Representatives:
| Percentile | 10% | 25% | 50% (Median) |
75% | 90% |
|---|---|---|---|---|---|
| Hourly Wage | $ 14.21 | $ 16.72 | $ 19.08 | $ 23.31 | $ 29.45 |
| Annual Wage (2) | $ 29,560 | $ 34,780 | $ 39,680 | $ 48,480 | $ 61,250 |
Industries with the highest published employment and wages for Customer Service Representatives are provided. For a list of all industries with employment in Customer Service Representatives, see the Create Customized Tables function.
Industries with the highest levels of employment in Customer Service Representatives:
| Industry | Employment (1) | Percent of industry employment | Hourly mean wage | Annual mean wage (2) |
|---|---|---|---|---|
| Business Support Services | 269,120 | 35.85 | $ 17.99 | $ 37,410 |
| General Merchandise Retailers | 188,580 | 5.87 | $ 17.70 | $ 36,810 |
| Agencies, Brokerages, and Other Insurance Related Activities | 154,890 | 11.66 | $ 22.35 | $ 46,490 |
| Credit Intermediation and Related Activities (5221 and 5223 only) | 134,890 | 6.61 | $ 22.52 | $ 46,830 |
| Insurance Carriers | 130,000 | 10.63 | $ 23.15 | $ 48,150 |
Industries with the highest concentration of employment in Customer Service Representatives:
| Industry | Employment (1) | Percent of industry employment | Hourly mean wage | Annual mean wage (2) |
|---|---|---|---|---|
| Business Support Services | 269,120 | 35.85 | $ 17.99 | $ 37,410 |
| Deep Sea, Coastal, and Great Lakes Water Transportation | 5,720 | 14.57 | $ 16.71 | $ 34,750 |
| Agencies, Brokerages, and Other Insurance Related Activities | 154,890 | 11.66 | $ 22.35 | $ 46,490 |
| Insurance Carriers | 130,000 | 10.63 | $ 23.15 | $ 48,150 |
| Insurance and Employee Benefit Funds | 970 | 8.44 | $ 24.42 | $ 50,790 |
Top paying industries for Customer Service Representatives:
| Industry | Employment (1) | Percent of industry employment | Hourly mean wage | Annual mean wage (2) |
|---|---|---|---|---|
| Support Activities for Water Transportation | 1,540 | 1.62 | $ 45.57 | $ 94,790 |
| Aerospace Product and Parts Manufacturing | 1,550 | 0.30 | $ 33.95 | $ 70,620 |
| Iron and Steel Mills and Ferroalloy Manufacturing | 120 | 0.14 | $ 33.19 | $ 69,030 |
| Motor Vehicle Manufacturing | 480 | 0.17 | $ 32.37 | $ 67,320 |
| Railroad Rolling Stock Manufacturing | 110 | 0.50 | $ 32.27 | $ 67,120 |
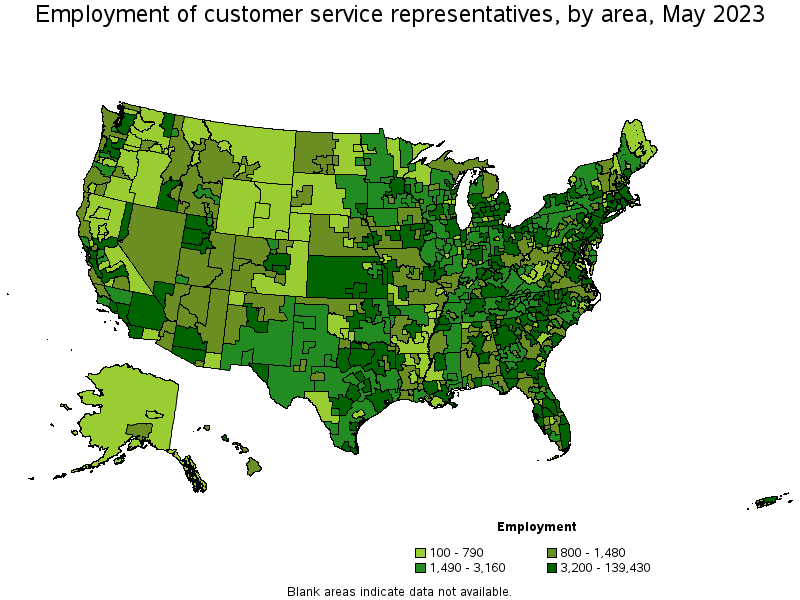
States and areas with the highest published employment, location quotients, and wages for Customer Service Representatives are provided. For a list of all areas with employment in Customer Service Representatives, see the Create Customized Tables function.
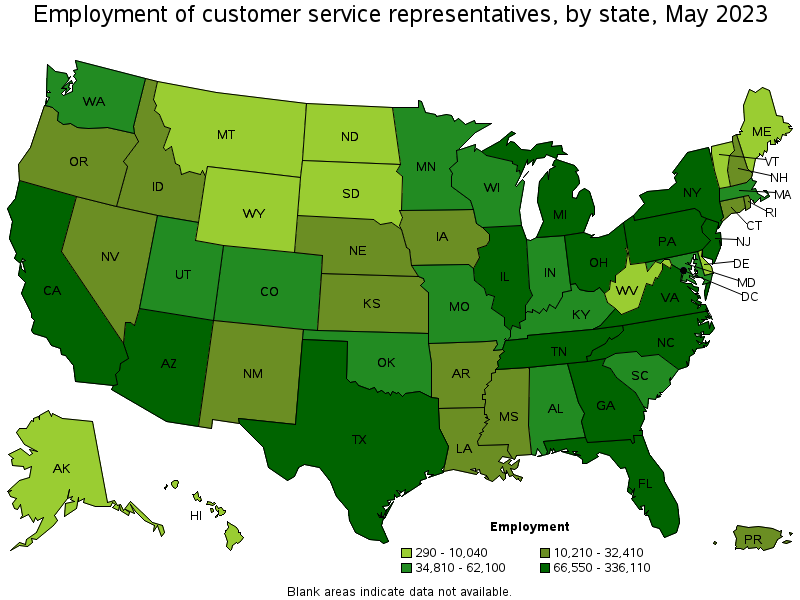
States with the highest employment level in Customer Service Representatives:
| State | Employment (1) | Employment per thousand jobs | Location quotient (9) | Hourly mean wage | Annual mean wage (2) |
|---|---|---|---|---|---|
| Texas | 336,110 | 24.79 | 1.32 | $ 19.53 | $ 40,630 |
| Florida | 239,440 | 25.02 | 1.33 | $ 19.64 | $ 40,850 |
| California | 196,960 | 10.97 | 0.58 | $ 24.02 | $ 49,950 |
| New York | 149,580 | 15.93 | 0.85 | $ 24.09 | $ 50,100 |
| Georgia | 122,240 | 25.69 | 1.36 | $ 19.26 | $ 40,070 |
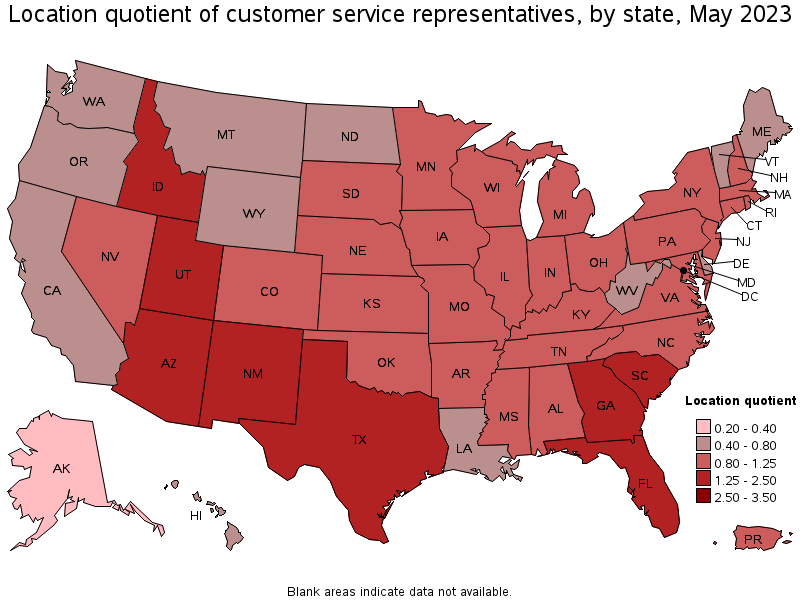
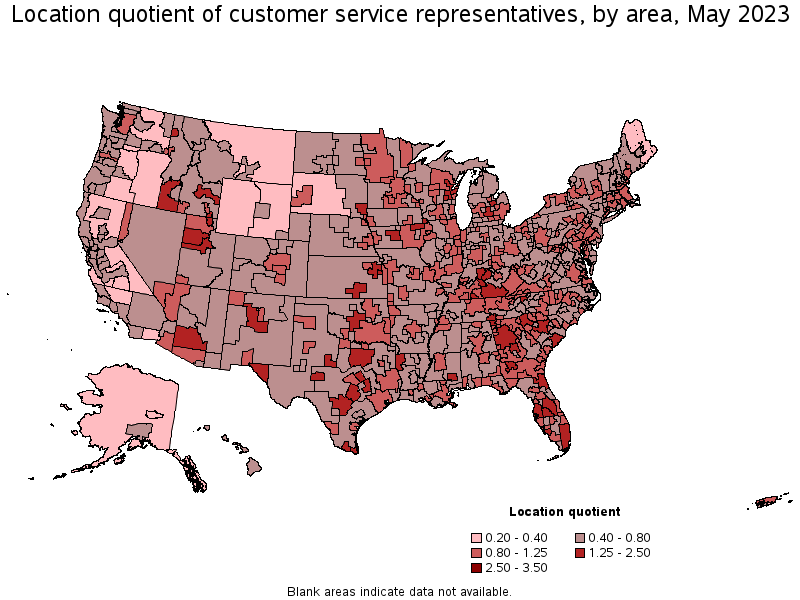
States with the highest concentration of jobs and location quotients in Customer Service Representatives:
| State | Employment (1) | Employment per thousand jobs | Location quotient (9) | Hourly mean wage | Annual mean wage (2) |
|---|---|---|---|---|---|
| Utah | 56,470 | 33.64 | 1.79 | $ 20.15 | $ 41,910 |
| Arizona | 95,930 | 30.65 | 1.63 | $ 20.92 | $ 43,500 |
| Georgia | 122,240 | 25.69 | 1.36 | $ 19.26 | $ 40,070 |
| South Carolina | 56,350 | 25.35 | 1.35 | $ 18.47 | $ 38,420 |
| Florida | 239,440 | 25.02 | 1.33 | $ 19.64 | $ 40,850 |
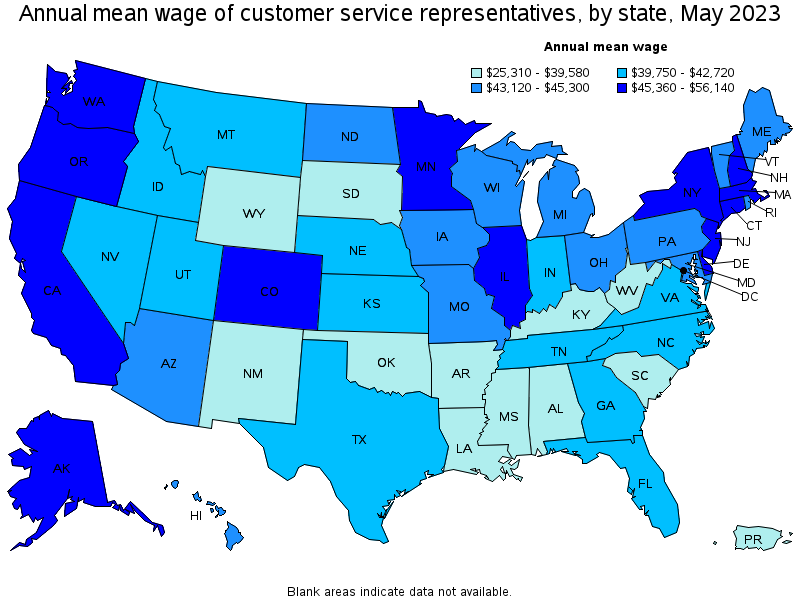
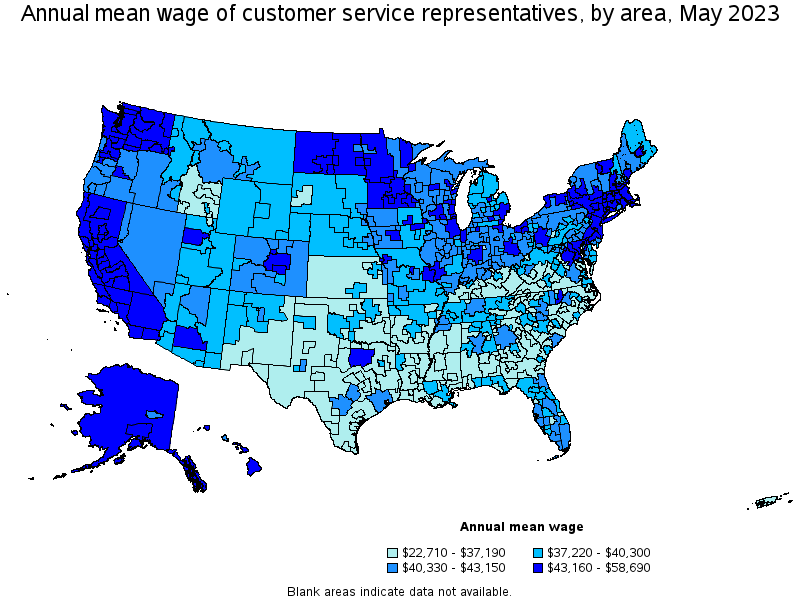
Top paying states for Customer Service Representatives:
| State | Employment (1) | Employment per thousand jobs | Location quotient (9) | Hourly mean wage | Annual mean wage (2) |
|---|---|---|---|---|---|
| District of Columbia | 5,680 | 8.09 | 0.43 | $ 26.99 | $ 56,140 |
| Washington | 49,130 | 14.06 | 0.75 | $ 25.33 | $ 52,690 |
| Massachusetts | 62,100 | 17.04 | 0.91 | $ 24.25 | $ 50,450 |
| New York | 149,580 | 15.93 | 0.85 | $ 24.09 | $ 50,100 |
| California | 196,960 | 10.97 | 0.58 | $ 24.02 | $ 49,950 |
Metropolitan areas with the highest employment level in Customer Service Representatives:
| Metropolitan area | Employment (1) | Employment per thousand jobs | Location quotient (9) | Hourly mean wage | Annual mean wage (2) |
|---|---|---|---|---|---|
| New York-Newark-Jersey City, NY-NJ-PA | 139,430 | 14.68 | 0.78 | $ 24.62 | $ 51,200 |
| Dallas-Fort Worth-Arlington, TX | 107,440 | 27.09 | 1.44 | $ 20.75 | $ 43,160 |
| Chicago-Naperville-Elgin, IL-IN-WI | 81,570 | 18.10 | 0.96 | $ 22.46 | $ 46,710 |
| Phoenix-Mesa-Scottsdale, AZ | 77,280 | 33.76 | 1.79 | $ 21.34 | $ 44,400 |
| Atlanta-Sandy Springs-Roswell, GA | 76,590 | 27.18 | 1.44 | $ 20.41 | $ 42,460 |
| Los Angeles-Long Beach-Anaheim, CA | 73,880 | 11.94 | 0.63 | $ 23.63 | $ 49,140 |
| Houston-The Woodlands-Sugar Land, TX | 68,190 | 21.45 | 1.14 | $ 19.46 | $ 40,480 |
| Miami-Fort Lauderdale-West Palm Beach, FL | 67,420 | 24.77 | 1.32 | $ 19.80 | $ 41,190 |
| Philadelphia-Camden-Wilmington, PA-NJ-DE-MD | 49,750 | 17.58 | 0.93 | $ 22.70 | $ 47,220 |
| Boston-Cambridge-Nashua, MA-NH | 48,840 | 17.68 | 0.94 | $ 24.72 | $ 51,420 |
Metropolitan areas with the highest concentration of jobs and location quotients in Customer Service Representatives:
| Metropolitan area | Employment (1) | Employment per thousand jobs | Location quotient (9) | Hourly mean wage | Annual mean wage (2) |
|---|---|---|---|---|---|
| Salt Lake City, UT | 34,170 | 42.51 | 2.26 | $ 21.05 | $ 43,780 |
| Albany, GA | 2,450 | 40.96 | 2.18 | $ 15.97 | $ 33,230 |
| Lawrence, KS | 1,900 | 38.14 | 2.03 | $ 16.28 | $ 33,860 |
| Provo-Orem, UT | 10,860 | 37.03 | 1.97 | $ 19.08 | $ 39,690 |
| Johnson City, TN | 2,890 | 35.45 | 1.88 | $ 17.77 | $ 36,960 |
| Abilene, TX | 2,540 | 34.87 | 1.85 | $ 17.63 | $ 36,670 |
| Phoenix-Mesa-Scottsdale, AZ | 77,280 | 33.76 | 1.79 | $ 21.34 | $ 44,400 |
| Dubuque, IA | 1,880 | 32.13 | 1.71 | $ 22.36 | $ 46,500 |
| El Paso, TX | 10,120 | 31.29 | 1.66 | $ 16.63 | $ 34,590 |
| San Antonio-New Braunfels, TX | 33,890 | 31.05 | 1.65 | $ 19.82 | $ 41,220 |
Top paying metropolitan areas for Customer Service Representatives:
| Metropolitan area | Employment (1) | Employment per thousand jobs | Location quotient (9) | Hourly mean wage | Annual mean wage (2) |
|---|---|---|---|---|---|
| San Jose-Sunnyvale-Santa Clara, CA | 9,140 | 8.01 | 0.43 | $ 28.22 | $ 58,690 |
| San Francisco-Oakland-Hayward, CA | 23,030 | 9.51 | 0.51 | $ 27.49 | $ 57,180 |
| Seattle-Tacoma-Bellevue, WA | 33,220 | 15.98 | 0.85 | $ 26.87 | $ 55,900 |
| Midland, MI | 650 | 18.00 | 0.96 | $ 25.78 | $ 53,610 |
| Stockton-Lodi, CA | 2,760 | 9.93 | 0.53 | $ 25.38 | $ 52,800 |
| Bridgeport-Stamford-Norwalk, CT | 7,600 | 18.93 | 1.01 | $ 25.11 | $ 52,240 |
| Boston-Cambridge-Nashua, MA-NH | 48,840 | 17.68 | 0.94 | $ 24.72 | $ 51,420 |
| New York-Newark-Jersey City, NY-NJ-PA | 139,430 | 14.68 | 0.78 | $ 24.62 | $ 51,200 |
| Napa, CA | 640 | 8.18 | 0.43 | $ 24.36 | $ 50,670 |
| Santa Rosa, CA | 2,260 | 10.94 | 0.58 | $ 24.17 | $ 50,270 |
Nonmetropolitan areas with the highest employment in Customer Service Representatives:
| Nonmetropolitan area | Employment (1) | Employment per thousand jobs | Location quotient (9) | Hourly mean wage | Annual mean wage (2) |
|---|---|---|---|---|---|
| Kansas nonmetropolitan area | 4,900 | 12.60 | 0.67 | $ 17.86 | $ 37,150 |
| South Central Kentucky nonmetropolitan area | 4,160 | 24.36 | 1.29 | $ 15.72 | $ 32,700 |
| North Georgia nonmetropolitan area | 4,070 | 21.19 | 1.13 | $ 17.02 | $ 35,410 |
| North Northeastern Ohio nonmetropolitan area (noncontiguous) | 3,720 | 11.44 | 0.61 | $ 19.65 | $ 40,880 |
| Balance of Lower Peninsula of Michigan nonmetropolitan area | 3,590 | 13.66 | 0.73 | $ 19.31 | $ 40,150 |
Nonmetropolitan areas with the highest concentration of jobs and location quotients in Customer Service Representatives:
| Nonmetropolitan area | Employment (1) | Employment per thousand jobs | Location quotient (9) | Hourly mean wage | Annual mean wage (2) |
|---|---|---|---|---|---|
| South Central Kentucky nonmetropolitan area | 4,160 | 24.36 | 1.29 | $ 15.72 | $ 32,700 |
| East Kentucky nonmetropolitan area | 2,140 | 21.21 | 1.13 | $ 16.73 | $ 34,800 |
| North Georgia nonmetropolitan area | 4,070 | 21.19 | 1.13 | $ 17.02 | $ 35,410 |
| Southwest Virginia nonmetropolitan area | 2,360 | 20.13 | 1.07 | $ 17.13 | $ 35,630 |
| Southwest Louisiana nonmetropolitan area | 1,270 | 19.06 | 1.01 | $ 17.50 | $ 36,400 |
Top paying nonmetropolitan areas for Customer Service Representatives:
| Nonmetropolitan area | Employment (1) | Employment per thousand jobs | Location quotient (9) | Hourly mean wage | Annual mean wage (2) |
|---|---|---|---|---|---|
| Massachusetts nonmetropolitan area | 730 | 11.69 | 0.62 | $ 23.23 | $ 48,310 |
| Eastern Sierra-Mother Lode Region of California nonmetropolitan area | 300 | 4.93 | 0.26 | $ 23.07 | $ 47,990 |
| Alaska nonmetropolitan area | 450 | 4.34 | 0.23 | $ 23.04 | $ 47,930 |
| North Valley-Northern Mountains Region of California nonmetropolitan area | 600 | 5.88 | 0.31 | $ 22.88 | $ 47,590 |
| East North Dakota nonmetropolitan area | 560 | 9.05 | 0.48 | $ 22.43 | $ 46,650 |
These estimates are calculated with data collected from employers in all industry sectors, all metropolitan and nonmetropolitan areas, and all states and the District of Columbia. The top employment and wage figures are provided above. The complete list is available in the downloadable XLS files.
The percentile wage estimate is the value of a wage below which a certain percent of workers fall. The median wage is the 50th percentile wage estimate—50 percent of workers earn less than the median and 50 percent of workers earn more than the median. More about percentile wages.
(1) Estimates for detailed occupations do not sum to the totals because the totals include occupations not shown separately. Estimates do not include self-employed workers.
(2) Annual wages have been calculated by multiplying the hourly mean wage by a "year-round, full-time" hours figure of 2,080 hours; for those occupations where there is not an hourly wage published, the annual wage has been directly calculated from the reported survey data.
(3) The relative standard error (RSE) is a measure of the reliability of a survey statistic. The smaller the relative standard error, the more precise the estimate.
(9) The location quotient is the ratio of the area concentration of occupational employment to the national average concentration. A location quotient greater than one indicates the occupation has a higher share of employment than average, and a location quotient less than one indicates the occupation is less prevalent in the area than average.
Other OEWS estimates and related information:
May 2023 National Occupational Employment and Wage Estimates
May 2023 State Occupational Employment and Wage Estimates
May 2023 Metropolitan and Nonmetropolitan Area Occupational Employment and Wage Estimates
May 2023 National Industry-Specific Occupational Employment and Wage Estimates
Last Modified Date: April 3, 2024