
An official website of the United States government
An official website of the United States government
The .gov means it's official.
Federal government websites often end in .gov or .mil. Before sharing sensitive information,
make sure you're on a federal government site.
The site is secure.
The
https:// ensures that you are connecting to the official website and that any
information you provide is encrypted and transmitted securely.
Operate computer-controlled tools, machines, or robots to machine or process parts, tools, or other work pieces made of metal, plastic, wood, stone, or other materials. May also set up and maintain equipment.
Employment estimate and mean wage estimates for Computer Numerically Controlled Tool Operators:
| Employment (1) | Employment RSE (3) |
Mean hourly wage |
Mean annual wage (2) |
Wage RSE (3) |
|---|---|---|---|---|
| 187,670 | 1.5 % | $ 24.54 | $ 51,030 | 0.3 % |
Percentile wage estimates for Computer Numerically Controlled Tool Operators:
| Percentile | 10% | 25% | 50% (Median) |
75% | 90% |
|---|---|---|---|---|---|
| Hourly Wage | $ 17.49 | $ 19.42 | $ 23.34 | $ 28.67 | $ 32.20 |
| Annual Wage (2) | $ 36,380 | $ 40,390 | $ 48,550 | $ 59,630 | $ 66,970 |
Industries with the highest published employment and wages for Computer Numerically Controlled Tool Operators are provided. For a list of all industries with employment in Computer Numerically Controlled Tool Operators, see the Create Customized Tables function.
Industries with the highest levels of employment in Computer Numerically Controlled Tool Operators:
| Industry | Employment (1) | Percent of industry employment | Hourly mean wage | Annual mean wage (2) |
|---|---|---|---|---|
| Machine Shops; Turned Product; and Screw, Nut, and Bolt Manufacturing | 40,520 | 11.90 | $ 24.25 | $ 50,440 |
| Machinery Manufacturing (3331, 3332, 3334, and 3339 only) | 20,170 | 2.59 | $ 25.41 | $ 52,840 |
| Fabricated Metal Product Manufacturing (3321, 3322, 3325, 3326, and 3329 only) | 16,260 | 3.46 | $ 24.11 | $ 50,160 |
| Metalworking Machinery Manufacturing | 14,620 | 9.01 | $ 24.86 | $ 51,700 |
| Aerospace Product and Parts Manufacturing | 13,410 | 2.63 | $ 29.35 | $ 61,040 |
Industries with the highest concentration of employment in Computer Numerically Controlled Tool Operators:
| Industry | Employment (1) | Percent of industry employment | Hourly mean wage | Annual mean wage (2) |
|---|---|---|---|---|
| Machine Shops; Turned Product; and Screw, Nut, and Bolt Manufacturing | 40,520 | 11.90 | $ 24.25 | $ 50,440 |
| Metalworking Machinery Manufacturing | 14,620 | 9.01 | $ 24.86 | $ 51,700 |
| Engine, Turbine, and Power Transmission Equipment Manufacturing | 4,300 | 4.65 | $ 27.13 | $ 56,430 |
| Fabricated Metal Product Manufacturing (3321, 3322, 3325, 3326, and 3329 only) | 16,260 | 3.46 | $ 24.11 | $ 50,160 |
| Foundries | 3,580 | 3.33 | $ 22.33 | $ 46,440 |
Top paying industries for Computer Numerically Controlled Tool Operators:
| Industry | Employment (1) | Percent of industry employment | Hourly mean wage | Annual mean wage (2) |
|---|---|---|---|---|
| Advertising, Public Relations, and Related Services | 40 | 0.01 | $ 33.99 | $ 70,690 |
| Iron and Steel Mills and Ferroalloy Manufacturing | (8) | (8) | $ 33.92 | $ 70,550 |
| Furniture and Home Furnishings Retailers | 30 | 0.01 | $ 33.44 | $ 69,540 |
| Colleges, Universities, and Professional Schools | 30 | (7) | $ 32.23 | $ 67,040 |
| Pulp, Paper, and Paperboard Mills | 120 | 0.14 | $ 30.39 | $ 63,200 |
States and areas with the highest published employment, location quotients, and wages for Computer Numerically Controlled Tool Operators are provided. For a list of all areas with employment in Computer Numerically Controlled Tool Operators, see the Create Customized Tables function.
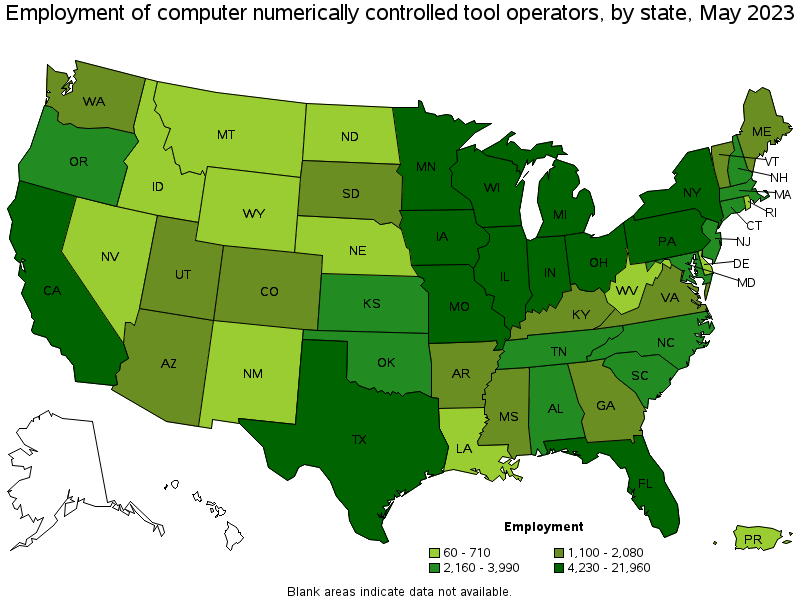
States with the highest employment level in Computer Numerically Controlled Tool Operators:
| State | Employment (1) | Employment per thousand jobs | Location quotient (9) | Hourly mean wage | Annual mean wage (2) |
|---|---|---|---|---|---|
| Ohio | 21,960 | 4.01 | 3.25 | $ 23.52 | $ 48,920 |
| California | 17,800 | 0.99 | 0.80 | $ 25.55 | $ 53,140 |
| Wisconsin | 15,500 | 5.37 | 4.35 | $ 26.12 | $ 54,320 |
| Texas | 13,480 | 0.99 | 0.80 | $ 23.48 | $ 48,830 |
| Pennsylvania | 11,910 | 2.00 | 1.62 | $ 25.92 | $ 53,920 |
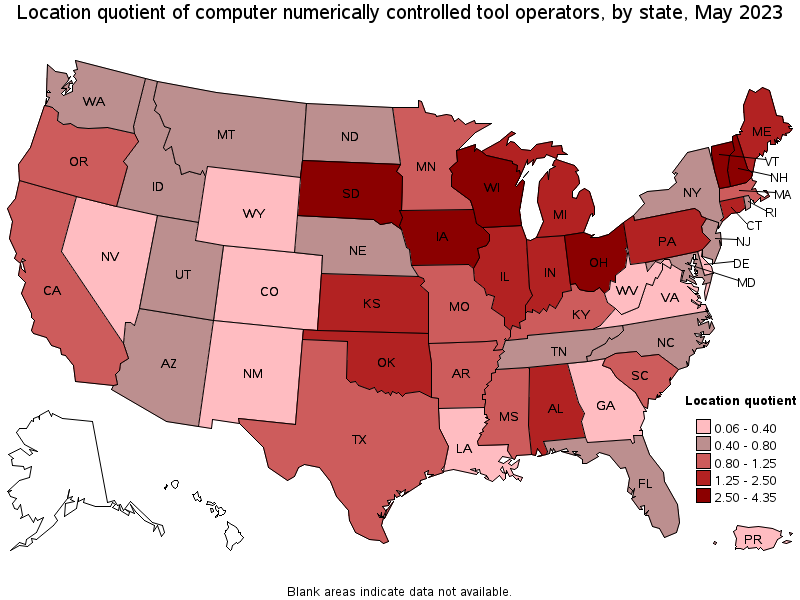
States with the highest concentration of jobs and location quotients in Computer Numerically Controlled Tool Operators:
| State | Employment (1) | Employment per thousand jobs | Location quotient (9) | Hourly mean wage | Annual mean wage (2) |
|---|---|---|---|---|---|
| Wisconsin | 15,500 | 5.37 | 4.35 | $ 26.12 | $ 54,320 |
| Vermont | 1,220 | 4.04 | 3.27 | $ 28.06 | $ 58,370 |
| Ohio | 21,960 | 4.01 | 3.25 | $ 23.52 | $ 48,920 |
| Iowa | 5,790 | 3.75 | 3.03 | $ 24.02 | $ 49,960 |
| New Hampshire | 2,230 | 3.31 | 2.68 | $ 25.43 | $ 52,890 |
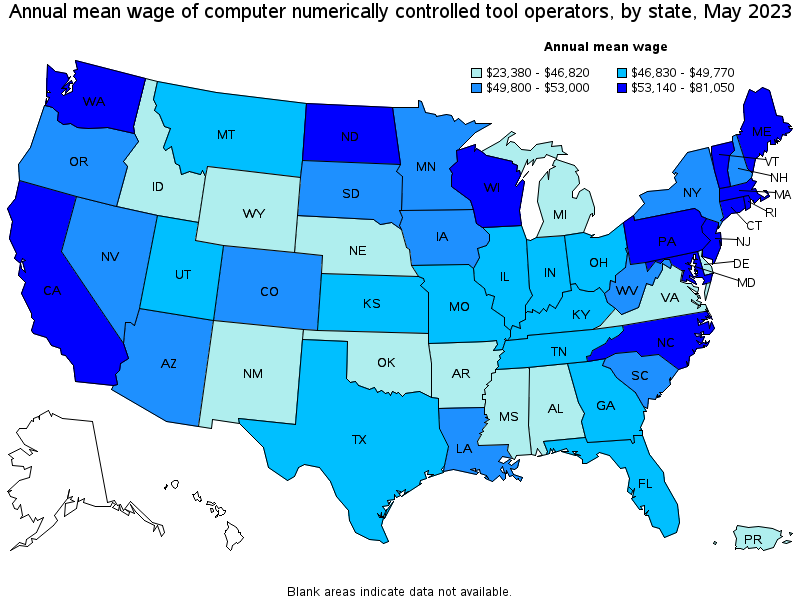
Top paying states for Computer Numerically Controlled Tool Operators:
| State | Employment (1) | Employment per thousand jobs | Location quotient (9) | Hourly mean wage | Annual mean wage (2) |
|---|---|---|---|---|---|
| Washington | 1,760 | 0.50 | 0.41 | $ 38.96 | $ 81,050 |
| Vermont | 1,220 | 4.04 | 3.27 | $ 28.06 | $ 58,370 |
| Massachusetts | 3,840 | 1.05 | 0.85 | $ 27.74 | $ 57,710 |
| Maine | 1,100 | 1.76 | 1.43 | $ 27.52 | $ 57,240 |
| Connecticut | 3,950 | 2.38 | 1.93 | $ 27.26 | $ 56,710 |
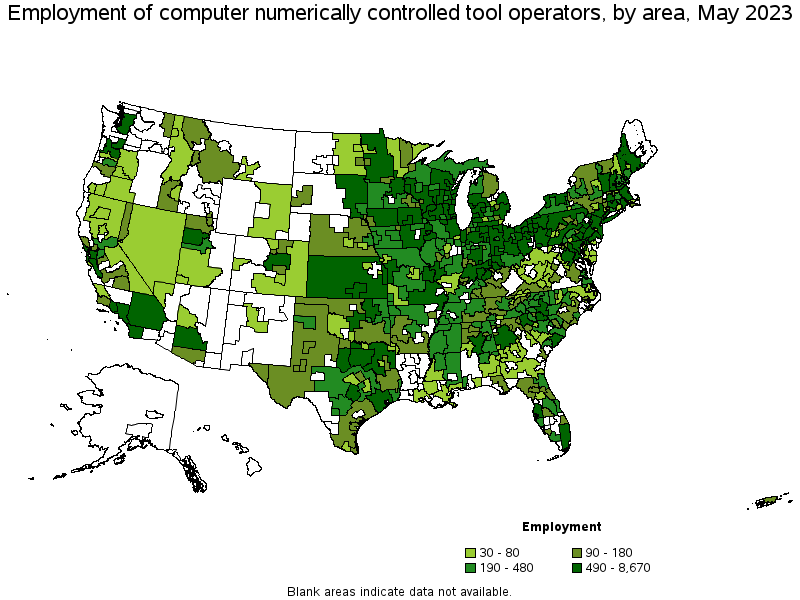
Metropolitan areas with the highest employment level in Computer Numerically Controlled Tool Operators:
| Metropolitan area | Employment (1) | Employment per thousand jobs | Location quotient (9) | Hourly mean wage | Annual mean wage (2) |
|---|---|---|---|---|---|
| Los Angeles-Long Beach-Anaheim, CA | 8,670 | 1.40 | 1.13 | $ 25.02 | $ 52,050 |
| Chicago-Naperville-Elgin, IL-IN-WI | 6,590 | 1.46 | 1.18 | $ 24.43 | $ 50,810 |
| Houston-The Woodlands-Sugar Land, TX | 5,020 | 1.58 | 1.28 | $ 24.84 | $ 51,660 |
| Milwaukee-Waukesha-West Allis, WI | 4,950 | 6.07 | 4.91 | $ 26.89 | $ 55,940 |
| Cleveland-Elyria, OH | 4,550 | 4.55 | 3.68 | $ 24.06 | $ 50,030 |
| Dallas-Fort Worth-Arlington, TX | 3,470 | 0.87 | 0.71 | $ 22.94 | $ 47,710 |
| New York-Newark-Jersey City, NY-NJ-PA | 3,260 | 0.34 | 0.28 | $ 27.12 | $ 56,410 |
| Detroit-Warren-Dearborn, MI | 3,050 | 1.60 | 1.30 | $ 24.17 | $ 50,270 |
| Boston-Cambridge-Nashua, MA-NH | 2,830 | 1.02 | 0.83 | $ 27.96 | $ 58,150 |
| Minneapolis-St. Paul-Bloomington, MN-WI | 2,800 | 1.47 | 1.19 | $ 26.14 | $ 54,360 |
Metropolitan areas with the highest concentration of jobs and location quotients in Computer Numerically Controlled Tool Operators:
| Metropolitan area | Employment (1) | Employment per thousand jobs | Location quotient (9) | Hourly mean wage | Annual mean wage (2) |
|---|---|---|---|---|---|
| Columbus, IN | 1,030 | 20.43 | 16.53 | $ 27.19 | $ 56,550 |
| Fond du Lac, WI | 590 | 12.99 | 10.51 | $ 25.82 | $ 53,710 |
| Muskegon, MI | 780 | 12.60 | 10.19 | $ 21.80 | $ 45,340 |
| Sheboygan, WI | 660 | 11.01 | 8.91 | $ 24.77 | $ 51,530 |
| Rockford, IL | 1,390 | 10.02 | 8.11 | $ 22.30 | $ 46,380 |
| Racine, WI | 730 | 9.73 | 7.87 | $ 25.30 | $ 52,630 |
| Waterloo-Cedar Falls, IA | 590 | 6.86 | 5.55 | $ 25.54 | $ 53,130 |
| Mansfield, OH | 310 | 6.56 | 5.31 | $ 22.93 | $ 47,690 |
| Dubuque, IA | 380 | 6.41 | 5.19 | $ 23.23 | $ 48,320 |
| Dayton, OH | 2,260 | 6.14 | 4.97 | $ 24.17 | $ 50,280 |
Top paying metropolitan areas for Computer Numerically Controlled Tool Operators:
| Metropolitan area | Employment (1) | Employment per thousand jobs | Location quotient (9) | Hourly mean wage | Annual mean wage (2) |
|---|---|---|---|---|---|
| Seattle-Tacoma-Bellevue, WA | 1,480 | 0.71 | 0.57 | $ 41.53 | $ 86,390 |
| Wilmington, NC | 480 | 3.37 | 2.73 | $ 36.60 | $ 76,120 |
| Savannah, GA | 110 | 0.59 | 0.48 | $ 30.32 | $ 63,060 |
| Manchester, NH | 190 | 1.71 | 1.39 | $ 29.78 | $ 61,930 |
| Bridgeport-Stamford-Norwalk, CT | 510 | 1.27 | 1.03 | $ 29.24 | $ 60,830 |
| Glens Falls, NY | 50 | 1.04 | 0.84 | $ 29.14 | $ 60,600 |
| Winston-Salem, NC | 320 | 1.19 | 0.96 | $ 29.12 | $ 60,560 |
| New Bedford, MA | 50 | 0.73 | 0.59 | $ 29.05 | $ 60,420 |
| Portsmouth, NH-ME | 270 | 2.92 | 2.36 | $ 28.94 | $ 60,200 |
| Grand Forks, ND-MN | 60 | 1.10 | 0.89 | $ 28.79 | $ 59,890 |
Nonmetropolitan areas with the highest employment in Computer Numerically Controlled Tool Operators:
| Nonmetropolitan area | Employment (1) | Employment per thousand jobs | Location quotient (9) | Hourly mean wage | Annual mean wage (2) |
|---|---|---|---|---|---|
| North Northeastern Ohio nonmetropolitan area (noncontiguous) | 3,270 | 10.07 | 8.15 | $ 22.68 | $ 47,160 |
| West Northwestern Ohio nonmetropolitan area | 2,740 | 11.02 | 8.92 | $ 23.39 | $ 48,650 |
| South Central Wisconsin nonmetropolitan area | 1,560 | 7.56 | 6.12 | $ 25.47 | $ 52,970 |
| Northeastern Wisconsin nonmetropolitan area | 1,390 | 7.10 | 5.75 | $ 24.96 | $ 51,910 |
| Northern Indiana nonmetropolitan area | 1,230 | 5.78 | 4.67 | $ 22.71 | $ 47,240 |
Nonmetropolitan areas with the highest concentration of jobs and location quotients in Computer Numerically Controlled Tool Operators:
| Nonmetropolitan area | Employment (1) | Employment per thousand jobs | Location quotient (9) | Hourly mean wage | Annual mean wage (2) |
|---|---|---|---|---|---|
| West Northwestern Ohio nonmetropolitan area | 2,740 | 11.02 | 8.92 | $ 23.39 | $ 48,650 |
| Northeast Iowa nonmetropolitan area | 1,060 | 10.84 | 8.77 | $ 24.91 | $ 51,810 |
| North Northeastern Ohio nonmetropolitan area (noncontiguous) | 3,270 | 10.07 | 8.15 | $ 22.68 | $ 47,160 |
| South Central Wisconsin nonmetropolitan area | 1,560 | 7.56 | 6.12 | $ 25.47 | $ 52,970 |
| Southern Vermont nonmetropolitan area | 760 | 7.50 | 6.07 | (8) | (8) |
Top paying nonmetropolitan areas for Computer Numerically Controlled Tool Operators:
| Nonmetropolitan area | Employment (1) | Employment per thousand jobs | Location quotient (9) | Hourly mean wage | Annual mean wage (2) |
|---|---|---|---|---|---|
| Southern Pennsylvania nonmetropolitan area | 620 | 3.30 | 2.67 | $ 27.66 | $ 57,530 |
| Southwest Maine nonmetropolitan area | 750 | 3.94 | 3.19 | $ 27.58 | $ 57,370 |
| Capital/Northern New York nonmetropolitan area | 90 | 0.62 | 0.50 | $ 27.05 | $ 56,260 |
| Northeast Minnesota nonmetropolitan area | 40 | 0.99 | 0.80 | $ 26.20 | $ 54,500 |
| West Central Illinois nonmetropolitan area | 230 | 1.39 | 1.13 | $ 26.13 | $ 54,340 |
These estimates are calculated with data collected from employers in all industry sectors, all metropolitan and nonmetropolitan areas, and all states and the District of Columbia. The top employment and wage figures are provided above. The complete list is available in the downloadable XLS files.
The percentile wage estimate is the value of a wage below which a certain percent of workers fall. The median wage is the 50th percentile wage estimate—50 percent of workers earn less than the median and 50 percent of workers earn more than the median. More about percentile wages.
(1) Estimates for detailed occupations do not sum to the totals because the totals include occupations not shown separately. Estimates do not include self-employed workers.
(2) Annual wages have been calculated by multiplying the hourly mean wage by a "year-round, full-time" hours figure of 2,080 hours; for those occupations where there is not an hourly wage published, the annual wage has been directly calculated from the reported survey data.
(3) The relative standard error (RSE) is a measure of the reliability of a survey statistic. The smaller the relative standard error, the more precise the estimate.
(7) The value is less than .005 percent of industry employment.
(8) Estimate not released.
(9) The location quotient is the ratio of the area concentration of occupational employment to the national average concentration. A location quotient greater than one indicates the occupation has a higher share of employment than average, and a location quotient less than one indicates the occupation is less prevalent in the area than average.
Other OEWS estimates and related information:
May 2023 National Occupational Employment and Wage Estimates
May 2023 State Occupational Employment and Wage Estimates
May 2023 Metropolitan and Nonmetropolitan Area Occupational Employment and Wage Estimates
May 2023 National Industry-Specific Occupational Employment and Wage Estimates
Last Modified Date: April 3, 2024