
An official website of the United States government
An official website of the United States government
The .gov means it's official.
Federal government websites often end in .gov or .mil. Before sharing sensitive information,
make sure you're on a federal government site.
The site is secure.
The
https:// ensures that you are connecting to the official website and that any
information you provide is encrypted and transmitted securely.
Understanding how wages and wage distributions vary by occupation, industry, and location is invaluable information when negotiating a starting salary or requesting a raise at your current job. The Occupational Employment and Wage Statistics (OEWS) program produces hourly and annual wage estimates for about 830 occupations. Data shown here are from the May 2024 OEWS estimates, available at www.bls.gov/oes/.
First, find your occupation. The OEWS occupational profiles have a wealth of wage information for each of the approximately 830 occupations. Each profile page includes the occupation’s definition; national employment and wage estimates; and data by state and area, and by industry. Find and click on your occupation in the list at https://data.bls.gov/oesprofile/. Whether you are a nurse, accountant, security guard, or electrician, the occupational profiles will get you started in determining how much you could be earning.
Each occupational profile not only contains the average (mean) wage for the occupation, it also shows the wage distribution, which provides information on the spread of wages. Percentile wages, including the 10th, 25th, 50th (median), 75th, and 90th percentiles, indicate how much the wages vary for an occupation. For example, 10 percent of workers earn wages at or below the 10th percentile and 90 percent earn at or more than the 10th percentile. Eighty percent of workers earn wages between the 10th and 90th percentiles. The chart below shows the mean wage and the wage distribution for four different occupations.
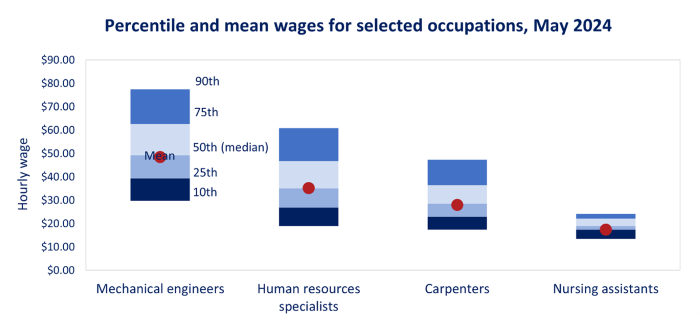
Where an individual’s wage should fall within the national distribution depends on a number of factors. Of course, experience and education are factors. Someone new to the field may expect wages near the 10th or 25th percentile, whereas those with more experience and education could expect wages near the 75th or 90th percentile. In addition, location is a very important factor in determining where you might fall in the wage distribution, and in many cases the industry also plays a role.
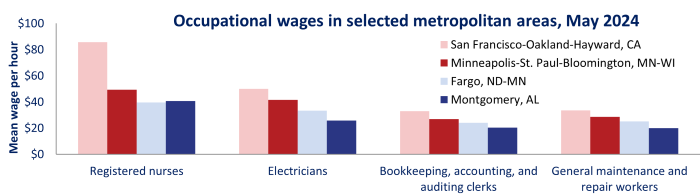
The geographic location affects wages because workers tend to earn higher salaries in large metropolitan areas, where a higher cost of living and other factors can drive wages upward. For example, of the areas shown in the chart below, mean hourly wages for all four occupations are highest in the San Francisco area, followed by Minneapolis. OEWS has wage data for over 580 areas, including states and areas.
Wages for workers in the same occupation can vary by industry. This may be due to differences in working conditions, where industry employment is concentrated, whether or not unions are prevalent, and other factors. The table below illustrates how annual wages for computer systems analysts can differ considerably across industries. For example, wages for computer systems analysts in aerospace product and parts manufacturing tend to be high, while colleges, universities, and professional schools pay lower wages.
| Industry | Mean | 10th | 25th | Median | 75th | 90th |
|---|---|---|---|---|---|---|
| percentile | percentile | percentile | percentile | |||
|
Colleges, universities, and professional schools |
$93,310 | $63,120 | $75,470 | $88,840 | $106,900 | $129,150 |
|
Insurance carriers |
107,650 | 72,900 |
84,420 |
102,950 | 127,190 | 144,480 |
|
Computer systems design and related services |
113,560 | 60,010 | 79,620 | 104,370 | 135,030 | 169,600 |
|
Aerospace product and parts manufacturing |
133,510 | 86,490 | 105,510 | 130,730 | 164,010 | 174,130 |
In addition to showing wage data, occupational profiles include employment information. It may be helpful to know whether the areas or industries with the highest wages also have high numbers of jobs in the occupation. By using OEWS wage data, you can obtain a better understanding of how your current wage or salary compares with the average wage for the nation, the area where you live, and the industry in which you work. In addition to the occupational profiles, you can download OEWS data in Excel format at www.bls.gov/oes/tables.htm. For more information, contact the Occupational Employment and Wage Statistics program at oewsinfo@bls.gov or (202) 691-6569.
Last Modified Date: May 13, 2025