An official website of the United States government
 United States Department of Labor
June 2009
Although there is currently no standard definition of "green" jobs, Occupational Employment Statistics (OES) data are available for a number of occupations associated with protecting and preserving the environment and natural resources. This highlight presents employment and wage data for eight environmental, conservation, and forestry occupations. Data for over 800 occupations are available from the OES home page.
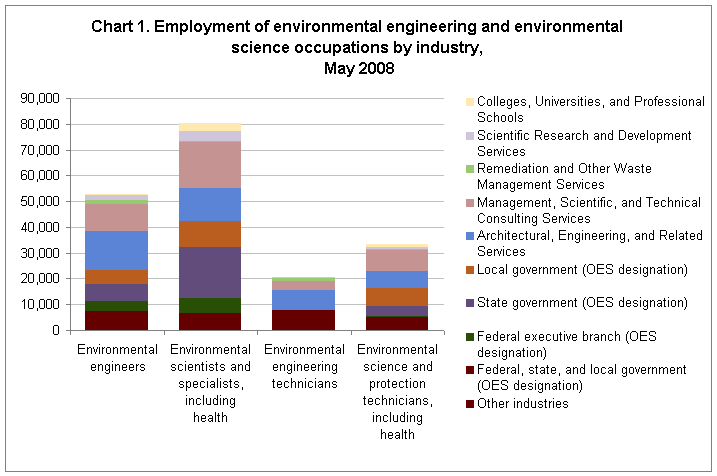
Chart 1 shows employment information by industry for environmental engineers; environmental engineering technicians; environmental scientists and specialists, including health; and environmental science and protection technicians, including health. With total employment of 80,120, environmental scientists was the largest of these four occupations, while environmental engineering technicians was the smallest, with employment of 20,740.

Click here to see these data in table format.
Architectural, engineering, and related services; and management, scientific, and technical consulting services were among the largest employers of all four occupations. These two industries employed approximately 54 percent of environmental engineering technicians, 49 percent of environmental engineers, 44 percent of environmental science technicians, and 38 percent of environmental scientists. Approximately 44 percent of all environmental scientists worked in federal, state, and local government, with about 25 percent employed in state government alone. Government also was a major employer of the other three occupations, accounting for about 34 percent of environmental science technicians, 30 percent of environmental engineers, and 17 percent of environmental engineering technicians. Although significantly smaller in terms of employment, scientific research and development services; remediation and other waste management services; and colleges, universities, and professional schools also were among the largest employers of one or more of these occupations.
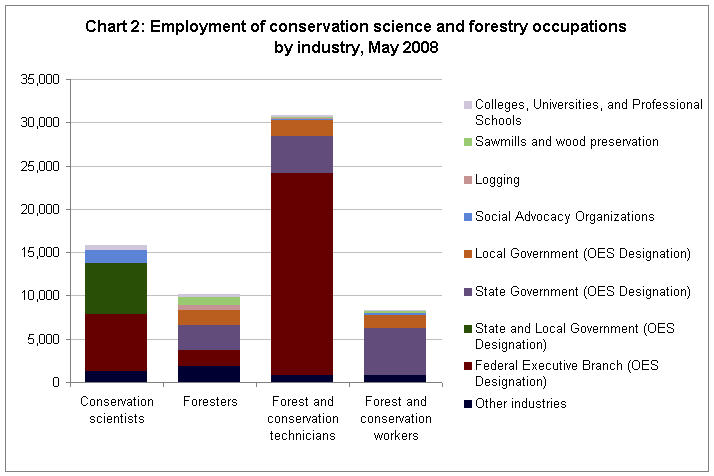
Chart 2 shows employment information by industry for four conservation and forestry occupations. Total employment in these occupations ranged from 8,280 for forest and conservation workers to 30,850 for forest and conservation technicians.

Click here to see these data in table format.
Most workers in these 4 occupations were employed in government. About 76 percent of forest and conservation technicians were employed by the federal government. State and local governments were the largest employers of the remaining occupations, accounting for about 38 percent of conservation scientists, 46 percent of foresters, and 84 percent of forest and conservation workers. Social advocacy organizations employed about 1,430 conservation scientists and smaller numbers of the other three occupations. Logging; sawmills and wood preservation; and colleges, universities, and professional schools were among the other industries employing these occupations. (OES does not cover the private sector forestry industry, which may include additional employment in these occupations.)
Wages for scientists and engineers were higher than those for the associated technician occupations. Environmental engineers earned an hourly mean wage of $37.49, making this the highest paying of the occupations shown above. Foresters was the lowest paying of the four scientist and engineer occupations, with an hourly mean wage of $26.46. Hourly mean wages for the three technician occupations ranged from $16.98 for forest and conservation technicians to $21.36 for environmental engineering technicians, while forest and conservation workers were the lowest paid of the eight occupations, with an hourly mean wage of $12.55.
Although the industries shown in charts 1 and 2 were among the largest employers of these occupations, in general, they were not among the highest paying industries for these jobs. However, there were some exceptions: for example, federal government was one of the highest paying industries for environmental engineers and conservation scientists, and state government was among the highest paying industries for environmental scientists. Additional occupational employment and wage data by industry are available online.
California had among the highest employment of all eight occupations. Texas and Florida had among the highest employment of the four environmental science and environmental engineering occupations, while Wisconsin and Minnesota were among the states employing the largest numbers of both foresters and conservation scientists. Although no states were consistently among the highest paying areas for all eight occupations, California and the District of Columbia were among the highest paying areas for several of the occupations. In some cases, wages for a given occupation varied considerably by state. For example, although New Jersey had among the highest employment of forest and conservation workers, it also had one of the lowest mean wages for this occupation, at $8.55 per hour, while Illinois was one of the highest paying states for this occupation, with an hourly mean wage of $22.12.
Career guidance for some of these occupations can be found in the Occupational Outlook Quarterly. Detailed occupational employment and wage data for all states and 585 metropolitan and nonmetropolitan areas are available from the OES web site.
Last Modified Date: June 11, 2009