An official website of the United States government
An official website of the United States government
The .gov means it's official.
Federal government websites often end in .gov or .mil. Before sharing sensitive information,
make sure you're on a federal government site.
The site is secure.
The
https:// ensures that you are connecting to the official website and that any
information you provide is encrypted and transmitted securely.
April 2011
Searching for a job in a recovering economy can be a daunting task. Whether they are recent graduates or professionals contemplating switching careers, job seekers can ease this process by understanding the distinct resources available to them. More specifically, prospective employees can use Occupational Employment Statistics (OES) data to find the industries and geographic areas with the highest employment and wages for occupations that are of interest to them.
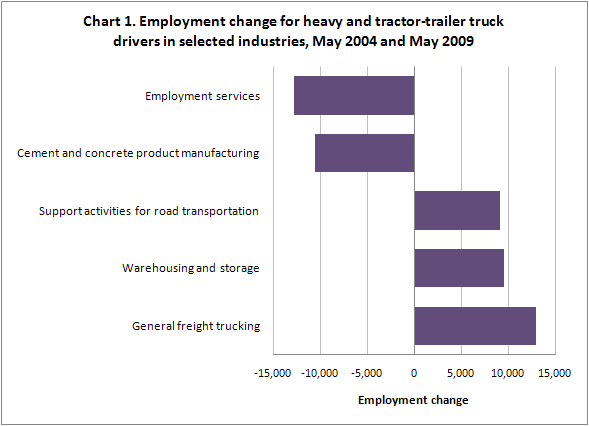
Chart 1 shows how employment for heavy and tractor-trailer truck drivers declined between 2004 and 2009 in specific industries, including employment services and cement and concrete product manufacturing. For this occupation, the employment level in the employment services industry declined by 12,770. Meanwhile, other industries, such as general freight trucking, warehousing and storage, and support activities for road transportation, experienced an increase in the number of heavy and tractor-trailer truck drivers. The general freight trucking industry increased its employment by 12,993 between 2004 and 2009. These data could be beneficial to heavy and tractor-trailer truck drivers who may have been working in an industry that experienced an employment decline by providing them with options for considering other industries that are experiencing growth in employment in their occupation.
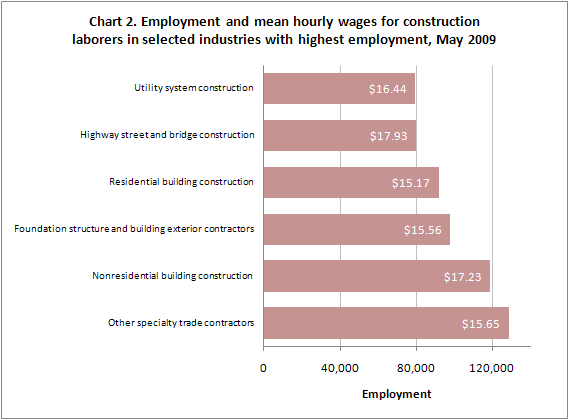
A similar example would be individuals who have been laid off in the residential construction industry. Employment in the residential construction industry has declined since early 2006; a similar industry that has also experienced decline, although not as much, is the nonresidential construction industry. The nonresidential construction industry also tends to pay higher wages compared with the residential construction industry. Chart 2 shows the employment levels and mean hourly wages for construction laborers in some of the industries with the highest employment levels.
Some occupations, such as accountants, financial managers, administrative services managers, clerks, sales workers, human resources specialists, and laborers, can be found in almost every industry. Other occupations are concentrated in a few industries, but they can still be found in other industries. For example, paralegals might focus their job searches on finding work within the legal services industry, an industry that traditionally employs 73 percent of paralegals. However, job seekers could broaden their searches to include government employers, which account for another 15 percent of jobs in this occupation. In other words, to maximize their potential opportunities, job seekers might want to examine alternative industries for employment. Different industries often pay different wages. As a jobseeker, if earning a higher salary is a priority, then applying to jobs that pay higher wages should be considered.
Considering related occupations
The OES website has a comprehensive list of 800 occupations, which allows individuals to consider related occupations. For example, heavy and tractor-trailer truck drivers not only can consider switching industries to improve their employment opportunities, but they also can consider related occupations under “Transportation and Material Moving Occupations.” Bus drivers and taxi drivers and chauffeurs are two of many driving-related occupations that require a very similar skill set and training to that of heavy and tractor-trailer truck drivers.
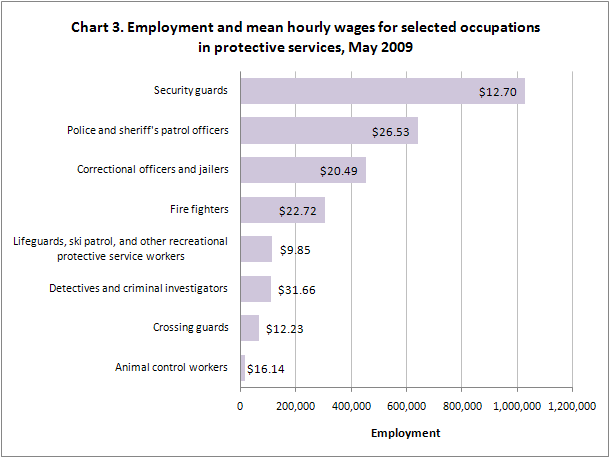
Similarly, under “Protective Service Occupations” individuals will find occupations such as police officers, security guards, correctional officers, and private investigators. The occupational profiles list can be especially useful for people who would like more information about jobs with a similar skill set. There were an estimated 1,028,830 security guards employed in May 2009, and their mean hourly wage was $12.70. A comparable occupation that may require slightly different training is correctional officers and jailers. Employment in that occupation was estimated at 455,350 in May 2009, with a mean hourly wage of $20.49.
Contemplating a specific industry
Alternatively, if job seekers are interested in working in a particular industry, they can find information on the variety of jobs in that industry. For instance, jobs in the healthcare industry include orderlies, surgeons, and medical records technicians and jobs in education include teachers, school bus drivers, and education administrators.
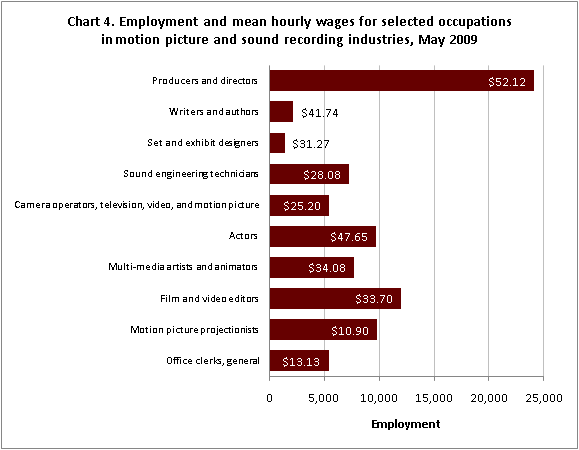
A jobseeker interested in working in the motion picture and sound recording industries could work in any number of occupations involved in preproduction, production, and postproduction. For example, writers and authors who take an idea or existing work and create a screenplay or script could be considered as working in preproduction. A production occupation might be sound engineering technicians who supervise all sound generated during filming. In May 2009, sound engineering technicians earned a mean hourly wage of $28.08. A postproduction occupation might be a film and video editor who studies and assembles the footage recorded. Training requirements and job outlook for these and over 250 occupations are available through the Occupational Outlook Handbook. Selected occupations in the motion picture and sound recording industries are included in Chart 4 alongside their mean hourly wages.
Location matters
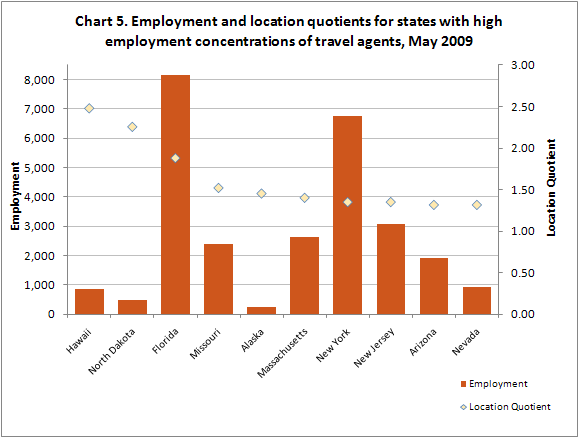
Geographically, OES produces cross-industry data for the nation as a whole, for individual states, and for metropolitan and nonmetropolitan areas. Employment concentration for an area, which can be measured by location quotients, is one important factor to consider as a jobseeker. The national location quotient for an occupation is always one. A location quotient greater than 1.0 indicates more local concentration in an occupation compared with the national average. Job seekers interested in working as travel agents will notice that specific states have higher-than-average employment concentrations in this occupation, such as Hawaii, North Dakota, Florida, and Missouri. Chart 5 details how travel agents are almost 2.5 times more concentrated in Hawaii compared with the national average, but the employment level was at 860 for May 2009. Meanwhile, Florida had a slightly lower location quotient, since travel agents were 1.88 times more concentrated in Florida compared with the national average, but the employment level for that occupation was almost 9.5 times higher than Hawaii’s, at 8,150. When considering where to look for employment opportunities, job seekers can use OES data to examine both the employment concentration and overall level of employment for various occupations.
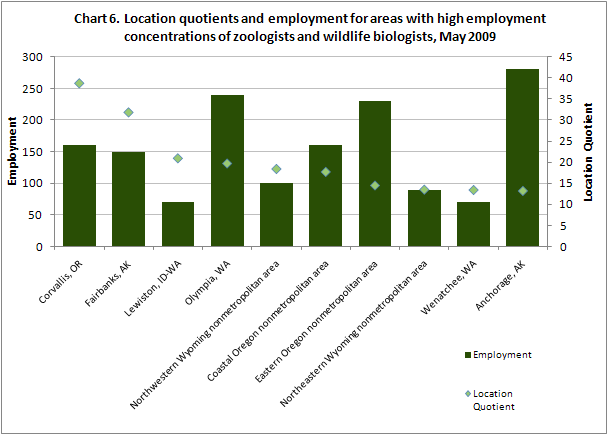
Although job seekers may be tempted to move to areas where wages are significantly higher, which tend to be large metropolitan areas, they should consider cost of living before packing up. For example, the New York metropolitan area may have higher-than-average wages and employment, yet the high cost of living can offset higher wages. Besides, not all occupations are concentrated in the largest metropolitan areas in the United States. For example, aspiring zoologists and wildlife biologists could search for jobs in Corvallis, OR; Fairbanks, AK; and Lewiston, ID, which represent some of the locations with high employment concentrations for this occupation. (See chart 6.) Zoologists and wildlife biologists are about 39 times more concentrated in Corvallis, OR; 32 times more concentrated in Fairbanks, AK; and 21 times more concentrated in Lewiston, ID, compared with the national average. Such a job seeker could also consider cities where employment levels are highest, some of which include Seattle, Portland, and San Diego. The Seattle-Tacoma-Bellevue, WA, metropolitan area employed an estimated 920 zoologists and wildlife biologists in May 2009. Meanwhile, the Portland-Vancouver-Beaverton, OR-WA, metropolitan area had employment of 710 in this occupation and the San Diego-Carlsbad-San Marcos, CA, metropolitan area employed 340.
Looking at wages
Wages vary for numerous reasons, including skills, experience, geographic locations, and industry. OES provides not only mean and median wage data, but also wage range data by percentiles, including the 10th, 25th, 75th, and 90th percentiles. To demonstrate the usefulness of these data, consider a student graduating with a degree in psychology who is possibly interested in becoming a public relations specialist. This job seeker may expect wages near the 10th percentile, at $30,520 annually, or the 25th percentile, at $38,740 annually, since he or she is just starting a new career and may lack experience. Meanwhile, a more experienced job seeker could expect wages in the 75th percentile, at $72,180 annually, or the 90th percentile, at $96,630 for the same occupation.
To get started, job seekers can select occupations of interest to them from the occupational profile page. More information on employment and wages for all occupations in a particular area can be found at the metropolitan and nonmetropolitan area page, or occupations in industries of interest can be reviewed at the industry-specific page. Wage data for May 2010 will be released on May 17, 2011. Data on employment projections, including the projected growth and decline in the construction industry, are from the Employment Projections Program. The Occupational Outlook Handbookis available from the Occupational Outlook Handbook Program. This highlight was prepared by Claudia Calderón. For more information, please contact the OES program.
Last Modified Date: March 30, 2018