
An official website of the United States government
An official website of the United States government
The .gov means it's official.
Federal government websites often end in .gov or .mil. Before sharing sensitive information,
make sure you're on a federal government site.
The site is secure.
The
https:// ensures that you are connecting to the official website and that any
information you provide is encrypted and transmitted securely.
Looking for a job and don’t know where to start? Consider preparing yourself with information from the Occupational Employment and Wage Statistics (OEWS) program at the U.S. Bureau of Labor Statistics. Data from the OEWS program can serve as a useful resource for jobseekers. OEWS data are valuable because they show employment and wages for individual occupations in specific geographic areas or industries. These data, updated annually, are available online at www.bls.gov/oes/tables.htm. There are many ways to use these free, publicly available data. Here are some tips on how to use OEWS data to focus your job search:
On the OEWS website, you can search a comprehensive list of about 830 occupations to find those related to your interests or experience. For example, under “Community and Social Service Occupations,” you will find occupations such as marriage and family therapists, healthcare social workers, and rehabilitation counselors. Alternatively, if you are interested in working in a particular industry, you can find information on the variety of jobs in that industry. For example, jobs in the arts, entertainment, and recreation industry include exercise trainers and group fitness instructors, self-enrichment teachers, and producers and directors.
Many occupations are found predominantly in specific industries. For example, 53 percent of civil engineers worked in the engineering services industry and 24 percent worked for federal, state, and local government. With this knowledge, jobseekers who originally may have focused on finding openings for this occupation in the private sector can broaden the scope of their searches to include government employers as well.
Wages vary for numerous reasons, including different skills, experience, geographic locations, and industry. Although jobseekers may be tempted to move to areas where wages are significantly higher, they should consider cost of living before packing up. The New York metropolitan area may have higher-than-average wages and employment, but the high cost of living can offset these higher wages.
Although larger metropolitan areas tend to attract jobseekers because of high employment levels, some occupations have higher employment levels in smaller areas. For example, aspiring nursing assistants could search for jobs in the New York, Chicago, and Los Angeles metropolitan areas, which are three of the locations with the highest employment levels for this occupation. However, the Houston metropolitan area, was among the areas with the highest employment of wellhead pumpers, and Madison, Wisconsin, was among the areas with the highest employment of animal scientists.
To see these techniques put to use in a real-life situation, we can use the example of Kelly, a computer science major trying to find a career path after graduating from college. She might consider one of the following occupations that many computer science majors enter:
| Occupation | National employment | National annual average wage |
|---|---|---|
|
Computer systems analysts |
497,800 | $111,960 |
|
Computer programmers |
109,870 | 103,640 |
|
Network and computer systems administrators |
318,570 | 101,190 |
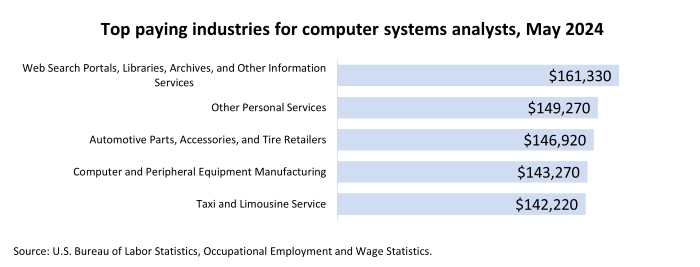
After some thought, Kelly decides that she would like to know more about being a computer systems analyst. By visiting the OEWS website, Kelly can find industries with the highest wages for computer systems analysts, as shown in the graph below:
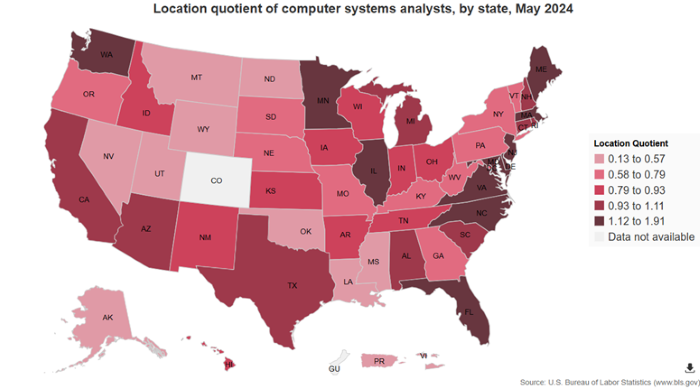
Kelly also wants to know how concentrated employment for her chosen occupation is in different states. On the OEWS mapping application, she finds a location quotient map that graphically shows the employment concentration of computer systems analysts in each state. By holding her mouse pointer over Virginia in the map, Kelly easily finds that the employment concentration for computer systems analysts is 1.73 times as high in Virginia as in the United States as a whole.
Last Modified Date: May 13, 2025