Department of Labor Logo United States Department of Labor
Dot gov

The .gov means it's official.
Federal government websites often end in .gov or .mil. Before sharing sensitive information, make sure you're on a federal government site.

Https

The site is secure.
The https:// ensures that you are connecting to the official website and that any information you provide is encrypted and transmitted securely.

Food and Beverage Serving and Related Workers

Summary

Please enable javascript to play this video.

Video transcript available at https://www.youtube.com/watch?v=9pFjWggdixM.
Quick Facts: Food and Beverage Serving and Related Workers
2022 Median Pay $28,130 per year
$13.52 per hour
Typical Entry-Level Education No formal educational credential
Work Experience in a Related Occupation None
On-the-job Training Short-term on-the-job training
Number of Jobs, 2022 4,540,700
Job Outlook, 2022-32 2% (As fast as average)
Employment Change, 2022-32 79,700

What Food and Beverage Serving and Related Workers Do

Food and beverage serving and related workers take and prepare orders, clear tables, and do other tasks associated with providing food and drink to customers.

Work Environment

Food and beverage serving and related workers are employed in restaurants, schools, and other dining places. Work shifts often include early mornings, late evenings, weekends, and holidays. Part-time work is common.

How to Become a Food and Beverage Serving or Related Worker

Food and beverage serving and related workers typically have no requirements for formal education or work experience to enter the occupation. They learn their skills on the job.

Pay

The median hourly wage for food and beverage serving and related workers was $13.52 in May 2022.

Job Outlook

Overall employment of food and beverage serving and related workers is projected to grow 2 percent from 2022 to 2032, about as fast as the average for all occupations.

About 1,026,200 openings for food and beverage serving and related workers are projected each year, on average, over the decade. Many of those openings are expected to result from the need to replace workers who transfer to different occupations or exit the labor force, such as to retire.

State & Area Data

Explore resources for employment and wages by state and area for food and beverage serving and related workers.

Similar Occupations

Compare the job duties, education, job growth, and pay of food and beverage serving and related workers with similar occupations.

More Information, Including Links to O*NET

Learn more about food and beverage serving and related workers by visiting additional resources, including O*NET, a source on key characteristics of workers and occupations.

What Food and Beverage Serving and Related Workers Do About this section

Food and beverage serving and related workers
Food and beverage workers may work directly with customers.

Food and beverage serving and related workers take and prepare orders, clear tables, and do other tasks associated with providing food and drink to customers.

Duties

Food and beverage serving and related workers typically do the following:

  • Greet customers and answer their questions about menu items and specials
  • Take food and drink orders from customers
  • Prepare food and drink orders, such as sandwiches and coffee
  • Relay customers’ orders to other kitchen staff
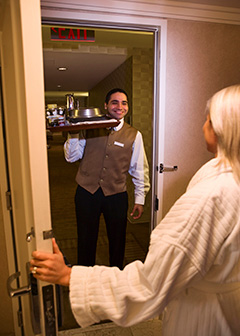
  • Serve food and drinks to customers at a counter, at a stand, or in a hotel room
  • Accept payment and provide customers with receipts
  • Clean assigned work areas, such as dining tables or serving counters
  • Stock service stations, cabinets, and tables
  • Set tables or prepare food stations for new customers

Food and beverage serving and related workers are the front line of customer service in restaurants, cafeterias, and other food service establishments. They seat customers, take or prepare food and drink orders, clear and set tables, and serve food and beverages. Depending on the establishment, they may do some or all of these tasks during their shift. 

Most work as part of a team, although their responsibilities and job titles vary.

The following are examples of types of food and beverage serving and related workers:

Dining room and cafeteria attendants and bartender helpers—sometimes collectively referred to as bus staff—help waiters, waitresses, and bartenders by cleaning and setting tables, removing dirty dishes, and stocking serving areas with supplies. They also may help waiters and waitresses by bringing meals from the kitchen, distributing dishes to diners, filling water glasses, and delivering condiments.

Fast food and counter workers are employed primarily by limited-service restaurants, cafeterias, and snack bars at which customers generally order and pay before eating. These workers take food and beverage orders, prepare or retrieve items, and accept payment. They also heat food items and make salads and sandwiches.

Hosts and hostesses greet customers, seat guests, and manage reservations and waiting lists. They also may provide menus, take and prepare to-go orders, and assist with maintaining cleanliness of the dining area.

Nonrestaurant food servers provide food to customers outside a restaurant environment. For example, they may deliver room-service orders in hotels or meals to hospital rooms. Some work as carhops at venues such as drive-in movie theaters, bringing orders to customers in parked cars.

Work Environment About this section

Food and beverage serving and related workers
Food servers bring meals to customers outside a restaurant.

Food and beverage serving and related workers held about 4.5 million jobs in 2022. Employment in the detailed occupations that make up food and beverage serving and related workers was distributed as follows:

Fast food and counter workers 3,410,100
Dining room and cafeteria attendants and bartender helpers 459,200
Hosts and hostesses, restaurant, lounge, and coffee shop 412,800
Food servers, nonrestaurant 258,600

The largest employers of food and beverage serving and related workers were as follows:

Restaurants and other eating places 77%
Retail trade 4
Healthcare and social assistance 4
Special food services 4
Educational services; state, local, and private 3

Food and beverage serving and related workers spend most of their shift on their feet. They carry trays of food, dishes, or glassware, which are often heavy. During busy dining periods, they are under pressure to serve customers quickly and efficiently.

Injuries and Illnesses

Food preparation and serving areas in restaurants often have potential safety hazards, such as hot ovens and slippery floors. Common injuries include slips, cuts, and burns. To reduce these risks, workers may wear gloves, aprons, or nonslip shoes.

Work Schedules

Part-time work is common for food and beverage serving and related workers. Because restaurants and other eating places typically have extended dining hours, work shifts often include early mornings, late evenings, weekends, and holidays.

Work may be seasonal. Food and beverage serving and related workers may not work or may have limited hours during certain times of the year. For example, those in school cafeterias may work only during the school year, usually 9 to 10 months.

In addition, business hours in restaurants allow for flexible schedules that appeal to teenagers. Food and beverage serving and related workers employs more 16- to 19-year-olds than any other occupation.

How to Become a Food and Beverage Serving or Related Worker About this section

Food and beverage serving and related workers
Food and beverage and related workers need customer service skills.

Food and beverage serving and related workers typically have no requirements for education to enter the occupation. They receive short-term on-the-job training.

Most states require workers who serve alcoholic beverages, even as an accompaniment to meals, to be at least 18 years old.

Education

There typically are no formal education requirements for becoming a food and beverage serving worker.

Training

Workers typically learn through on-the-job training, which may last from few days to several weeks. Training includes basic customer service, kitchen safety, safe food-handling procedures, and sanitation guidelines.

Food and beverage serving and related workers typically learn their duties by watching and working with experienced staff. Some employers, particularly those in fast-food restaurants, have specific training programs for new workers.

Bartender helpers and other workers in establishments where alcohol is served may need training on state and local laws concerning the sale of alcoholic beverages. Some states, counties, and cities mandate such training, which typically lasts a few hours.

Advancement

Some food and beverage serving and related workers advance to waiter, waitress, or bartender positions as they learn the basics of serving food or preparing drinks. Kitchen staff may advance to become food preparation workers or cooks. Still others may move up to supervisory or food service manager positions.

Important Qualities

Communication skills. Food and beverage serving and related workers must listen to customers’ orders and relay them correctly to the kitchen staff so that the orders are prepared as requested.

Customer-service skills. Food service establishments rely on good food and customer service to keep customers and succeed in a competitive industry. As a result, workers should be courteous and be able to attend to customers’ requests.

Physical stamina. Food and beverage serving and related workers spend most of their shift doing physical tasks such as standing, carrying trays, and cleaning work areas.

Physical strength. Food and beverage serving and related workers need to be able to lift and carry stock and equipment that can weigh up to 50 pounds.

Pay About this section

Food and Beverage Serving and Related Workers

Median hourly wages, May 2022

Total, all occupations

$22.26

Food preparation and serving related occupations

$14.25

Food and beverage serving and related workers

$13.52


The median hourly wage for food and beverage serving and related workers was $13.52 in May 2022. The median wage is the wage at which half the workers in an occupation earned more than that amount and half earned less. The lowest 10 percent earned less than $10.14, and the highest 10 percent earned more than $17.26.

Median hourly wages for food and beverage serving and related workers in May 2022 were as follows:

Food servers, nonrestaurant $14.57
Dining room and cafeteria attendants and bartender helpers 14.00
Fast food and counter workers 13.43
Hosts and hostesses, restaurant, lounge, and coffee shop 13.33

In May 2022, the median hourly wages for food and beverage serving and related workers in the top industries in which they worked were as follows:

Educational services; state, local, and private $15.17
Healthcare and social assistance 14.94
Retail trade 14.52
Special food services 14.10
Restaurants and other eating places 13.31

Although some workers in these occupations earn tips, most get their earnings from hourly wages alone.

In some restaurants, workers may contribute all or a portion of their tips to a tip pool, which is distributed among qualifying workers. Tip pools allow workers who do not usually receive tips directly from customers, such as dining room attendants, to be part of a team and to share in the rewards for good service.

Employers may provide meals and uniforms but may deduct those costs from the worker’s wages.

Part-time work is common for food and beverage serving and related workers. Because restaurants and other eating places typically have extended dining hours, work shifts often include early mornings, late evenings, weekends, and holidays.

Work may be seasonal. Food and beverage serving and related workers may not work or may have limited hours during certain times of the year. For example, those in school cafeterias may work only during the school year, usually 9 to 10 months.

In addition, business hours in restaurants allow for flexible schedules that appeal to teenagers. Food and beverage serving and related workers employs more 16- to 19-year-olds than any other occupation.

Job Outlook About this section

Food and Beverage Serving and Related Workers

Percent change in employment, projected 2022-32

Total, all occupations

3%

Food preparation and serving related occupations

2%

Food and beverage serving and related workers

2%


Overall employment of food and beverage serving and related workers is projected to grow 2 percent from 2022 to 2032, about as fast as the average for all occupations.

About 1,026,200 openings for food and beverage serving and related workers are projected each year, on average, over the decade. Many of those openings are expected to result from the need to replace workers who transfer to different occupations or exit the labor force, such as to retire.

Employment

Projected employment of food and beverage serving and related workers varies by occupation (see table).

As a growing population continues to dine out, purchase take-out meals, or have food delivered, more restaurants, particularly fast-food and casual dining restaurants, are expected to open. In response, more food and beverage serving and related workers are expected to be needed.

In addition, nontraditional food service operations, such as those inside grocery stores and cafeterias in hospitals and residential care facilities, are expected to serve more prepared meals. Because these workers are essential to the operation of a food-serving establishment, they should continue to be in demand.

Employment projections data for food and beverage serving and related workers, 2022-32
Occupational Title SOC Code Employment, 2022 Projected Employment, 2032 Change, 2022-32 Employment by Industry
Percent Numeric

SOURCE: U.S. Bureau of Labor Statistics, Employment Projections program

Food and beverage serving and related workers

4,540,700 4,620,500 2 79,700

Fast food and counter workers

35-3023 3,410,100 3,460,500 1 50,400 Get data

Food servers, nonrestaurant

35-3041 258,600 266,600 3 8,100 Get data

Dining room and cafeteria attendants and bartender helpers

35-9011 459,200 478,400 4 19,200 Get data

Hosts and hostesses, restaurant, lounge, and coffee shop

35-9031 412,800 414,900 0 2,000 Get data

State & Area Data About this section

Occupational Employment and Wage Statistics (OEWS)

The Occupational Employment and Wage Statistics (OEWS) program produces employment and wage estimates annually for over 800 occupations. These estimates are available for the nation as a whole, for individual states, and for metropolitan and nonmetropolitan areas. The link(s) below go to OEWS data maps for employment and wages by state and area.

Projections Central

Occupational employment projections are developed for all states by Labor Market Information (LMI) or individual state Employment Projections offices. All state projections data are available at www.projectionscentral.org. Information on this site allows projected employment growth for an occupation to be compared among states or to be compared within one state. In addition, states may produce projections for areas; there are links to each state’s websites where these data may be retrieved.

CareerOneStop

CareerOneStop includes hundreds of occupational profiles with data available by state and metro area. There are links in the left-hand side menu to compare occupational employment by state and occupational wages by local area or metro area. There is also a salary info tool to search for wages by zip code.

Similar Occupations About this section

This table shows a list of occupations with job duties that are similar to those of food and beverage serving and related workers.

Occupation Job Duties ENTRY-LEVEL EDUCATION Help on Entry-Level Education 2022 MEDIAN PAY Help on Median Pay
Bartenders Bartenders

Bartenders mix drinks and serve them directly to customers or through wait staff.

No formal educational credential $29,380
Cashiers Cashiers

Cashiers process payments from customers purchasing goods and services.

No formal educational credential $28,240
Cooks Cooks

Cooks season and prepare foods, including soups, salads, entrees, and desserts.

See How to Become One $30,910
Flight attendants Flight Attendants

Flight attendants provide routine services and respond to emergencies to ensure the safety and comfort of airline passengers.

High school diploma or equivalent $63,760
Food preparation workers Food Preparation Workers

Food preparation workers perform a variety of tasks other than cooking, such as slicing meat and brewing coffee.

No formal educational credential $29,790
Retail sales workers Retail Sales Workers

Retail sales workers help customers find products they want and process customers’ payments.

No formal educational credential $30,750
Waiters and waitresses Waiters and Waitresses

Waiters and waitresses take orders and serve food and beverages to customers in dining establishments.

No formal educational credential $29,120
Suggested citation:

Bureau of Labor Statistics, U.S. Department of Labor, Occupational Outlook Handbook, Food and Beverage Serving and Related Workers,
at https://www.bls.gov/ooh/food-preparation-and-serving/food-and-beverage-serving-and-related-workers.htm (visited March 03, 2024).

Last Modified Date: Wednesday, September 6, 2023

What They Do

The What They Do tab describes the typical duties and responsibilities of workers in the occupation, including what tools and equipment they use and how closely they are supervised. This tab also covers different types of occupational specialties.

Work Environment

The Work Environment tab includes the number of jobs held in the occupation and describes the workplace, the level of physical activity expected, and typical hours worked. It may also discuss the major industries that employed the occupation. This tab may also describe opportunities for part-time work, the amount and type of travel required, any safety equipment that is used, and the risk of injury that workers may face.

How to Become One

The How to Become One tab describes how to prepare for a job in the occupation. This tab can include information on education, training, work experience, licensing and certification, and important qualities that are required or helpful for entering or working in the occupation.

Pay

The Pay tab describes typical earnings and how workers in the occupation are compensated—annual salaries, hourly wages, commissions, tips, or bonuses. Within every occupation, earnings vary by experience, responsibility, performance, tenure, and geographic area. For most profiles, this tab has a table with wages in the major industries employing the occupation. It does not include pay for self-employed workers, agriculture workers, or workers in private households because these data are not collected by the Occupational Employment and Wage Statistics (OEWS) survey, the source of BLS wage data in the OOH.

State & Area Data

The State and Area Data tab provides links to state and area occupational data from the Occupational Employment and Wage Statistics (OEWS) program, state projections data from Projections Central, and occupational information from the Department of Labor's CareerOneStop.

Job Outlook

The Job Outlook tab describes the factors that affect employment growth or decline in the occupation, and in some instances, describes the relationship between the number of job seekers and the number of job openings.

Similar Occupations

The Similar Occupations tab describes occupations that share similar duties, skills, interests, education, or training with the occupation covered in the profile.

Contacts for More Information

The More Information tab provides the Internet addresses of associations, government agencies, unions, and other organizations that can provide additional information on the occupation. This tab also includes links to relevant occupational information from the Occupational Information Network (O*NET).

2022 Median Pay

The wage at which half of the workers in the occupation earned more than that amount and half earned less. Median wage data are from the BLS Occupational Employment and Wage Statistics survey. In May 2022, the median annual wage for all workers was $46,310.

On-the-job Training

Additional training needed (postemployment) to attain competency in the skills needed in this occupation.

Entry-level Education

Typical level of education that most workers need to enter this occupation.

Work experience in a related occupation

Work experience that is commonly considered necessary by employers, or is a commonly accepted substitute for more formal types of training or education.

Number of Jobs, 2022

The employment, or size, of this occupation in 2022, which is the base year of the 2022-32 employment projections.

Job Outlook, 2022-32

The projected percent change in employment from 2022 to 2032. The average growth rate for all occupations is 3 percent.

Employment Change, 2022-32

The projected numeric change in employment from 2022 to 2032.

Entry-level Education

Typical level of education that most workers need to enter this occupation.

On-the-job Training

Additional training needed (postemployment) to attain competency in the skills needed in this occupation.

Employment Change, projected 2022-32

The projected numeric change in employment from 2022 to 2032.

Growth Rate (Projected)

The percent change of employment for each occupation from 2022 to 2032.

Projected Number of New Jobs

The projected numeric change in employment from 2022 to 2032.

Projected Growth Rate

The projected percent change in employment from 2022 to 2032.

2022 Median Pay

The wage at which half of the workers in the occupation earned more than that amount and half earned less. Median wage data are from the BLS Occupational Employment and Wage Statistics survey. In May 2022, the median annual wage for all workers was $46,310.