
An official website of the United States government
An official website of the United States government
The .gov means it's official.
Federal government websites often end in .gov or .mil. Before sharing sensitive information,
make sure you're on a federal government site.
The site is secure.
The
https:// ensures that you are connecting to the official website and that any
information you provide is encrypted and transmitted securely.

More BLS articles and information on employee benefits can be found at the following links:
Paid leave was the most prevalent employee benefit provided by employers in private industry throughout the United States in 2012. Eighty-four percent of private industry workers received vacation, holiday, or personal leave.1 Seventy-two percent of workers received both paid holidays and paid vacations, and 61 percent were covered by sick leave plans. For employers, the cost for providing these benefits to employees was $1.98 per hour worked, and these benefits made up 6.9 percent of total compensation.2
The eligibility for paid leave has undergone change over the past 20 years. While fewer workers enjoy paid vacations, employers are increasingly providing access to sick leave, personal leave, and family leave. (See table 1.) Also, by comparison, the employer cost per employee hour worked for paid leave was $1.09 or 6.8 percent of total compensation in March 1992.
This issue of BEYOND THE NUMBERS looks at the changes in employer costs and in different paid leave benefits for private industry workers over the past two decades. These benefits include paid leave for holidays, vacations, sick, personal, funeral, jury duty, military, and family. The recent data for this article come from the National Compensation Survey (NCS): Employee Benefits in the United States, March 2012 https://www.bls.gov/ncs/ebs/benefits/2012/ebbl0050.pdf. Earlier data for 1992 and 1993 come from the NCS predecessor, the Employee Benefits Survey (EBS), which provided data by size of establishment. Specifically, the EBS surveyed medium and large private establishments with 100 or more and small private establishments with fewer than 100 workers in alternating years. Data were published in “Employee Benefits in Small Private Establishments, 1992,” https://www.bls.gov/ncs/ebs/sp/ebbl0026.pdf. Estimates for “Employee Benefits in Medium and Large Private Establishments, 1993” are available online at https://www.bls.gov/ncs/ebs/sp/ebbl0024.pdf. The estimates for these surveys of private industry were weighted to produce estimates for all private industry for the 1992–1993 period.3
| Characteristic | Paid holidays | Paid vacations | Paid sick leave(1) | Paid personal leave | Paid funeral leave | Paid jury duty leave | Paid military leave | Paid family leave(2) |
|---|---|---|---|---|---|---|---|---|
| All workers | ||||||||
| 1992–1993 | 77 | 82 | 50 | 15 | 57 | 64 | 30 | 2 |
| 2012 | 77 | 77 | 61 | 37 | 60 | 63 | 33 | 11 |
| Full-time workers | ||||||||
| 1992–1993 | 86 | 92 | 58 | 16 | 65 | 73 | 36 | 2 |
| 2012 | 90 | 91 | 75 | 44 | 71 | 73 | 39 | 13 |
| Part-time workers | ||||||||
| 1992–1993 | 36 | 40 | 16 | 7 | 24 | 27 | 8 | 1 |
| 2012 | 40 | 35 | 23 | 16 | 29 | 32 | 15 | 4 |
| Establishments with fewer than 100 workers | ||||||||
| 1992 | 70 | 75 | 44 | 10 | 42 | 48 | 17 | 2 |
| 2012 | 69 | 69 | 52 | 27 | 47 | 51 | 21 | 8 |
| Establishments with 100 workers or more | ||||||||
| 1993 | 84 | 90 | 59 | 20 | 77 | 83 | 47 | 3 |
| 2012 | 87 | 86 | 73 | 49 | 76 | 77 | 47 | 15 |
| Footnotes: (1) Beginning in 1995, plans that provided a specified number of days off for each illness or disability were reclassified from paid sick leave to a short-term disability plan.
| ||||||||
BLS measures the cost to employers for providing wages, salaries, and selected employee benefits, using the ECEC data series. The ECEC series, based on the NCS, provides quarterly data on employer costs per hour worked for total compensation, wages and salaries, total benefits, and selected benefits, including vacations, holidays, sick leave, and personal leave.
While employer costs per hour worked for sick leave increased between 1992 and 2012, the percentage of total compensation remained unchanged for all workers and for small establishments (those with fewer than 100 employees) and medium and large establishments (those with 100 workers or more). The percentage of total compensation for paid holidays was 2.3 percent in 1992, compared with 2.1 percent in 2012. Paid vacations were 3.3 percent of total compensation in 1992, compared with 3.5 percent in 2012. (See table 2.)
| Characteristic | Paid holidays | Paid vacations | Paid sick leave | |||
|---|---|---|---|---|---|---|
| Cost | Percent | Cost | Percent | Cost | Percent | |
| All workers | ||||||
| 1992 | $0.37 | 2.3 | $0.54 | 3.3 | $0.14 | 0.9 |
| 2012 | 0.61 | 2.1 | 1.02 | 3.5 | 0.25 | 0.9 |
| Establishments with fewer than 100 workers | ||||||
| 1992 | 0.27 | 1.9 | 0.37 | 2.6 | 0.10 | 0.7 |
| 2012 | 0.45 | 1.9 | 0.69 | 2.9 | 0.16 | 0.7 |
| Establishments with 100 or more workers | ||||||
| 1992 | 0.45 | 2.5 | 0.68 | 3.8 | 0.17 | 1.0 |
| 2012 | 0.81 | 2.3 | 1.41 | 4.1 | 0.35 | 1.0 |
| Source: U.S. Bureau of Labor Statistics, National Compensation Survey. | ||||||
Paid holidays are days off from work on days of special religious, cultural, social, or patriotic significance, on which work and business ordinarily cease. Employees may receive either full or partial pay for holidays. Paid vacations are leave from work (or pay in lieu of time off) provided on an annual basis and normally taken in blocks of days or weeks. Paid vacations commonly are granted to employees only after they meet specified service requirements. The amount of vacation leave received each year usually varies with the length of service. Vacation time is normally paid at full pay or partial pay, or it may be a percentage of employee earnings. Paid sick leave provides all or part of an employee’s earnings if he or she is unable to work because of a nonwork related illness or injury. Employees commonly receive their regular pay for a specified number of days off per year. Sick leave is provided on a per-year basis, usually expressed in days, and is never insured. Although the availability of paid vacations and holidays was about the same (90 percent) in 2012 as it was during 1992–1993, the provisions of paid vacation plans became more generous in the most recent year. The average number increased by 2 vacation days for 1, 10, and 20 years of service. In contrast, the average number of annual paid holidays declined from 10 days in 1992–1993 to 8 days in 2012.4 (See table 3.)
Paid sick leave for full-time workers became more widespread over the 1992–1993 span, increasing from half of the number of workers in 1992–1993 to about three-fifths of all workers in 2012.5 Sick leave is a benefit that is more prevalent with white-collar workers such as professional and clerical occupations than it is with blue-collar occupations. The higher percentage of workers with access to sick leave is partially due to the increase of white-collar employment from 1992–1993 to 2012.
The provisions of sick leave plans have also changed significantly since 1992–1993. The number of days increased with years of service, rising from 10 days with 1 year of service to 17 days with 20 years. In contrast, the average number of days increased modestly with length of service in 2012, from 8 days for 1 year of service to 10 days after 20 years of service.6
| Characteristic | Average number of days by length of service | |||
|---|---|---|---|---|
| 1 year | 5 years | 10 years | 20 years | |
| Vacations | ||||
| 1992–1993 | 8 | 13 | 15 | 18 |
| 2012 | 10 | 14 | 17 | 20 |
| Sick leave | ||||
| 1992–1993 | 10 | 13 | 15 | 17 |
| 2012 | 8 | 8 | 9 | 10 |
| Holidays(1) | ||||
| 1992–1993 | 10 | 10 | 10 | 10 |
| 2012 | 8 | 8 | 8 | 8 |
| Footnotes: (1) Holiday provisions are the same for all lengths of service. | ||||
Personal leave is a general-purpose leave benefit, used for reasons important to the individual employee, but not otherwise provided by other forms of leave. Some employers place restrictions on the purposes for which personal leave may be used. Access to paid personal leave and paid family leave increased sharply from 1992–1993 to 2012. Paid personal leave was available to 37 percent of all workers in 2012, significantly higher than 15 percent of workers in 1992–1993. In medium and large establishments (those with 100 workers or more), nearly half of workers had access in 2012, compared with only one in five workers in 1993. Although less common among part-time workers and workers in smaller establishments (those with fewer than 100 workers), paid personal leave also increased over the past 20 years. In 1992–1993, only 7 percent of part-time workers and 10 percent of workers in small establishment had personal leave plans. By 2012, 16 percent of part-time workers and 27 percent of workers in smaller establishments had access to personal leave plans.
Paid funeral leave provides time off from work because of a death in the family. The period of absence is usually limited to a few days (for example, 3 paid days for immediate family members and 1 paid day for other relatives). Paid jury duty leave provides a paid absence from work when one is summoned to serve as a juror. Employer payments commonly make up the difference between the employee’s regular pay and the court’s jury allowance. Paid military leave is paid absence from work to fulfill military commitments. Pay may be either regular pay or the difference between employee’s regular earnings and the amount they receive from the military. Paid funeral leave and paid jury duty leave were available to a majority of all workers, full-time workers, and workers in medium and large establishments in both 1992–1993 and 2012, and this proportion showed little change over the two-decade period. These types of leave benefits were less prevalent among part-time workers and workers in small establishments. For example, less than a third of part-time workers had access to paid funeral leave and paid military leave in 1992–1993 and 2012.
Paid military leave was available to one-third of all workers in 2012, compared with 3 out of 10 workers in 1992–1993. Leave was more prevalent for full-time workers and workers in medium and large establishments. Fifteen percent of part-time workers had access in 2012, nearly double the percentage of workers during 1992–1993.
Paid family leave is granted to an employee to care for a family member and includes paid maternity and paternity leave. The leave may be available to care for a newborn child, an adopted child, a sick child, or a sick adult relative. Paid family leave is given in addition to any sick leave, vacation, personal leave, or short-term disability leave that is available to the employee. The definition of family leave has undergone changes over the past 20 years. In the EBS, paid maternity and paid paternity leave was captured separately. In 1992, only 2 percent of workers received paid maternity benefits and 1 percent, paid paternity benefits. Recently, the definition of family leave was expanded in the NCS to include additional types of leave, such as leave to care for family members. Paid family leave in 2012 was available to 11 percent of all workers and 15 percent of workers in medium and large establishments. As the pattern was with access to other leave benefits, only 4 percent of part-time workers and 8 percent of workers in small establishments had access to the benefit in that year.
Consolidated leave plans provide a single amount of time off for workers to use for any number of purposes, such as vacation, illness, and personal business. The NCS began capturing information on consolidated leave plans in 2005. These plans provide workers the ability to use leave for multiple purposes such as vacations, sick leave, or personal days. Previously, these plans were prorated among the leave plans they had replaced such as vacation or sick leave. These plans typically allow use of time off in small increments of a day or less.7
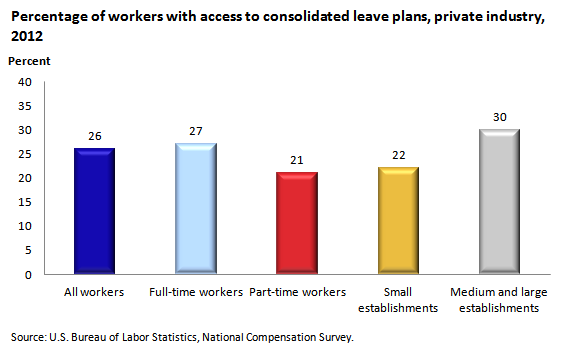
About one-fourth of all workers were enrolled in consolidated leave plans in 2012. Consolidated leave plans are common in the insurance and healthcare industries. Plans were more prevalent among full-time employees (27 percent) than part-time workers (21 percent). Consolidated leave plans were available to 30 percent of workers in medium and large establishments, greater than the 22 percent of workers in small establishments. Provisions were also more generous in medium and large establishments. For example, workers with 1 year of service were provided 17 days. By 20 years of service, 27 days were available. In contrast, workers in small establishments were provided 13 days after 1 year of service and 22 days after 20 years of service. (See chart 1.)
| Characteristic | Percent |
|---|---|
All workers | 26 |
Full-time workers | 27 |
Part-time workers | 21 |
Small establishments | 22 |
Medium and large establishments | 30 |
The availability and costs of the most common leave benefits, paid holidays, and paid vacations remained virtually unchanged from 1992–1993 through 2012. Instead of more generous holiday and vacation provisions, other leave benefits such as sick leave and personal leave have shown more growth. In addition, a new type of leave plan has become more common, consolidated leave, which is now available to approximately one-quarter of all workers.
This BEYOND THE NUMBERS article was prepared by Robert W. Van Giezen, an economist in the Division of Compensation Data Analysis and Planning. Email: VanGiezen.Robert@bls.gov. For more benefits information, see www.bls.gov/ebs. For additional assistance, contact one of our information offices: National-Washington, DC: (202) 691-6199, TDD (800) 877-8339; Atlanta (404) 893-4222; Boston: (617) 565-2327; Chicago: (312) 353-1880; Dallas: (972) 850-4800; Kansas City: (816) 285-7000; New York: (646) 264-3600; Philadelphia: (215) 597-3282; San Francisco: (415) 625-2270.
Information in this article will be made available to sensory-impaired individuals upon request. Voice phone: (202) 691-5200. Federal Relay Service: 1-800-877-8339. This article is in the public domain and may be reproduced without permission.
Robert W. Van Giezen, “Paid leave in private industry over the past 20 years ,” Beyond the Numbers: Pay & Benefits, vol. 2 / no. 18 (U.S. Bureau of Labor Statistics, August 2013), https://www.bls.gov/opub/btn/volume-2/paid-leave-in-private-industry-over-the-past-20-years.htm
2 Data for the March 1992 Employer Costs for Employee Compensation is available at ftp://ftp.bls.gov/pub/special.requests/ocwc/ect/ecechist.pdf. Data for March 2012 is available online at ftp://ftp.bls.gov/pub/special.requests/ocwc/ect/ececqrtn.pdf. The definition of paid leave underwent a change in June 2008, when paid military, funeral and jury duty leave were dropped from the series.
In addition, data users should use caution when making comparisons of average per-hour costs of benefits across the various employee groups because the ECEC estimates represent averages of employer costs incurred on behalf of all employees—those who have access to benefits and those who do not, as well as those who choose to participate in benefits and those who do not. As a result, estimates of average per-hour-worked benefit costs calculated in this manner reflect not only the “pure” costs of benefits for employees in a given employee group, but also the incidence (access and participation) of benefits among the workers in this group.
7 Consolidated leave plans are offered as a replacement for more restrictive plans such as vacation or sick leave only plans. They have been in existence for many years, but the treatment of these plans by BLS has changed. Previously, days included in these plans were prorated into the leave plans they had replaced.
Publish Date: Thursday, August 01, 2013