An official website of the United States government
 United States Department of Labor
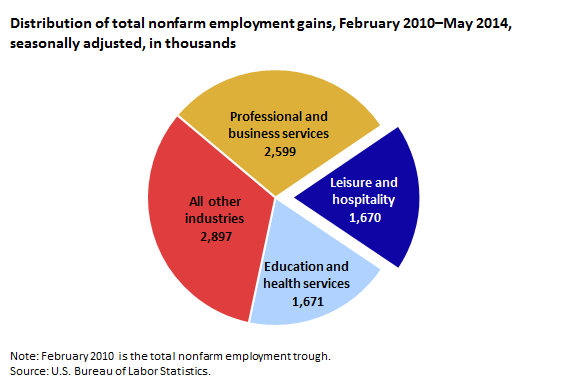
The most recent employment downturn was historic in many ways, but most notably, in the substantial number of jobs lost.1 Data from the Bureau of Labor Statistics Current Employment Statistics (CES)2 survey show that total nonfarm 3 employment fell by 8.7 million jobs between the employment peak in January 2008 and the employment trough in February 2010. In percentage terms, this was the largest job loss since the 1940s.4 Total nonfarm payroll employment did not make a full recovery until May 2014, a full 51 months after its employment low. During this recovery period, the leisure and hospitality industry gained more than 1.6 million jobs, accounting for almost 1 out of every 5 nonfarm jobs added during the recovery. (See chart 1.) Although other industries had similar or larger job gains, the leisure and hospitality industry is interesting because so many of the jobs were created in very few component industries. This Beyond the Numbers article examines recent trends in the leisure and hospitality industry and analyzes the concentrated distribution of job gains.
| Industries | Job Gains | Percent |
|---|---|---|
Professional and business services | 2,599 | 29% |
Leisure and hospitality | 1,670 | 19% |
Education and health services | 1,671 | 19% |
All other industries | 2,897 | 33% |
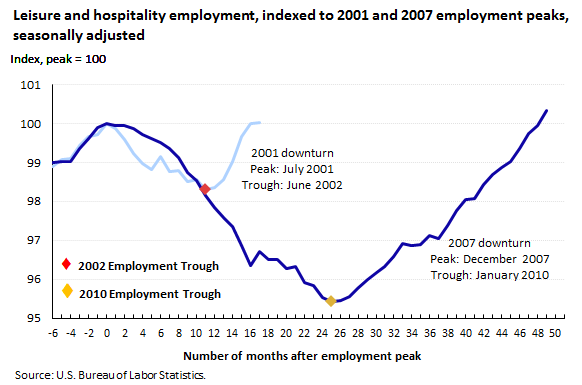
The leisure and hospitality industry tends to follow the employment cycles of total nonfarm employment closely. During the most recent employment downturn, employment in the leisure and hospitality industry peaked in December 2007, 1 month before total nonfarm employment peaked, and it reached its most recent trough in January 2010, also 1 month before total nonfarm.
Before the most recent recession, there was an employment downturn between July 2001 and June 2002. The leisure and hospitality industry employment recoveries in 2002 and 2010 differ in several ways. For many industries, the 2001 employment downturn was shorter than the 2007 downturn and the accompanying job losses were less severe. The leisure and hospitality industry was no exception. It took leisure and hospitality 6 months to recover the 205,000 jobs it lost between its July 2001 peak and its June 2002 trough—a recovery rate of about 17 percent per month. Overall, it took half as long to recover the jobs as it did to lose them. In contrast, it took the leisure and hospitality industry 24 months to recover the 619,000 jobs it lost from the December 2007 peak to the January 2010 trough—a recovery rate of about 4 percent per month. This means that it took about the same amount of time to recover the jobs as it did to lose them. (See chart 2.)
| Number of months after employment peak | 2001 Recession | 2007 Recession | Indexed data | |||
|---|---|---|---|---|---|---|
| Dates | Levels, in thousands | Dates | Levels, in thousands | 2001 | 2007 | |
-6 | Jan 2001 | 11,977 | Jun 2007 | 13,413 | 98.90 | 98.99 |
-5 | Feb 2001 | 11,997 | Jul 2007 | 13,417 | 99.07 | 99.02 |
-4 | Mar 2001 | 12,000 | Aug 2007 | 13,419 | 99.09 | 99.03 |
-3 | Apr 2001 | 12,040 | Sep 2007 | 13,461 | 99.42 | 99.34 |
-2 | May 2001 | 12,068 | Oct 2007 | 13,499 | 99.65 | 99.62 |
-1 | Jun 2001 | 12,076 | Nov 2007 | 13,535 | 99.72 | 99.89 |
0 | Jul 2001 | 12,110 | Dec 2007 | 13,550 | 100.00 | 100.00 |
1 | Aug 2001 | 12,093 | Jan 2008 | 13,542 | 99.86 | 99.94 |
2 | Sep 2001 | 12,061 | Feb 2008 | 13,543 | 99.60 | 99.95 |
3 | Oct 2001 | 12,015 | Mar 2008 | 13,531 | 99.22 | 99.86 |
4 | Nov 2001 | 11,985 | Apr 2008 | 13,511 | 98.97 | 99.71 |
5 | Dec 2001 | 11,967 | May 2008 | 13,498 | 98.82 | 99.62 |
6 | Jan 2002 | 12,006 | Jun 2008 | 13,482 | 99.14 | 99.50 |
7 | Feb 2002 | 11,962 | Jul 2008 | 13,463 | 98.78 | 99.36 |
8 | Mar 2002 | 11,965 | Aug 2008 | 13,431 | 98.80 | 99.12 |
9 | Apr 2002 | 11,928 | Sep 2008 | 13,379 | 98.50 | 98.74 |
10 | May 2002 | 11,936 | Oct 2008 | 13,352 | 98.56 | 98.54 |
11 | Jun 2002 | 11,905 | Nov 2008 | 13,300 | 98.31 | 98.15 |
12 | Jul 2002 | 11,912 | Dec 2008 | 13,256 | 98.36 | 97.83 |
13 | Aug 2002 | 11,936 | Jan 2009 | 13,222 | 98.56 | 97.58 |
14 | Sep 2002 | 11,991 | Feb 2009 | 13,193 | 99.02 | 97.37 |
15 | Oct 2002 | 12,070 | Mar 2009 | 13,127 | 99.67 | 96.88 |
16 | Nov 2002 | 12,109 | Apr 2009 | 13,056 | 99.99 | 96.35 |
17 | Dec 2002 | 12,112 | May 2009 | 13,106 | 100.02 | 96.72 |
18 | Jan 2003 | 12,173 | Jun 2009 | 13,076 | 100.52 | 96.50 |
19 | Feb 2003 | 12,130 | Jul 2009 | 13,078 | 100.17 | 96.52 |
20 | Mar 2003 | 12,109 | Aug 2009 | 13,046 | 99.99 | 96.28 |
21 | Apr 2003 | 12,085 | Sep 2009 | 13,054 | 99.79 | 96.34 |
22 | May 2003 | 12,092 | Oct 2009 | 12,995 | 99.85 | 95.90 |
23 | Jun 2003 | 12,121 | Nov 2009 | 12,986 | 100.09 | 95.84 |
24 | Jul 2003 | 12,143 | Dec 2009 | 12,944 | 100.27 | 95.53 |
25 | Aug 2003 | 12,177 | Jan 2010 | 12,931 | 100.55 | 95.43 |
26 | Sep 2003 | 12,208 | Feb 2010 | 12,933 | 100.81 | 95.45 |
27 | Oct 2003 | 12,259 | Mar 2010 | 12,947 | 101.23 | 95.55 |
28 | Nov 2003 | 12,284 | Apr 2010 | 12,981 | 101.44 | 95.80 |
29 | Dec 2003 | 12,320 | May 2010 | 13,007 | 101.73 | 95.99 |
30 | Jan 2004 | 12,346 | Jun 2010 | 13,031 | 101.95 | 96.17 |
31 | Feb 2004 | 12,372 | Jul 2010 | 13,053 | 102.16 | 96.33 |
32 | Mar 2004 | 12,425 | Aug 2010 | 13,087 | 102.60 | 96.58 |
33 | Apr 2004 | 12,435 | Sep 2010 | 13,132 | 102.68 | 96.92 |
34 | May 2004 | 12,481 | Oct 2010 | 13,125 | 103.06 | 96.86 |
35 | Jun 2004 | 12,495 | Nov 2010 | 13,130 | 103.18 | 96.90 |
36 | Jul 2004 | 12,495 | Dec 2010 | 13,159 | 103.18 | 97.11 |
37 | Aug 2004 | 12,485 | Jan 2011 | 13,149 | 103.10 | 97.04 |
38 | Sep 2004 | 12,550 | Feb 2011 | 13,196 | 103.63 | 97.39 |
39 | Oct 2004 | 12,582 | Mar 2011 | 13,247 | 103.90 | 97.76 |
40 | Nov 2004 | 12,606 | Apr 2011 | 13,286 | 104.10 | 98.05 |
41 | Dec 2004 | 12,630 | May 2011 | 13,290 | 104.29 | 98.08 |
42 | Jan 2005 | 12,665 | Jun 2011 | 13,338 | 104.58 | 98.44 |
43 | Feb 2005 | 12,690 | Jul 2011 | 13,372 | 104.79 | 98.69 |
44 | Mar 2005 | 12,718 | Aug 2011 | 13,396 | 105.02 | 98.86 |
45 | Apr 2005 | 12,802 | Sep 2011 | 13,416 | 105.71 | 99.01 |
46 | May 2005 | 12,797 | Oct 2011 | 13,463 | 105.67 | 99.36 |
47 | Jun 2005 | 12,837 | Nov 2011 | 13,514 | 106.00 | 99.73 |
48 | Jul 2005 | 12,867 | Dec 2011 | 13,542 | 106.25 | 99.94 |
49 | Aug 2005 | 12,891 | Jan 2012 | 13,594 | 106.45 | 100.32 |
50 | Sep 2005 | 12,862 | Feb 2012 | 13,638 | 106.21 | 100.65 |
51 | Oct 2005 | 12,840 | Mar 2012 | 13,703 | 106.03 | 101.13 |
52 | Nov 2005 | 12,884 | Apr 2012 | 13,700 | 106.39 | 101.11 |
53 | Dec 2005 | 12,905 | May 2012 | 13,705 | 106.56 | 101.14 |
54 | Jan 2006 | 12,945 | Jun 2012 | 13,711 | 106.90 | 101.19 |
55 | Feb 2006 | 12,980 | Jul 2012 | 13,739 | 107.18 | 101.39 |
56 | Mar 2006 | 13,034 | Aug 2012 | 13,810 | 107.63 | 101.92 |
57 | Apr 2006 | 13,074 | Sep 2012 | 13,868 | 107.96 | 102.35 |
58 | May 2006 | 13,052 | Oct 2012 | 13,889 | 107.78 | 102.50 |
59 | Jun 2006 | 13,061 | Nov 2012 | 13,921 | 107.85 | 102.74 |
60 | Jul 2006 | 13,130 | Dec 2012 | 13,981 | 108.42 | 103.18 |
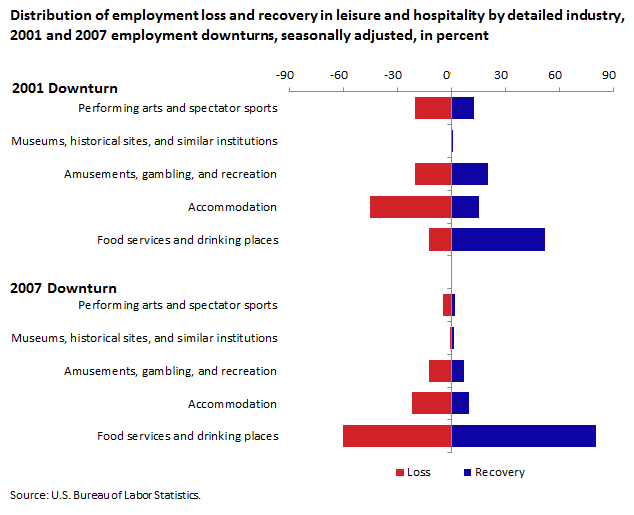
By comparison, the distribution of jobs lost and recovered during and after the 2001 downturn was spread out among different industries. During the 2001 downturn, food services and drinking places accounted for 13 percent of the jobs lost in leisure and hospitality, but 52 percent of the jobs recovered. The remaining components of leisure and hospitality accounted for the majority of jobs lost, but less than half of the jobs recovered. During the 2007 downturn, however, food services and drinking places accounted for the majority of activity on both sides, with 60 percent of the jobs lost and 80 percent of the jobs recovered. (See chart 3.)
| Loss | Recovery | |||
|---|---|---|---|---|
Industry | 2001 | 2007 | 2001 | 2007 |
Performing arts and spectator sports | -21% | -5% | 13% | 2% |
Museums, historical sites, and similar institutions | -1% | -1% | 0% | 1% |
Amusements, gambling, and recreation | -20% | -12% | 20% | 7% |
Accommodation | -46% | -22% | 15% | 10% |
Food services and drinking places | -13% | -60% | 52% | 80% |
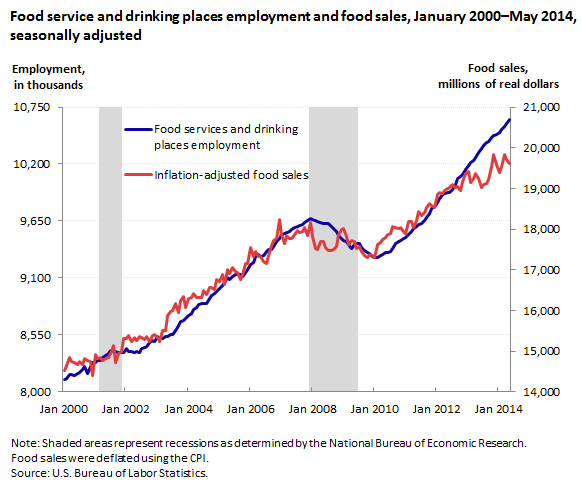
Although retail sales data at food services and drinking places collected by the U.S. Census Bureau are volatile, they track closely with changes in employment.5 On an inflation-adjusted basis, retail sales at food services and drinking places declined briefly in 2001 but recovered very quickly, similar to the employment trends during the same period.6 For the most recent recession, the sales data also show a period of decline from December 2007 through January 2010, followed by a strong period of recovery—again coinciding with trends in employment. (See chart 4.)
| date | Food Sales | CPI | Inflation-adjusted food sales | Food services and drinking places employment |
|---|---|---|---|---|
Jan-00 | 24608 | 169.3 | 14535.1447135263 | 8115.6 |
Feb-00 | 24887 | 170 | 14639.4117647059 | 8125.8 |
Mar-00 | 25367 | 171 | 14834.5029239766 | 8164.6 |
Apr-00 | 25215 | 170.9 | 14754.242246928 | 8170.4 |
May-00 | 25193 | 171.2 | 14715.5373831776 | 8162.5 |
Jun-00 | 25262 | 172.2 | 14670.1509872242 | 8174.6 |
Jul-00 | 25454 | 172.7 | 14738.8535031847 | 8188.4 |
Aug-00 | 25342 | 172.7 | 14674.0011580776 | 8218.3 |
Sep-00 | 25711 | 173.6 | 14810.4838709677 | 8241.4 |
Oct-00 | 25706 | 173.9 | 14782.0586543991 | 8174.8 |
Nov-00 | 25698 | 174.2 | 14752.009184845 | 8243.4 |
Dec-00 | 25133 | 174.6 | 14394.6162657503 | 8283.2 |
Jan-01 | 26180 | 175.6 | 14908.8838268793 | 8283 |
Feb-01 | 26069 | 176 | 14811.9318181818 | 8306.2 |
Mar-01 | 26122 | 176.1 | 14833.6172629188 | 8304.6 |
Apr-01 | 26045 | 176.4 | 14764.7392290249 | 8327.7 |
May-01 | 26278 | 177.3 | 14821.2069937958 | 8354 |
Jun-01 | 26379 | 177.7 | 14844.6820483962 | 8374.7 |
Jul-01 | 26507 | 177.4 | 14941.9391206313 | 8402.8 |
Aug-01 | 26853 | 177.4 | 15136.9785794814 | 8393.9 |
Sep-01 | 26239 | 178.1 | 14732.7344188658 | 8387.7 |
Oct-01 | 26541 | 177.6 | 14944.2567567568 | 8377.8 |
Nov-01 | 26597 | 177.5 | 14984.2253521127 | 8383.4 |
Dec-01 | 27156 | 177.4 | 15307.7790304397 | 8382.5 |
Jan-02 | 27201 | 177.7 | 15307.2594259989 | 8421.4 |
Feb-02 | 27384 | 178 | 15384.2696629213 | 8385.7 |
Mar-02 | 27203 | 178.5 | 15239.7759103641 | 8387.2 |
Apr-02 | 27500 | 179.3 | 15337.4233128834 | 8375.9 |
May-02 | 27378 | 179.5 | 15252.3676880223 | 8389.4 |
Jun-02 | 27586 | 179.6 | 15359.6881959911 | 8376.8 |
Jul-02 | 27616 | 180 | 15342.2222222222 | 8420.3 |
Aug-02 | 27607 | 180.5 | 15294.7368421053 | 8433.1 |
Sep-02 | 27784 | 180.8 | 15367.2566371681 | 8439 |
Oct-02 | 27623 | 181.2 | 15244.4812362031 | 8480.1 |
Nov-02 | 27916 | 181.5 | 15380.7162534435 | 8492.6 |
Dec-02 | 28017 | 181.8 | 15410.8910891089 | 8484.2 |
Jan-03 | 28018 | 182.6 | 15343.9211391019 | 8530.7 |
Feb-03 | 27979 | 183.6 | 15239.1067538126 | 8511.4 |
Mar-03 | 28505 | 183.9 | 15500.2718868951 | 8514.3 |
Apr-03 | 28403 | 183.2 | 15503.8209606987 | 8532.1 |
May-03 | 29048 | 182.9 | 15881.9026790596 | 8535.4 |
Jun-03 | 29230 | 183.1 | 15963.9541234298 | 8551.1 |
Jul-03 | 29395 | 183.7 | 16001.6330974415 | 8557 |
Aug-03 | 29844 | 184.5 | 16175.6097560976 | 8590.2 |
Sep-03 | 29503 | 185.1 | 15938.9519178822 | 8637.1 |
Oct-03 | 30045 | 184.9 | 16249.3239588967 | 8679.2 |
Nov-03 | 30229 | 185 | 16340 | 8691.1 |
Dec-03 | 29795 | 185.5 | 16061.9946091644 | 8712.5 |
Jan-04 | 30341 | 186.3 | 16286.0976918948 | 8737.5 |
Feb-04 | 30461 | 186.7 | 16315.4793786824 | 8753 |
Mar-04 | 30703 | 187.1 | 16409.9412079102 | 8794.5 |
Apr-04 | 30560 | 187.4 | 16307.363927428 | 8816.5 |
May-04 | 30712 | 188.2 | 16318.8097768332 | 8840.5 |
Jun-04 | 30825 | 188.9 | 16318.1577554262 | 8851.7 |
Jul-04 | 31191 | 189.1 | 16494.4473823374 | 8857.4 |
Aug-04 | 31036 | 189.2 | 16403.8054968288 | 8850.9 |
Sep-04 | 31430 | 189.8 | 16559.5363540569 | 8897.6 |
Oct-04 | 31625 | 190.8 | 16574.9475890985 | 8929.8 |
Nov-04 | 31659 | 191.7 | 16514.8669796557 | 8947.8 |
Dec-04 | 32111 | 191.7 | 16750.6520605112 | 8970.2 |
Jan-05 | 32000 | 191.6 | 16701.4613778706 | 8998.7 |
Feb-05 | 32469 | 192.4 | 16875.7796257796 | 9027.2 |
Mar-05 | 32115 | 193.1 | 16631.2791299845 | 9051.8 |
Apr-05 | 32952 | 193.7 | 17011.8740320083 | 9101.4 |
May-05 | 32746 | 193.6 | 16914.2561983471 | 9088.7 |
Jun-05 | 33041 | 193.7 | 17057.8213732576 | 9113 |
Jul-05 | 33056 | 194.9 | 16960.4925602873 | 9135.4 |
Aug-05 | 33229 | 196.1 | 16944.9260581336 | 9144.9 |
Sep-05 | 33316 | 198.8 | 16758.5513078471 | 9128.8 |
Oct-05 | 33618 | 199.1 | 16884.982420894 | 9118.3 |
Nov-05 | 33986 | 198.1 | 17155.9818273599 | 9152.8 |
Dec-05 | 33998 | 198.1 | 17162.0393740535 | 9182.6 |
Jan-06 | 34983 | 199.3 | 17552.9352734571 | 9225.5 |
Feb-06 | 34535 | 199.4 | 17319.4583751254 | 9253.6 |
Mar-06 | 34830 | 199.7 | 17441.1617426139 | 9304.4 |
Apr-06 | 34793 | 200.7 | 17335.8246138515 | 9327.3 |
May-06 | 34877 | 201.3 | 17325.8817685047 | 9309.8 |
Jun-06 | 34729 | 201.8 | 17209.6134786918 | 9317.6 |
Jul-06 | 34802 | 202.9 | 17152.2917693445 | 9355.8 |
Aug-06 | 35367 | 203.8 | 17353.7782139352 | 9374 |
Sep-06 | 35689 | 202.8 | 17598.1262327416 | 9371.5 |
Oct-06 | 35784 | 201.9 | 17723.6255572065 | 9399.7 |
Nov-06 | 35884 | 202 | 17764.3564356436 | 9451.8 |
Dec-06 | 37062 | 203.1 | 18248.1536189069 | 9478.1 |
Jan-07 | 36356 | 203.437 | 17870.8887763779 | 9517.3 |
Feb-07 | 36053 | 204.226 | 17653.4819268849 | 9532.6 |
Mar-07 | 36614 | 205.288 | 17835.4311990959 | 9535.6 |
Apr-07 | 36591 | 205.904 | 17770.9029450618 | 9552 |
May-07 | 36732 | 206.755 | 17765.9548741264 | 9572.3 |
Jun-07 | 37042 | 207.234 | 17874.4800563614 | 9584.2 |
Jul-07 | 37272 | 207.603 | 17953.497781824 | 9593.4 |
Aug-07 | 37189 | 207.667 | 17907.9969374046 | 9602.1 |
Sep-07 | 37427 | 208.547 | 17946.554014203 | 9620.4 |
Oct-07 | 37759 | 209.19 | 18050.0979970362 | 9636.9 |
Nov-07 | 37609 | 210.834 | 17838.2044641756 | 9658.2 |
Dec-07 | 38412 | 211.445 | 18166.4262574192 | 9673 |
Jan-08 | 37823 | 212.174 | 17826.4066285219 | 9662 |
Feb-08 | 37252 | 212.687 | 17514.9397941576 | 9658.8 |
Mar-08 | 37338 | 213.448 | 17492.7851279937 | 9647.9 |
Apr-08 | 37845 | 213.942 | 17689.3737555038 | 9632.4 |
May-08 | 38087 | 215.208 | 17697.7621649753 | 9627.8 |
Jun-08 | 38135 | 217.463 | 17536.3165228108 | 9622.2 |
Jul-08 | 38259 | 219.016 | 17468.5867699164 | 9628.3 |
Aug-08 | 38225 | 218.69 | 17479.079976222 | 9604.9 |
Sep-08 | 38326 | 218.877 | 17510.291168099 | 9572.7 |
Oct-08 | 38129 | 216.995 | 17571.3726122722 | 9547.2 |
Nov-08 | 38063 | 213.153 | 17857.126101908 | 9514.2 |
Dec-08 | 38008 | 211.398 | 17979.3564745173 | 9484.2 |
Jan-09 | 38176 | 211.933 | 18013.2400334068 | 9462.3 |
Feb-09 | 37910 | 212.705 | 17822.806233986 | 9448.1 |
Mar-09 | 37455 | 212.495 | 17626.2970893433 | 9419.4 |
Apr-09 | 37672 | 212.709 | 17710.5811225665 | 9387.7 |
May-09 | 37682 | 213.022 | 17689.2527532368 | 9425.9 |
Jun-09 | 37636 | 214.79 | 17522.2310163415 | 9433.3 |
Jul-09 | 37727 | 214.726 | 17569.8331827538 | 9431 |
Aug-09 | 37585 | 215.445 | 17445.2876604238 | 9398 |
Sep-09 | 37458 | 215.861 | 17352.8335363961 | 9367.6 |
Oct-09 | 37442 | 216.509 | 17293.5074292524 | 9344 |
Nov-09 | 37771 | 217.234 | 17387.2414078827 | 9333.5 |
Dec-09 | 37718 | 217.347 | 17353.8167078451 | 9304.5 |
Jan-10 | 37624 | 217.466 | 17301.0953436399 | 9299.3 |
Feb-10 | 38269 | 217.251 | 17615.1087912138 | 9295 |
Mar-10 | 38382 | 217.305 | 17662.7321046455 | 9312.7 |
Apr-10 | 38582 | 217.376 | 17748.9695274547 | 9325.2 |
May-10 | 38649 | 217.299 | 17786.0919746524 | 9341.7 |
Jun-10 | 38814 | 217.285 | 17863.1750926203 | 9350 |
Jul-10 | 38966 | 217.677 | 17900.834723007 | 9357 |
Aug-10 | 39360 | 218.012 | 18054.0520705282 | 9380.1 |
Sep-10 | 39376 | 218.281 | 18039.1330441037 | 9429.1 |
Oct-10 | 39445 | 219.024 | 18009.441887647 | 9452.4 |
Nov-10 | 39589 | 219.544 | 18032.3761979375 | 9458.8 |
Dec-10 | 39535 | 220.437 | 17934.8294524059 | 9479.2 |
Jan-11 | 39558 | 221.082 | 17892.9085135832 | 9488.5 |
Feb-11 | 40333 | 221.816 | 18183.0886861182 | 9514.9 |
Mar-11 | 40567 | 222.955 | 18195.1514879684 | 9549.5 |
Apr-11 | 40391 | 224.056 | 18027.1896311636 | 9577.9 |
May-11 | 40969 | 224.918 | 18215.082830187 | 9595 |
Jun-11 | 41485 | 224.99 | 18438.5972709898 | 9613.5 |
Jul-11 | 41377 | 225.553 | 18344.6906048689 | 9627.3 |
Aug-11 | 41606 | 226.149 | 18397.6051187491 | 9654.6 |
Sep-11 | 41999 | 226.674 | 18528.3711409337 | 9682.7 |
Oct-11 | 42251 | 226.761 | 18632.3926953929 | 9720.2 |
Nov-11 | 42204 | 227.136 | 18580.9382924768 | 9771 |
Dec-11 | 42067 | 227.093 | 18524.1288811192 | 9793.8 |
Jan-12 | 42916 | 227.666 | 18850.4212311017 | 9831.6 |
Feb-12 | 43124 | 228.138 | 18902.5940439558 | 9863.3 |
Mar-12 | 43159 | 228.732 | 18868.807162968 | 9909.6 |
Apr-12 | 43437 | 229.184 | 18952.893744764 | 9913.2 |
May-12 | 43485 | 228.884 | 18998.7067684941 | 9921.9 |
Jun-12 | 43551 | 228.825 | 19032.4483775811 | 9929.1 |
Jul-12 | 43669 | 228.779 | 19087.8533431827 | 9952 |
Aug-12 | 43734 | 229.952 | 19018.7517394935 | 10003 |
Sep-12 | 44038 | 231.086 | 19056.974459725 | 10059.5 |
Oct-12 | 43879 | 231.652 | 18941.7747310621 | 10075.5 |
Nov-12 | 44334 | 231.19 | 19176.4349669103 | 10097.3 |
Dec-12 | 44772 | 231.099 | 19373.5152467124 | 10146.6 |
Jan-13 | 44890 | 231.321 | 19405.9337457473 | 10180.8 |
Feb-13 | 44554 | 232.599 | 19154.8544920657 | 10216.7 |
Mar-13 | 44650 | 232.075 | 19239.4699989228 | 10235.3 |
Apr-13 | 44900 | 231.707 | 19377.9212539975 | 10267.1 |
May-13 | 44657 | 232.124 | 19238.4242904654 | 10310.1 |
Jun-13 | 44297 | 232.86 | 19023.018122477 | 10346.6 |
Jul-13 | 44518 | 233.252 | 19085.7956201876 | 10382.1 |
Aug-13 | 44638 | 233.433 | 19122.4034305347 | 10406.3 |
Sep-13 | 44939 | 233.743 | 19225.8163880843 | 10419.1 |
Oct-13 | 45680 | 233.782 | 19539.5710533745 | 10453.4 |
Nov-13 | 46393 | 234.033 | 19823.2727863165 | 10475.2 |
Dec-13 | 45937 | 234.594 | 19581.4897226698 | 10487.1 |
Jan-14 | 45540 | 234.933 | 19384.2499776532 | 10503.6 |
Feb-14 | 45922 | 235.169 | 19527.2336064702 | 10535.7 |
Mar-14 | 46708 | 235.64 | 19821.7620098455 | 10565.8 |
Apr-14 | 46583 | 236.254 | 19717.338119143 | 10594.3 |
May-14 | 46488 | 237.083 | 19608.3228236525 | 10627.6 |
Between February 2010 and May 2014, the largest industry in leisure and hospitality, food services and drinking places, added 1.3 million jobs, accounting for 80 percent of leisure and hospitality jobs added over this time. Food services and drinking places contains three major components: special food services, drinking places (alcoholic beverages), and restaurants and other eating places. Virtually all of the job gains in food services and drinking places occurred in restaurants and other eating places, the largest component of the industry. The employment gains in restaurants and other eating places were so strong they accounted for 74 percent of all the jobs gained in leisure and hospitality and 14 percent of all the jobs gained in total nonfarm employment as of May 2014. (See chart 5.) Job losses in restaurants and other eating places accounted for 53 percent of all the job losses within leisure and hospitality and 4 percent of the jobs lost in total nonfarm during the most recent downturn.
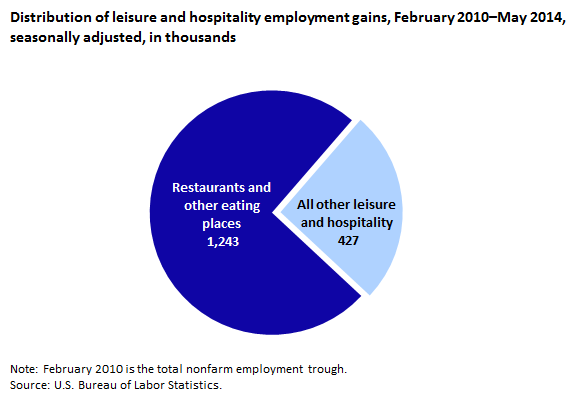
| industry | Recovery Change | Percent of LH |
|---|---|---|
Leisure and hospitality | 1,670 | 100% |
Restaurants and other eating places | 1,243 | 74% |
All other leisure and hospitality | 427 | 26% |
Restaurants and other eating places have gained 1.2 million jobs since the nonfarm employment trough in February 2010. Employment changed little in cafeterias, grill buffets and buffets, and snack and nonalcoholic beverage bars over the period. (See chart 6.) The employment gains were about evenly split between the two largest components of restaurants and other eating places: full-service restaurants (+589,000) and limited-service restaurants (+566,000). Full-service restaurants are defined as establishments that provide food service to patrons who order and are served while seated and pay after eating.7 Limited-service restaurants are defined as establishments that provide food service to patrons who generally order or select items and pay before eating.8
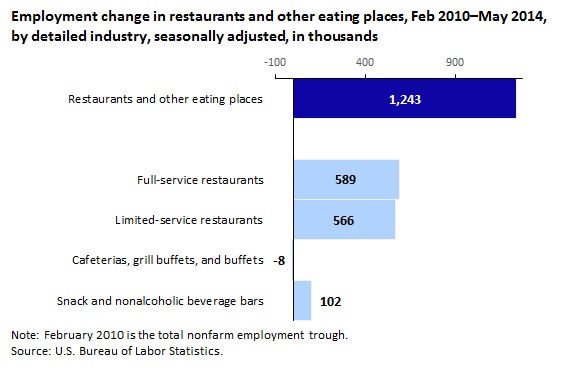
| Industry | Recovery Change |
|---|---|
Restaurants and other eating places | 1,243 |
Full-service restaurants | 589 |
Limited-service restaurants | 566 |
Cafeterias, grill buffets, and buffets | -8 |
Snack and nonalcoholic beverage bars | 102 |
Full- and limited-service restaurants regularly account for a large share of the monthly employment changes in leisure and hospitality. Monthly changes in full- and limited-service restaurants were larger in absolute terms than the remaining components of leisure and hospitality in 35 out of the last 51 months (69 percent of the time). (See chart 7.)
| industries | Jan 2010 | Feb 2010 | Mar 2010 | Apr 2010 | May 2010 | Jun 2010 | Jul 2010 | Aug 2010 | Sep 2010 | Oct 2010 | Nov 2010 | Dec 2010 | Jan 2011 | Feb 2011 | Mar 2011 | Apr 2011 | May 2011 | Jun 2011 | Jul 2011 | Aug 2011 | Sep 2011 | Oct 2011 | Nov 2011 | Dec 2011 | Jan 2012 | Feb 2012 | Mar 2012 | Apr 2012 | May 2012 | Jun 2012 | Jul 2012 | Aug 2012 | Sep 2012 | Oct 2012 | Nov 2012 | Dec 2012 | Jan 2013 | Feb 2013 | Mar 2013 | Apr 2013 | May 2013 | Jun 2013 | Jul 2013 | Aug 2013 | Sep 2013 | Oct 2013 | Nov 2013 | Dec 2013 | Jan 2014 | Feb 2014 | Mar 2014 | Apr 2014 | May 2014 |
|---|---|---|---|---|---|---|---|---|---|---|---|---|---|---|---|---|---|---|---|---|---|---|---|---|---|---|---|---|---|---|---|---|---|---|---|---|---|---|---|---|---|---|---|---|---|---|---|---|---|---|---|---|---|
| Full and limited service restaurants | -1.6 | -3.3 | 15.5 | 10.8 | 16.2 | 3.9 | 13 | 17.4 | 30.8 | 12.4 | 7.8 | 18 | 17.6 | 18.3 | 29.9 | 28.4 | 22.1 | 13.9 | 7.7 | 25.4 | 18.8 | 29.4 | 40 | 23.5 | 38.2 | 18.2 | 45.5 | 12.1 | 0.4 | 20.3 | 19.2 | 23.1 | 46.8 | 22.9 | 17.3 | 41.8 | 31 | 22.2 | 15.2 | 32.2 | 49.6 | 36.2 | 34.2 | 20.2 | 4.5 | 26.9 | 25.7 | 4.1 | 22.1 | 20.6 | 23.2 | 32.1 | 28.4 |
| All other leisure and hospitality | -11.4 | 5.3 | -1.5 | 23.2 | 9.8 | 20.1 | 9 | 16.6 | 14.2 | -19.4 | -2.8 | 11 | -27.6 | 28.7 | 21.1 | 10.6 | -18.1 | 34.1 | 26.3 | -1.4 | 1.2 | 17.6 | 11 | 4.5 | 13.8 | 25.8 | 19.5 | -15.1 | 4.6 | -14.3 | 8.8 | 47.9 | 11.2 | -1.9 | 14.7 | 18.2 | 16 | 27.8 | 18.8 | 0.8 | 3.4 | 14.8 | -11.2 | 13.8 | 4.5 | 38.1 | 11.3 | 13.9 | 2.9 | 14.4 | 7.8 | -0.1 | 16.6 |
Total nonfarm employment has fully recovered from the most recent employment downturn. Despite making up only 8 percent of total nonfarm employment, the food services and drinking places industry has accounted for almost 1 out of every 6 nonfarm jobs added during the recovery. With restaurants leading the job gains within food services and drinking places, this industry is feeding more than its share of job growth during a recovery hungry for jobs.
This Beyond the Numbers summary was prepared by John Coughlan, former economist in the Office of Employment and Unemployment Statistics, U.S. Bureau of Labor Statistics. Email: cesinfo@bls.gov. Telephone: (202) 691-6555.
Information in this article will be made available to sensory-impaired individuals upon request. Voice phone: (202) 691-5200. Federal Relay Service: 1-800-877-8339. This article is in the public domain and may be reproduced without permission.
John Coughlan , “Restaurants help feed job growth: how the leisure and hospitality industry fared after the recent employment downturn ,” Beyond the Numbers: Employment & Unemployment, vol. 3 / no. 16 (U.S. Bureau of Labor Statistics, July 2014), https://www.bls.gov/opub/btn/volume-3/restaurants-help-feed-job-growth.htm
7 The comprehensive North American Industry Classification System (NAICS) definition of full-service restaurants (722511) is available here:
https://www.census.gov/naics/?input=72&chart=2012&details=72.
8 The comprehensive North American Industry Classification System (NAICS) definition of limited-service restaurants (722513) is available here:
https://www.census.gov/naics/?input=72&chart=2012&details=722513.
Publish Date: Monday, July 28, 2014