
An official website of the United States government
An official website of the United States government
The .gov means it's official.
Federal government websites often end in .gov or .mil. Before sharing sensitive information,
make sure you're on a federal government site.
The site is secure.
The
https:// ensures that you are connecting to the official website and that any
information you provide is encrypted and transmitted securely.

More articles and information on unemployment can be found at the following links:
Long-term unemployment over men’s careers
People who are neither working nor looking for work are counted as “not in the labor force,” according to the U.S. Bureau of Labor Statistics. Since 2000, the percentage of people in this group has increased. Data from the Current Population Survey (CPS) and its Annual Social and Economic Supplement (ASEC) provide some insight into why people are not in the labor force. The ASEC is conducted in the months of February through April and includes questions about work and other activities in the previous calendar year. For example, data collected in 2015 are for the 2014 calendar year, and data collected in 2005 are for the 2004 calendar year.1 In the ASEC, people who did not work at all in the previous year are asked to give the main reason they did not work. Interviewers categorize survey participants’ verbatim responses into the following categories: ill health or disabled; retired;2 home responsibilities; going to school; could not find work;3 and other reasons.
This Beyond the Numbers article examines data on those who were not in the labor force during 2004 and 2014 and the reasons they gave for not working. The data are limited to people who neither worked nor looked for work during the previous year.4
The age distribution of the population can strongly influence the overall percentage of the population that is not in the labor force. Chart 1 shows the percent distribution of the civilian noninstitutional population by major age group in 2004 and 2014. For nearly seven decades, the aging of the large “baby-boom” generation—people born between 1946 and 1964—has had a profound effect on the population’s size and composition. In recent years, the baby-boom generation has moved into the 55-years-and-older age group, which historically has had a large proportion of individuals who were not in the labor force. The oldest baby boomers—those born in 1946—reached age 58 in 2004, and in that year people 55 years and older made up 28 percent of the total population. By 2014, people 55 years and older accounted for 34 percent of the total population. The aging of the population has put upward pressure on the percentage of the overall population that is not in the labor force.
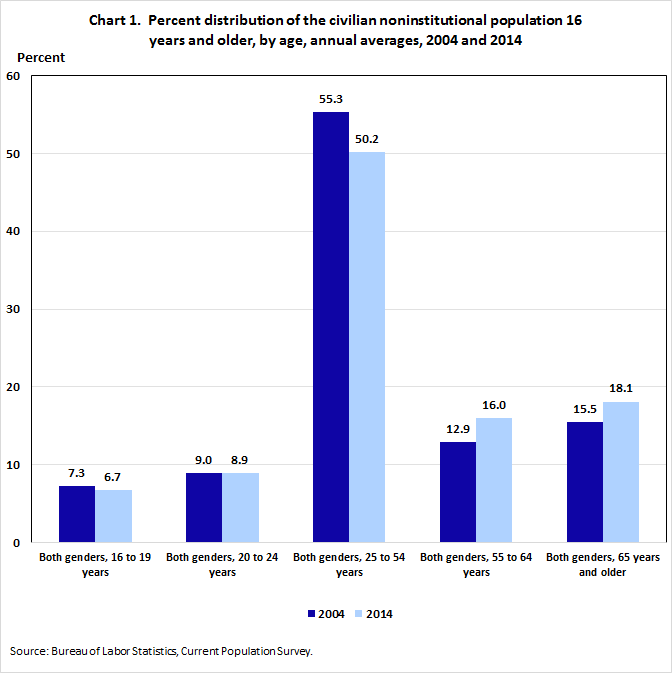
| Population | 2004 | 2014 |
|---|---|---|
| Both genders, 16 to 19 years | 7.3 | 6.7 |
| Both genders, 20 to 24 years | 9.0 | 8.9 |
| Both genders, 25 to 54 years | 55.3 | 50.2 |
| Both genders, 55 to 64 years | 12.9 | 16.0 |
| Both genders, 65 years and older | 15.5 | 18.1 |
In 2014, 87.4 million people 16 years and older neither worked nor looked for work at any time during the year. (See table 1.) Of this group, 38.5 million people reported retirement as the main reason for not working. About 16.3 million people were ill or had a disability, and 16.0 million were attending school. Another 13.5 million people cited home responsibilities as the main reason for not working in 2014, and 3.1 million individuals gave “other reasons.”
| Age and gender | Number | Percent of the total population in the specified age and gender group that was not in the labor force by reason for not working | ||
|---|---|---|---|---|
| 2004 | 2014 | 2004 | 2014 | |
| Both genders, 16 years and over | 70,521 | 87,419 | 31.3 | 35.0 |
| Ill or disabled | 12,394 | 16,309 | 5.5 | 6.5 |
| Retired | 31,322 | 38,530 | 13.9 | 15.4 |
| Home responsibilities | 13,500 | 13,511 | 6.0 | 5.4 |
| Going to school | 11,258 | 16,018 | 5.0 | 6.4 |
| Other reasons | 2,048 | 3,051 | 0.9 | 1.2 |
| Both genders, 16 to 19 years | 8,419 | 10,759 | 51.5 | 64.7 |
| Ill or disabled | 229 | 237 | 1.4 | 1.4 |
| Retired | 33 | 34 | 0.2 | 0.2 |
| Home responsibilities | 423 | 335 | 2.6 | 2.0 |
| Going to school | 7,524 | 9,895 | 46.1 | 59.5 |
| Other reasons | 210 | 258 | 1.3 | 1.6 |
| Both genders, 20 to 24 years | 4,326 | 6,026 | 21.4 | 27.3 |
| Ill or disabled | 431 | 497 | 2.1 | 2.3 |
| Retired | 48 | 132 | 0.2 | 0.6 |
| Home responsibilities | 1,145 | 948 | 5.7 | 4.3 |
| Going to school | 2,294 | 3,866 | 11.3 | 17.5 |
| Other reasons | 408 | 583 | 2.0 | 2.6 |
| Men, 25 to 54 years | 5,644 | 7,058 | 9.2 | 11.5 |
| Ill or disabled | 3,247 | 3,656 | 5.3 | 6.0 |
| Retired | 456 | 661 | 0.7 | 1.1 |
| Home responsibilities | 577 | 763 | 0.9 | 1.2 |
| Going to school | 575 | 1,012 | 0.9 | 1.6 |
| Other reasons | 789 | 967 | 1.3 | 1.6 |
| Women, 25 to 54 years | 13,779 | 15,388 | 21.9 | 24.2 |
| Ill or disabled | 3,048 | 3,623 | 4.8 | 5.7 |
| Retired | 595 | 818 | 0.9 | 1.3 |
| Home responsibilities | 8,987 | 9,120 | 14.3 | 14.3 |
| Going to school | 791 | 1,124 | 1.3 | 1.8 |
| Other reasons | 357 | 703 | 0.6 | 1.1 |
| Both genders, 55 to 64 years | 9,645 | 12,790 | 32.7 | 31.7 |
| Ill or disabled | 3,163 | 5,108 | 10.7 | 12.6 |
| Retired | 4,670 | 5,570 | 15.8 | 13.8 |
| Home responsibilities | 1,595 | 1,654 | 5.4 | 4.1 |
| Going to school | 43 | 79 | 0.1 | 0.2 |
| Other reasons | 174 | 378 | 0.6 | 0.9 |
| Both genders, 65 years and over | 28,708 | 35,398 | 81.5 | 77.0 |
| Ill or disabled | 2,277 | 3,187 | 6.5 | 6.9 |
| Retired | 25,520 | 31,315 | 72.5 | 68.1 |
| Home responsibilities | 772 | 691 | 2.2 | 1.5 |
| Going to school | 30 | 42 | 0.1 | 0.1 |
| Other reasons | 110 | 163 | 0.3 | 0.4 |
|
Note: The "other reasons" category includes people who reported that they could not find work and other unspecified reasons. Source: Annual Social and Economic Supplement to the Current Population Survey. | ||||
Chart 2 presents the self-reported reasons that people who were not in the labor force did not work during 2004 and 2014. It shows the percentage of the total population that was not in the labor force for each specific self-reported reason. The chart illustrates how the reasons for not working changed between 2004 and 2014, a period when labor force nonparticipants’ share of the population 16 years and older grew from 31.3 percent to 35.0 percent. The proportion of people 16 years and older who were not in the labor force and reported school attendance as the main reason for not working rose from 5.0 percent in 2004 to 6.4 percent in 2014. During this period, the share of the population 16 years and older who were not in the labor force and did not work because they were ill or had a disability increased from 5.5 percent to 6.5 percent while the proportion that cited retirement as the main reason for not working rose from 13.9 percent to 15.4 percent. The proportion that cited home responsibilities declined from 6.0 percent in 2004 to 5.4 percent in 2014.
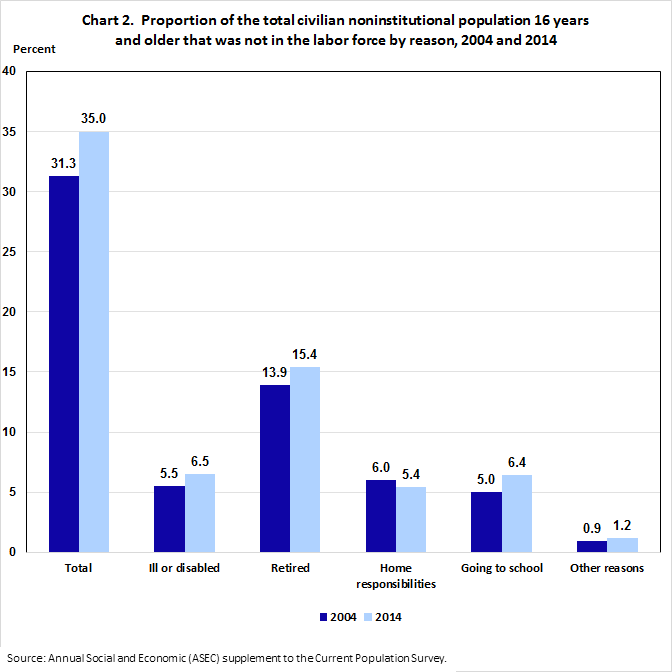
| Population | 2004 | 2014 |
|---|---|---|
| Total | 31.3 | 35.0 |
| Ill or disabled | 5.5 | 6.5 |
| Retired | 13.9 | 15.4 |
| Home responsibilities | 6.0 | 5.4 |
| Going to school | 5.0 | 6.4 |
| Other reasons | 0.9 | 1.2 |
The self-reported reasons that people were not in the labor force varied considerably by age. The percentage of the population 16 to 19 years that was not in the labor force increased from 51.5 percent in 2004 to 64.7 percent in 2014. (See chart 3.) In both years, teenagers cited school attendance most often as the main reason for not working. The proportion of the teenage population that did not work at all during the year because of school attendance rose from 46.1 percent in 2004 to 59.5 percent in 2014. Notably, while the proportion of teenagers who reported school attendance as a reason for not working rose by about 13 percentage points, the percentage of teenagers enrolled in school edged up by 1 percentage point (from 73.6 percent to 74.6 percent).
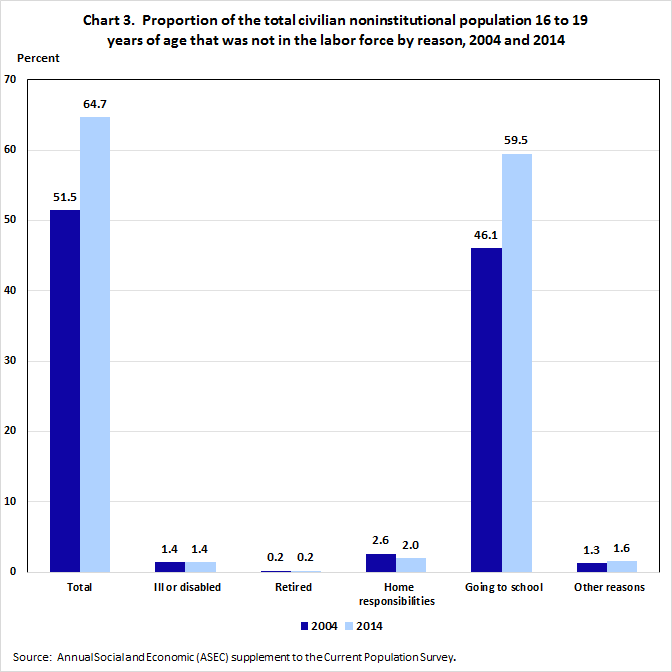
| Population | 2004 | 2014 |
|---|---|---|
| Total | 51.5 | 64.7 |
| Ill or disabled | 1.4 | 1.4 |
| Retired | 0.2 | 0.2 |
| Home responsibilities | 2.6 | 2.0 |
| Going to school | 46.1 | 59.5 |
| Other reasons | 1.3 | 1.6 |
From 2004 to 2014, the percentage of the population 20 to 24 years that was not in the labor force increased from 21.4 percent to 27.3 percent. (See chart 4.) Like teenagers, most young adults cited school attendance as the main reason for not working. The share of the population 20 to 24 years that did not work because of school attendance increased from 11.3 percent in 2004 to 17.5 percent in 2014. As was the case with teenagers, the proportion of young adults enrolled in school also rose from 32.1 percent in 2004 to 34.8 percent in 2014. In both years, young adults were more likely than teenagers to report home responsibilities or illness or disability as the main reason for not working.
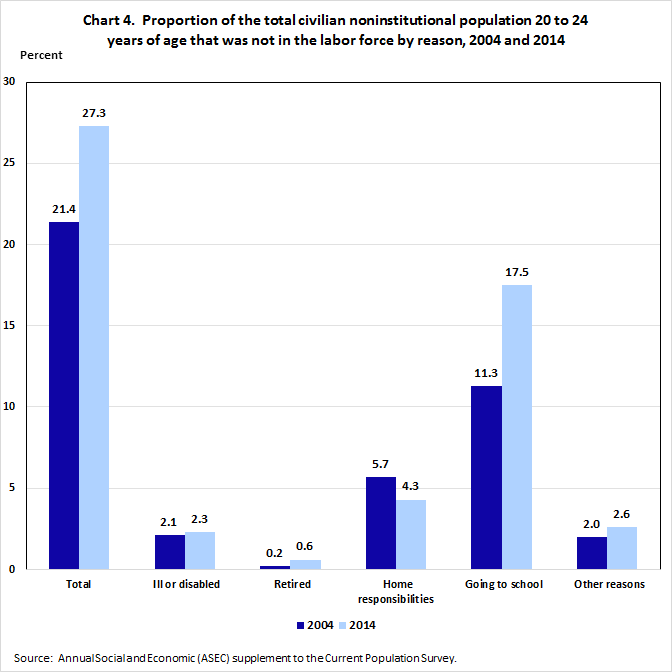
| Population | 2004 | 2014 |
|---|---|---|
| Total | 21.4 | 27.3 |
| Ill or disabled | 2.1 | 2.3 |
| Retired | 0.2 | 0.6 |
| Home responsibilities | 5.7 | 4.3 |
| Going to school | 11.3 | 17.5 |
| Other reasons | 2.0 | 2.6 |
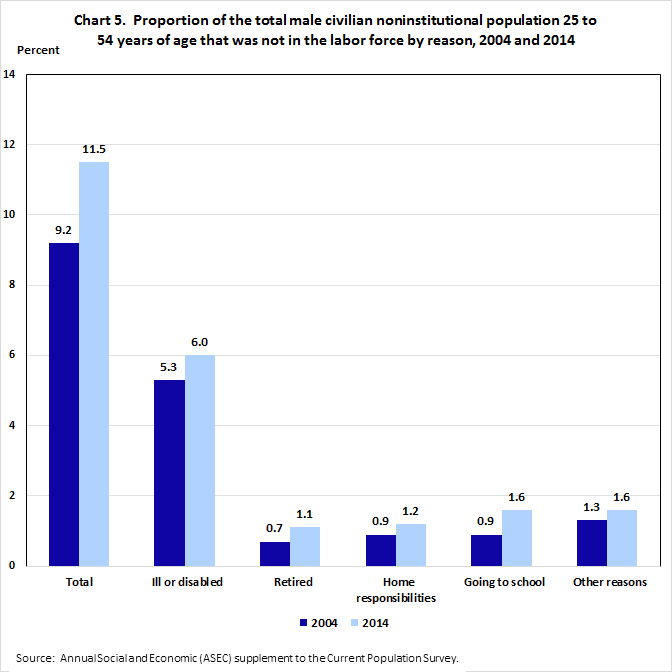
The percentage of people 25 to 54 years who were not in the labor force and their self-reported reasons for not working varied by gender. The proportion of the male population 25 to 54 years that was not in the labor force rose from 9.2 percent in 2004 to 11.5 percent in 2014. (See chart 5.) In both years, the largest share reported illness or disability as the main reason for not working. From 2004 to 2014, the percentage of men 25 to 54 years who did not work because of illness or disability increased from 5.3 percent to 6.0 percent. According to the Social Security Administration, the number of men 25 to 54 years who received Social Security disability benefits rose from 1.8 million (or 2.9 percent of the population in that age group) in 2004 to 2.0 million (or 3.2 percent of the population in that age group) in 2014.5 Another source of data, the Veterans Supplement to the CPS, also showed an increase in the incidence of disability. Among male veterans 25 to 54 years, the number who reported a service-connected disability rose from 726,000 (or 9.3 percent of the veteran population in that age group) in 2003 to 1.2 million (or 19.1 percent of the population in that age group) in 2014. (The CPS Veterans Supplement was not conducted in 2004.) Male veterans who reported a severe disability—that is, a disability rating of 60 percent or more—increased from 134,000 (or 1.7 percent of the population in that age group) in 2003 to 384,000 (or 6.3 percent of the population in that age group) in 2014.6 The percentage of men 25 to 54 years who did not work because of school attendance rose from 0.9 percent in 2004 to 1.6 percent in 2014, while the proportion that cited home responsibilities edged up from 0.9 percent to 1.2 percent.
| Population | 2004 | 2014 |
|---|---|---|
| Total | 9.2 | 11.5 |
| Ill or disabled | 5.3 | 6.0 |
| Retired | 0.7 | 1.1 |
| Home responsibilities | 0.9 | 1.2 |
| Going to school | 0.9 | 1.6 |
| Other reasons | 1.3 | 1.6 |
Among men 25 to 54 years, those with less education were more likely to be labor force nonparticipants than their counterparts with more education. In 2014, 21.2 percent of men with less than a high school diploma did not participate in the labor force, compared with 14.9 percent for high school graduates, 10.7 percent for those with some college or an associate’s degree, and 5.6 percent of male college graduates. (See table 2.) From 2004 to 2014, the increase in labor force nonparticipation was larger for men with less than a college degree. Less educated men were more likely than those with more education to cite illness or disability as the main reason for not working. In 2014, 14.0 percent of men with less than a high school diploma cited illness or disability as the main reason for not working; by comparison, only 1.3 percent of male college graduates gave this reason.
| Educational attainment | Number | Percent of the total population in the specified educational attainment group that was not in the labor force by reason for not working | ||
|---|---|---|---|---|
| 2004 | 2014 | 2004 | 2014 | |
| Total, men, 25 to 54 years | 5,644 | 7,058 | 9.2 | 11.5 |
| Ill or disabled | 3,247 | 3,656 | 5.3 | 6.0 |
| Retired | 456 | 661 | 0.7 | 1.1 |
| Home responsibilities | 577 | 763 | 0.9 | 1.2 |
| Going to school | 575 | 1,012 | 0.9 | 1.6 |
| Other reasons | 789 | 967 | 1.3 | 1.6 |
| Less than a high school diploma | 1,339 | 1,508 | 16.9 | 21.2 |
| Ill or disabled | 951 | 994 | 12.0 | 14.0 |
| Retired | 45 | 71 | 0.6 | 1.0 |
| Home responsibilities | 106 | 149 | 1.3 | 2.1 |
| Going to school | 34 | 103 | 0.4 | 1.4 |
| Other reasons | 202 | 191 | 2.6 | 2.7 |
| High school graduates, no college | 2,302 | 2,751 | 11.5 | 14.9 |
| Ill or disabled | 1,447 | 1,658 | 7.2 | 9.0 |
| Retired | 186 | 220 | 0.9 | 1.2 |
| Home responsibilities | 247 | 324 | 1.2 | 1.8 |
| Going to school | 88 | 120 | 0.4 | 0.6 |
| Other reasons | 333 | 428 | 1.7 | 2.3 |
| Some college or associate's degree | 1,206 | 1,668 | 7.8 | 10.7 |
| Ill or disabled | 630 | 734 | 4.1 | 4.7 |
| Retired | 125 | 204 | 0.8 | 1.3 |
| Home responsibilities | 104 | 155 | 0.7 | 1.0 |
| Going to school | 206 | 364 | 1.3 | 2.3 |
| Other reasons | 140 | 210 | 0.9 | 1.3 |
| College graduates | 798 | 1,133 | 4.5 | 5.6 |
| Ill or disabled | 218 | 271 | 1.2 | 1.3 |
| Retired | 99 | 165 | 0.6 | 0.8 |
| Home responsibilities | 120 | 135 | 0.7 | 0.7 |
| Going to school | 247 | 424 | 1.4 | 2.1 |
| Other reasons | 114 | 138 | 0.6 | 0.7 |
|
Note: The "other reasons" category includes people who reported that they could not find work and other unspecified reasons. Source: Annual Social and Economic Supplement to the Current Population Survey. | ||||
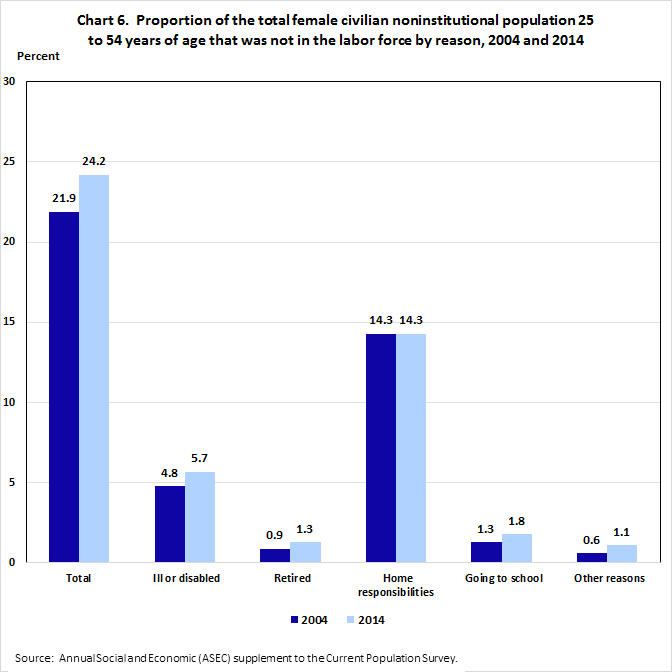
In general, women were more likely than men to be nonparticipants in the labor force. The percentage of women 25 to 54 years who were not in the labor force rose from 21.9 percent in 2004 to 24.2 percent in 2014. (See chart 6.) Unlike men, women most often cited home responsibilities as the main reason for not working: in both 2004 and 2014, 14.3 percent of women 25 to 54 years said they did not work because of home responsibilities. The percentage of women who did not work because of school attendance rose from 1.3 percent in 2004 to 1.8 percent in 2014, while the proportion who did not work because of illness or disability increased from 4.8 percent to 5.7 percent. Social Security Administration data show that the number of women 25 to 54 years who received Social Security disability benefits rose from 1.5 million (or 2.4 percent of the population of women in that age group) in 2004 to 1.9 million (or 3.0 percent of that same population) in 2014.7
| Population | 2004 | 2014 |
|---|---|---|
| Total | 21.9 | 24.2 |
| Ill or disabled | 4.8 | 5.7 |
| Retired | 0.9 | 1.3 |
| Home responsibilities | 14.3 | 14.3 |
| Going to school | 1.3 | 1.8 |
| Other reasons | 0.6 | 1.1 |
As was the case for men, women 25 to 54 years with less education were much more likely than women in the same age group with more education to be labor force nonparticipants. In 2014, 49.6 percent of women with less than a high school diploma were labor force nonparticipants, compared with 15.4 percent of college-educated women. (See table 3.) From 2004 to 2014, the rise in nonparticipation was larger for women with less than a college degree than for women with a college degree or higher. As was the case for men, less educated women were more likely than women with more education to cite illness or disability as the main reason for not working. In 2014, 12.8 percent of women with less than a high school diploma cited illness or disability as the main reason for not working, compared with 1.4 percent of female college graduates. Less educated women were more likely to cite home responsibilities as the main reason for not working: in 2014, 30.7 percent of women with less than a high school diploma, 17.8 percent of high school graduates (but no college), and 11 percent of those with at least some college cited home responsibilities as the main reason for not working.
| Educational attainment | Number | Percent of the total population in the specified educational attainment group that was not in the labor force by reason for not working | ||
|---|---|---|---|---|
| 2004 | 2014 | 2004 | 2014 | |
| Women, 25 to 54 years | 13,779 | 15,388 | 21.9 | 24.2 |
| Ill or disabled | 3,048 | 3,623 | 4.8 | 5.7 |
| Retired | 595 | 818 | 0.9 | 1.3 |
| Home responsibilities | 8,987 | 9,120 | 14.3 | 14.3 |
| Going to school | 791 | 1,124 | 1.3 | 1.8 |
| Other reasons | 357 | 703 | 0.6 | 1.1 |
| Less than a high school diploma | 3,016 | 3,007 | 43.8 | 49.6 |
| Ill or disabled | 872 | 778 | 12.7 | 12.8 |
| Retired | 67 | 110 | 1.0 | 1.8 |
| Home responsibilities | 1,918 | 1,863 | 27.8 | 30.7 |
| Going to school | 86 | 104 | 1.2 | 1.7 |
| Other reasons | 74 | 152 | 1.1 | 2.5 |
| High school graduates, no college | 4,543 | 4,832 | 24.9 | 31.1 |
| Ill or disabled | 1,188 | 1,472 | 6.5 | 9.5 |
| Retired | 256 | 247 | 1.4 | 1.6 |
| Home responsibilities | 2,877 | 2,756 | 15.8 | 17.8 |
| Going to school | 111 | 133 | 0.6 | 0.9 |
| Other reasons | 110 | 224 | 0.6 | 1.4 |
| Some college or associate's degree | 3,289 | 3,888 | 17.9 | 21.3 |
| Ill or disabled | 734 | 1,043 | 4.0 | 5.7 |
| Retired | 142 | 223 | 0.8 | 1.2 |
| Home responsibilities | 1,998 | 2,006 | 10.9 | 11.0 |
| Going to school | 331 | 465 | 1.8 | 2.5 |
| Other reasons | 84 | 151 | 0.5 | 0.8 |
| College graduates | 2,932 | 3,662 | 15.1 | 15.4 |
| Ill or disabled | 254 | 330 | 1.3 | 1.4 |
| Retired | 131 | 238 | 0.7 | 1.0 |
| Home responsibilities | 2,194 | 2,496 | 11.3 | 10.5 |
| Going to school | 263 | 422 | 1.4 | 1.8 |
| Other reasons | 89 | 176 | 0.5 | 0.7 |
|
Note: The "other reasons" category includes people who reported that they could not find work and other unspecified reasons. Source: Annual Social and Economic Supplement to the Current Population Survey. | ||||
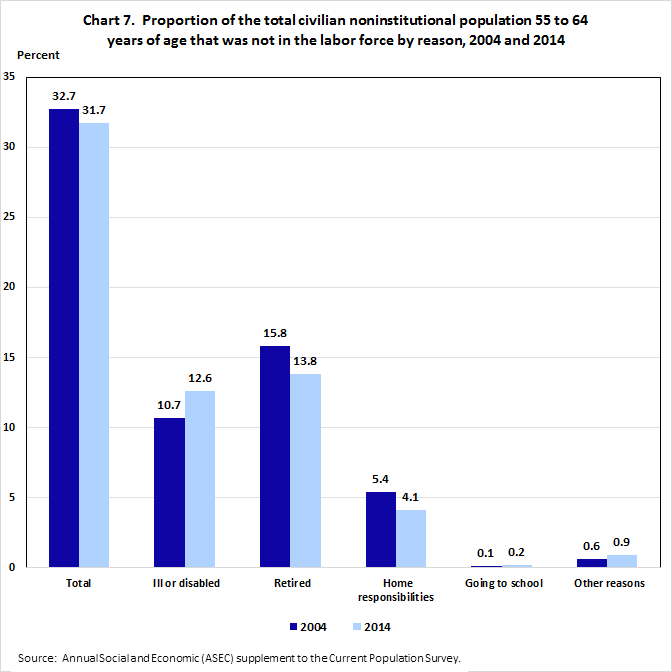
The percentage of the population 55 to 64 years that was not in the labor force edged down from 32.7 percent in 2004 to 31.7 percent in 2014. (See chart 7.) People 55 to 64 were most likely to cite retirement as the main reason for not working. From 2004 to 2014, the number of people 55 to 64 who cited retirement as the main reason for not working rose from 4.7 million to 5.6 million. However, because of strong population growth in that age group, the proportion of people 55 to 64 years who were not in the labor force and cited retirement as the main reason for not working fell from 15.8 percent in 2004 to 13.8 percent in 2014. Although the Bureau of Labor Statistics (BLS) does not produce estimates of retirement age, the Organisation for Economic Co-operation and Development (OECD) estimates that the average effective age of retirement for both men and women rose from 2004 to 2012—from 64.2 to 65.0 years for men and from 63.1 to 65.0 years for women.8 (Data for 2012 are the most recent available.) According to the Employee Benefits Research Institute (EBRI), in 2004, 28 percent of workers 55 years and older expected to retire after age 65, whereas in 2014, 38 percent of workers 55 years and older expected to retire after 65.9 The share of people 55 to 64 who did not work because of home responsibilities declined from 5.4 percent in 2004 to 4.1 percent in 2014, while the percentage who said they did not work because of illness or disability increased from 10.7 percent to 12.6 percent.
| Population | 2004 | 2014 |
|---|---|---|
| Total | 32.7 | 31.7 |
| Ill or disabled | 10.7 | 12.6 |
| Retired | 15.8 | 13.8 |
| Home responsibilities | 5.4 | 4.1 |
| Going to school | 0.1 | 0.2 |
| Other reasons | 0.6 | 0.9 |
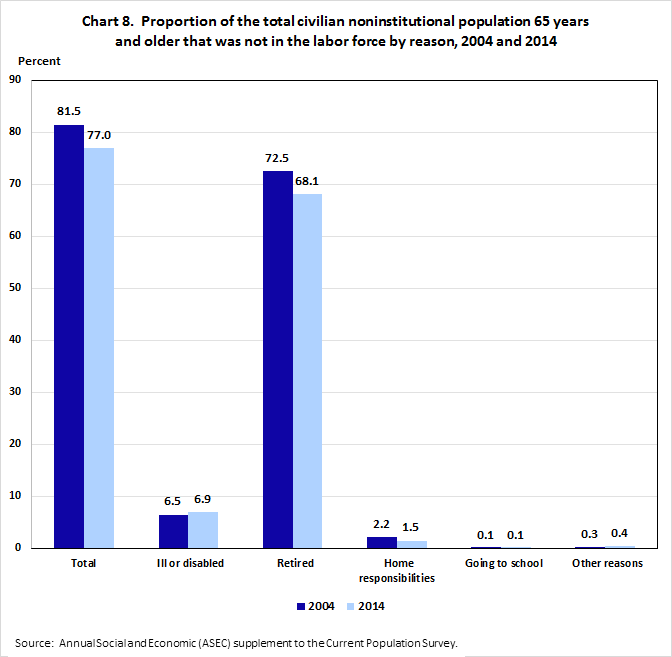
People 65 years and older were more likely than those 55 to 64 to be labor force nonparticipants. The proportion of the population 65 years and older that was not in the labor force declined from 81.5 percent in 2004 to 77.0 percent in 2014. (See chart 8.) Like people 55 to 64, those 65 years and older were most likely to report retirement as the main reason for not working. From 2004 to 2014, the number of people 65 years and older who cited retirement as the main reason for not working increased from 25.5 million to 31.3 million; however, because of strong labor force growth in that age group, the percentage of their population that reported this reason declined. The percentage of people 65 years and older who said they did not work because of retirement fell from 72.5 percent in 2004 to 68.1 percent in 2014. As mentioned above, recent surveys conducted by EBRI have shown an increase in the number of people who plan to delay retirement. The percentage of people 65 years and older who cited home responsibilities as the main reason for not working declined from 2.2 percent in 2004 to 1.5 percent in 2014, while the proportion that did not work because of illness or disability edged up from 6.5 percent to 6.9 percent.
| Population | 2004 | 2014 |
|---|---|---|
| Total | 81.5 | 77.0 |
| Ill or disabled | 6.5 | 6.9 |
| Retired | 72.5 | 68.1 |
| Home responsibilities | 2.2 | 1.5 |
| Going to school | 0.1 | 0.1 |
| Other reasons | 0.3 | 0.4 |
Data from the Current Population Survey (CPS) and its Annual Social and Economic Supplement (ASEC) provide insight into why people who were not in the labor force did not work. From 2004 to 2014, there was an increase in the proportion of the population 16 years and older that was not in the labor force and that cited school attendance, illness or disability, or retirement as the main reason for not working. The percentage of people who were not in the labor force and the reasons they gave for not working varied by age and gender. Among younger people, the percentage not in the labor force rose sharply and the most often cited reason for not working was school attendance. The percentage not in the labor force also rose for both men and women 25 to 54 years, and nearly all reasons cited recorded an increase. Women in this age group were more likely than men to cite home responsibilities as the main reason for not working. Men and women 25 to 54 years with less education were more likely to be labor force nonparticipants than their counterparts with more education. From 2004 to 2014, the increases in the percentage of men and women not in the labor force were larger for those with less education. People with less education were more likely than those with more education to cite illness or disability as the main reason for not working. The proportion of older adults who were not in the labor force declined from 2004 to 2014. Older adults were most likely to cite retirement as the main reason for not working, although the percentage who cited this reason fell. The older adult population saw an increase in the proportion who cited illness or disability as the main reason for not working.
This Beyond the Numbers article was prepared by Steven F. Hipple, Economist in the Office of Employment and Unemployment Statistics, Email:hipple.steve@bls.gov, Telephone: (202) 691-6344.
Information in this article will be made available to sensory-impaired individuals upon request. Voice phone: (202) 691-5200. Federal Relay Service: 1-800-877-8339. This article is in the public domain and may be reproduced without permission.
Steven F. Hipple, “People who are not in the labor force: why aren't they working? ,” Beyond the Numbers: Employment & Unemployment, vol. 4 / no. 15 (U.S. Bureau of Labor Statistics, December 2015), https://www.bls.gov/opub/btn/volume-4/people-who-are-not-in-the-labor-force-why-arent-they-working.htm
4 Respondents who said “no” to the first three questions below were considered to be not in the labor force. The fourth question asked the main reason for not working.
Publish Date: Wednesday, December 30, 2015