
An official website of the United States government
An official website of the United States government
The .gov means it's official.
Federal government websites often end in .gov or .mil. Before sharing sensitive information,
make sure you're on a federal government site.
The site is secure.
The
https:// ensures that you are connecting to the official website and that any
information you provide is encrypted and transmitted securely.
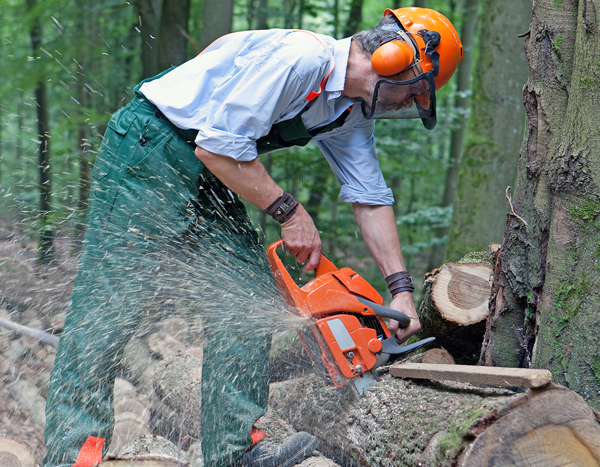
Logging workers deal with a set of working conditions unique among all other occupations.1 Logging jobs are characterized by strenuous work, long hours, seasonal employment, and some of the most hazardous conditions in the workforce.2 Loggers often work many hours at remote locations in harsh weather conditions, with limited access to medical services.3 Thanks to television shows like "Ax Men," "Swamp Loggers," "American Loggers," and "Heli-Loggers," viewers see the hazards these workers face.4 But what do the numbers show? This Beyond the Numbers article examines data from the 2006 to 2015 Census of Fatal Occupational Injuries (CFOI), which are used to describe the fatal work injuries of loggers.
Although this article focuses on fatal occupational injuries, some information about the nonfatal injury and illness experiences of loggers from the Survey of Occupational Injuries and Illnesses (SOII) is presented for context. Nonfatal injury and illness data for logging workers do not include the self-employed, but fatal data do, so data are not directly comparable. This is an important distinction, because 25 percent of all loggers are self-employed.5 Also, as the section heading points out, nonfatal data include illnesses. Fatal data exclude illness-related deaths unless precipitated by an injury event.
Logging workers experienced a total of 8,380 nonfatal injuries and illnesses requiring days away from work over the 2006–2015 period in private industry. The nonfatal rate of injury or illness with days away from work for logging workers in private industry in 2015 was 133.2 per 10,000 full-time equivalent (FTE) workers, which is about 40 percent higher than the private industry rate of 93.9. (See chart 1.) The type of event leading to the nonfatal injury or illness that occurred most often in 2015 was struck by object or equipment (the majority of which were falling objects), followed by fall to lower level. (See chart 2.)
| Year | Incidence rate | Total cases |
|---|---|---|
| 2006 | 265.5 | 1,210 |
| 2007 | 265.9 | 1,280 |
| 2008 | 189.2 | 820 |
| 2009 | 185.2 | 640 |
| 2010 | 196.6 | 660 |
| 2011 | 299.2 | 910 |
| 2012 | 277.8 | 870 |
| 2013 | 238.2 | 770 |
| 2014 | 220.4 | 730 |
| 2015 | 133.2 | 490 |
| Type of event | Percent | Total cases |
|---|---|---|
| Contact with objects and equipment | 49 | 240 |
| Struck against object or equipment | 6 | 30 |
| Struck by falling object | 14 | 70 |
| All other contact | 29 | 140 |
| Fall, slip, trip | 33 | 160 |
| Fall to lower level | 16 | 80 |
| All other falls | 16 | 80 |
| Overexertion and bodily reaction | 14 | 70 |
| All other events | 4 | 20 |
From 2006 to 2015 there were 655 fatal occupational injuries to logging workers. In 2015, there were approximately 51,000 employed loggers who were comprised of fallers, logging equipment operators, log graders and scalers, and all other logging workers.6 Given the relatively small number of workers in this occupation, the incidence and fatality rates tend to be more volatile than for other occupations. Rates in recent years have consistently been well above those of all workers. Logging workers have had one of the highest fatal injury rate of any occupation since 2006. Their rate of fatal injury in 2015 was 132.7, which was more than 30 times the all-worker rate of 3.4 per 100,000 FTE workers.7 From 2006 to 2015, an average of 66 loggers died each year. (See chart 3.)
| Year | Fatal injury rate | Total fatal Injuries |
|---|---|---|
| 2006 | 85.0 | 66 |
| 2007 | 88.9 | 76 |
| 2008 | 119.7 | 85 |
| 2009 | 65.5 | 36 |
| 2010 | 93.5 | 60 |
| 2011 | 104.0 | 65 |
| 2012 | 129.9 | 63 |
| 2013 | 91.3 | 59 |
| 2014 | 110.9 | 78 |
| 2015 | 132.7 | 67 |
White workers and men accounted for most of the fatalities, consistent with the employment profile. The age of those fatally injured is also similar to the age profile of logging workers, with 45- to 54-year-old workers incurring 26 percent of fatalities and representing 29 percent of employment in 2015. Of the 655 logging workers that died from 2006 to 2015, almost 40 percent were self-employed, while the rest were wage and salary workers.
The majority of fatal injuries are due to contact with objects or equipment (79 percent), specifically being struck by falling object.8 (See chart 4.) However, transportation incidents (15 percent) are the second most frequent event leading to fatal injury, which is expected given that logging equipment operators are included in the overall loggers’ category. Falls, slips, and trips only account for 3 percent of fatal occupational injuries to logging workers.
| Type of event | Percent | Total fatal injuries |
|---|---|---|
| Contact with objects and equipment | 79 | 517 |
| Struck by falling object or equipment | 65 | 426 |
| Caught in or compressed by equipment or objects | 4 | 24 |
| All other contact | 10 | 67 |
| Transportation incidents | 15 | 96 |
| Fall, slip, trip | 3 | 18 |
| All other events | 4 | 24 |
As most people would assume, trees are striking the logging workers most often. Of the 655 cases, 74 percent involved trees or logs.9 In 17 percent of the cases (110), a tree or log was both the primary source (the object, substance, exposure, or bodily motion that was responsible for producing or inflicting the disabling condition) and the secondary source (the object, substance, or person, if any, that generated the source of injury or illness or that contributed to the event or exposure), meaning there were 2 separate trees or logs contributing to the workers’ deaths.10
Investigating sources of injury besides the sources involving trees helps us to understand and identify more of the risks faced by loggers. Specialized logging and wood processing machinery were involved in 114 (17 percent) fatal injuries to loggers. Specialized logging and wood processing machinery includes cable and grapple skidders, and were involved in 56 fatalities, forwarder/yarder were involved in 24 fatalities, and log loaders, including heel boom, were involved in 16 fatalities.
Logging is often thought to be more seasonal work. However, the data show that the number of logging fatalities occur year round, with a slight uptick in the summer months. (See table 1.)
| Season of incident | West | Midwest | Northeast | South |
|---|---|---|---|---|
| Spring (March–May) | 27 | 25 | 25 | 66 |
| Summer (June–August) | 53 | 27 | 30 | 99 |
| Fall (September–November) | 40 | 22 | 25 | 54 |
| Winter (December–February) | 31 | 31 | 27 | 71 |
| Note: (1) As defined by census region or census division, see map at https://www2.census.gov/geo/pdfs/maps-data/maps/reference/us_regdiv.pdf. Note the two cases were identified as work- related fatalities but the state where the incident occurred was unable to be determined and are not included in this table. Source: U.S. Bureau of Labor Statistics. | ||||
The states that had at least 30 fatalities each during 2006–2015 were Oregon (52), Tennessee (52), Virginia (38), Washington (37), Pennsylvania (35), Kentucky (34), and New York (31). (See chart 5.)
| State of incident | Percent of fatal injuries |
|---|---|
| Alabama | 3.51% |
| Alaska | 1.37% |
| Arizona | - |
| Arkansas | 2.75% |
| California | 3.66% |
| Colorado | 0.46% |
| Connecticut | - |
| Delaware | - |
| District of Columbia | - |
| Florida | 0.46% |
| Georgia | 1.53% |
| Hawaii | - |
| Idaho | 2.29% |
| Illinois | 0.76% |
| Indiana | 1.07% |
| Iowa | - |
| Kansas | - |
| Kentucky | 5.19% |
| Louisiana | 0.46% |
| Maine | 2.29% |
| Maryland | - |
| Massachusetts | - |
| Michigan | 3.97% |
| Minnesota | 2.14% |
| Mississippi | 3.51% |
| Missouri | 2.44% |
| Montana | 1.07% |
| Nebraska | - |
| Nevada | - |
| New Hampshire | 1.07% |
| New Jersey | - |
| New Mexico | - |
| New York | 4.73% |
| North Carolina | 3.66% |
| North Dakota | - |
| Ohio | 2.14% |
| Oklahoma | - |
| Oregon | 7.94% |
| Pennsylvania | 5.34% |
| Rhode Island | - |
| South Carolina | 2.60% |
| South Dakota | 0.61% |
| Tennessee | 7.94% |
| Texas | 1.83% |
| Utah | - |
| Vermont | 2.60% |
| Virginia | 5.80% |
| Washington | 5.65% |
| West Virginia | 4.43% |
| Wisconsin | 2.60% |
| Wyoming | - |
In summary, logging workers face many distinctive challenges in the workplace, including physically demanding labor, remote locations, and unpredictable weather and terrain conditions. They are also considered a higher risk occupation due a fatality rate substantially higher than the national average.
Reality TV shows continue to document the everyday life of a logger and show the public the conditions and dangers faced by these workers. While the TV shows provide interesting anecdotal information, the BLS data on logging workers provides empirical evidence of the hazards workers face. These data may be used to develop safety protocols and awareness that help reduce the number of workplace fatalities occurring to logging workers.
This Beyond the Numbers article was prepared by Jill Janocha, economist in the Office of Compensation and Working Conditions, Census of Fatal Occupational Injuries program, U.S. Bureau of Labor Statistics. Email: Janocha.Jill@bls.gov, Telephone: (202) 691-6217
Information in this article will be made available upon request to individuals with sensory impairments. Voice phone: (202) 691-5200. Federal Relay Service: 1-800-877-8339. This article is in the public domain and may be reproduced without permission.
Jill Janocha and Caleb Hopler, “The facts of the faller: Occupational injuries, illnesses, and fatalities to loggers 2006–2015 ,” Beyond the Numbers: Workplace Injuries, vol. 7 / no. 5 (U.S. Bureau of Labor Statistics, April 2018), https://www.bls.gov/opub/btn/volume-7/the-facts-of-the-faller-occupational-injuries-illnesses-and-fatalities-to-loggers-2006-2015.htm
1 Logging workers are defined by the Standard Occupational Classification (SOC) System code 45–402.
2 Information on the work environment is from the Occupational Outlook Handbook. For more information, see https://www.bls.gov/ooh/farming-fishing-and-forestry/logging-workers.htm.
3 Sygnatur, Eric. “Logging is Perilous Work,” Compensation and Working Conditions, Winter 1998. https://www.bls.gov/opub/mlr/cwc/logging-is-perilous-work.pdf, p. 5.
4 All shows are Discovery Channel Series, except "Ax Men," which is on the History Channel.
5 Information on the employment profile is from the Occupational Outlook Handbook. For more information, see https://www.bls.gov/ooh/farming-fishing-and-forestry/logging-workers.htm#tab-3.
6 For more information on the employment profile of logging workers, see table 11b at https://www.bls.gov/cps/aa2015/cpsaat11b.pdf. See https://www.bls.gov/soc/2010/2010_major_groups.htm#45-0000 for more details on the occupations that are included in logging workers.
7 See chart 19, “Number of fatal work injuries by employee status, 2003–15” https://www.bls.gov/iif/oshwc/cfoi/cfch0014.pdf, showing selected occupations with high fatal injury rates.
8 CFOI used different event classification systems during the 10-year period, 2006‒2015. From 1992 to 2010, CFOI used the original Occupational Injury and Illness Classification System (OIICS). In 2011, CFOI began using the OIICS, version 2.01. Although data from these two systems are generally not comparable, the authors assume the events and sources discussed in this article are similar enough to aggregate over the time period. For more information on the OIICS, please see: https://www.bls.gov/iif/oshoiics.htm.
9 “Involved” is defined as the primary source or secondary source coded as the specific category. Therefore, a case could involve both trees and logging machinery.
10 Please note that with the OIICS change mentioned in endnote 8, from 2006–2010 trees and logs were coded together and unable to be broken out, from 2011 forward they are separated and codes 5871 and 5872 were used to aggregate, https://www.bls.gov/iif/osh_oiics_2010_2_3_2.pdf.
Publish Date: Tuesday, April 17, 2018