
An official website of the United States government
An official website of the United States government
The .gov means it's official.
Federal government websites often end in .gov or .mil. Before sharing sensitive information,
make sure you're on a federal government site.
The site is secure.
The
https:// ensures that you are connecting to the official website and that any
information you provide is encrypted and transmitted securely.
The Bureau of Labor Statistics (BLS) processes and prepares Consumer Expenditures Survey (CE) microdata for analysis and publication. At a high level, this processing includes ensuring consistency among reported values, identifying and correcting errors (e.g., misclassified expenditures) in the data, imputing missing values (see below), and classifying (or “mapping”) expenditures to BLS spending categories. In addition, the primary statistic calculated is the average annual expenditure per consumer unit (CU). It is a weighted average whose calculation follows well-established statistical principles. BLS computes weights to allow the sample data results to reflect the population, measured in CUs. In addition, BLS adjusts data by adding sales tax, netting out reimbursements, and excluding business-related expenses.
BLS adjusts data to two surveys: Interview Survey and Diary Survey.
BLS completes three major types of CE data adjustment routines: imputation; allocation; and time adjustment. Imputation routines are used for income tax estimation, and to “fill in” or correct missing or invalid entries. Imputation addresses all types of the data (demographics, income, and expenditures) except assets. Allocation routines are used for respondents who provide insufficient detail to meet tabulation requirements. For example, combined expenditures for the fuels and utilities group are allocated among the components of that group, such as natural gas and electricity. Time adjustment routines are used to classify expenditures reported quarterly by month of occurrence, prior to aggregation of the data to calendar-year expenditures.
Two types of data adjustment routines, imputation and allocation, improve the Diary Survey estimates. BLS imputes missing attributes, such as age, sex, or expenditure amount. Allocation routines transform reports of nonspecific items into specific ones. For example, when respondents report expenditures for meat rather than beef or pork, allocations are made, using proportions derived from item-specific reports in other completed diaries. Income tax data are not estimated for the Diary Survey because the published integrated information uses Interview Survey after-tax income information, and because of the limited amount of background detail collected in the Diary Survey.
To publish an accurate estimation of spending for CUs, BLS imputes values for missing or inconsistent data fields. There are four broad types of missing values imputed in the CE: demographic characteristics about the CU and its members; missing values for reported expenditure items; and attributes about a reported expenditure (e.g., whether a car is purchased new or used); and income. Depending on what type of data fields are being imputed, different methods of imputation are used. These methods include:
BLS allocates data to provide information at a sufficient level of detail to meet tabulation requirements. This situation arises when a respondent does not provide the required amount of detail for an expenditure (e.g., the respondent reports “various household appliances” instead of separate reports of a “microwave” and a “blender”). Similar to imputation, BLS uses different methods of allocation dependent on the type of expenditure: distribution ratio, fixed ratio, and probability distribution ratio.
After collecting expenditure data from a representative sample of CUs across the nation, the sample is weighted to produce estimates for the U.S. population of CUs as a whole. For this purpose, each CU in the survey is assigned a weight equal to the number of similar CUs in the nation that it represents.
Several factors are involved in computing the weight of each CU from which a usable interview is received. Each CU is initially assigned a base weight equal to the inverse of its probability of being selected for the sample. The probability is the number of addresses selected for the sample divided by the total number of addresses in the Census Bureau’s master address file. CE base weights are typically around 10,000, which means a CU in the sample represents 10,000 CUs in the U.S. civilian noninstitutional population―itself plus 9,999 other CUs that were not selected for the sample. The base weight is then adjusted by the following factors to correct for certain nonsampling errors:
Weighting control factor adjusts for subsampling in the field. Subsampling occurs when a data collector visits a particular address and discovers multiple housing units where only one housing unit was expected.
Noninterview adjustment factor adjusts for interviews that cannot be conducted in occupied housing units because of a CU’s refusal to participate in the survey or the inability to contact anyone at the housing unit despite repeated contact attempts. This adjustment is based on region of the country, CU size, number of contact attempts, and the average adjusted gross income in the CU’s zip code according to a publicly available database from the Internal Revenue Service.
Calibration factor adjusts the weights to 35 known population counts to account for frame undercoverage. These known population counts are for age, race, household tenure (owner or renter), division of the country, urbanicity (urban or rural), and ethnicity (Hispanic or non-Hispanic). The population counts are updated quarterly using the Current Population Survey (CPS) estimates.1 Each CU is given its own unique calibration factor. There are infinitely many sets of calibration factors that can make the weights add up to the 35 known population counts. BLS uses nonlinear programming to select the set that minimizes the amount of change made to the “initial weights” (initial weight = base weight x weighting control factor x noninterview adjustment factor).
After adjusting the base weights by these factors, the final weights are typically around 25,000, which means an interviewed CU represents 25,000 CUs in the U.S. civilian noninstitutional population―itself plus 24,999 other CUs that did not participate in the survey.
Using these weights, the average expenditure per CU on a particular item is estimated with the standard weighted average formula:
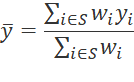
where,


For example, if  is the expenditure on eggs made by the
  CU in the sample during a given time period, then is an estimate of the average expenditure on eggs made by all CUs in the U.S. civilian noninstitutional population during that period.
The precision of the estimator is measured by its standard error. Standard errors measure the sampling variability of the CE estimates. That is, standard errors measure the uncertainty in the survey estimates caused by the fact that a random sample of CUs from across the United States is used instead of every CU in the nation. (See table 1.)
The CE’s standard errors are estimated by using the method of “balanced repeated replication.” In this method, the sampled PSUs are divided into 43 groups (called strata), and the CUs within each stratum are randomly divided into two half samples. Half of the CUs are assigned to one half sample, and the other half are assigned to the other half sample. Then 44 different estimates of are created using data from only one half sample per stratum. There are many combinations of half samples that can be used to create these replicate estimates, and the CE uses 44 of them that are created in a “balanced” way with a 44x44 Hadamard matrix. The standard error of is then estimated by:
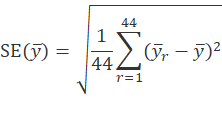
where  is the r th replicate estimate of .
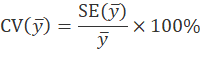
The coefficient of variation is a related measure of sampling variability that measures the variability of the survey estimate relative to the mean. It is defined by the equation:
| Item | Average annual expenditure per consumer unit | Standard error, SE(ȳ) | Coefficient of variation, CV(ȳ) (in percent) |
|---|---|---|---|
| Total expenditures | $63,036 | $578 | 0.92 |
| Food | 8,169 | 119 | 1.45 |
| Housing | 20,679 | 195 | 0.94 |
| Apparel | 1,883 | 69 | 3.64 |
| Transportation | 10,742 | 194 | 1.81 |
| Healthcare | 5,193 | 70 | 1.35 |
| Entertainment | 3,090 | 129 | 4.19 |
| Personal care | 786 | 14 | 1.76 |
| Reading | 92 | 6 | 7.03 |
| Education | 1,443 | 86 | 5.93 |
| Tobacco products and smoking supplies | 320 | 11 | 3.57 |
| Miscellaneous | 899 | 43 | 4.73 |
| Cash contributions | 1,995 | 109 | 5.48 |
| Personal insurance and pensions | 7,165 | 131 | 1.83 |
| Source: U.S. Bureau of Labor Statistics. | |||
Integrated data from the Interview and Diary Surveys provide an approximately complete accounting of consumer expenditures which neither survey component alone is designed to do. For example, most food expenditures in the integrated data tables come from the Diary Survey, which includes detailed items (e.g., rice, strip steak, breakfast purchased from full-service restaurants) not collected in the Interview Survey, while rent, mortgage interest, utilities, and major appliances, which are less likely to be observed during the week of Diary Survey participation, come from the Interview Survey, for which respondents report based on a three-month recall period.
The Interview Survey collects data on expenditures for overnight travel and information on insurance reimbursements for medical care costs and automobile repairs, which are not collected in the Diary Survey. Based on integrated Interview and Diary Surveys data, expenditure data that come exclusively from the Interview Survey, along with global estimates, such as those for food and alcoholic beverages, average about 95 percent of total estimated spending.
For items unique to one or the other survey, the choice of which survey to use as the source of data is obvious. However, there is considerable overlap in coverage between the surveys. Because of the overlap, the integration of the data presents the problem of determining the appropriate survey component from which to select the expenditure items. When data are available from both survey sources, the more reliable of the two is selected, as determined by statistical methods. The selection of the survey source is evaluated every two years. For more information on the source selection process, see the 2011 Anthology article CE source selection for publication tables.
1 The CPS estimates the total number of people in the U.S. civilian noninstitutional population every month, and BLS averages the three monthly population estimates for its quarterly population estimates. The CPS generates its monthly population estimates by taking the Census Bureau’s “official” population estimates from the previous year and updating them to account for the births, deaths, and net migration (immigration minus emigration) that occur each month.