
An official website of the United States government
An official website of the United States government
The .gov means it's official.
Federal government websites often end in .gov or .mil. Before sharing sensitive information,
make sure you're on a federal government site.
The site is secure.
The
https:// ensures that you are connecting to the official website and that any
information you provide is encrypted and transmitted securely.
This section defines key terms and concepts that are central to understanding how the U.S. Bureau of Labor Statistics (BLS) produces measures of productivity.
Productivity is a measure of economic performance that compares the quantity of goods and services produced (real output) with the quantity of inputs used to produce those goods and services.
Productivity statistics are useful for tracking changes in efficiency and in the standard of living and for determining the effects of technological change. Productivity analysis can also provide information on the impact of policy changes and external shocks on industries, geographic areas, and major sectors of the economy. The two primary measures of productivity that BLS publishes are labor productivity and total factor productivity.
Labor productivity is an indicator of economic performance that compares the quantity of goods and services produced (real output) with the number of labor hours worked to produce that output. Labor productivity, or output per hour, is a ratio of real output to hours worked. A change in labor productivity reflects the change in output that is not explained by the change in hours worked. Labor productivity can improve over time for many reasons, including technological advances, improved worker skills, improved management practices, economies of scale in production, and increases in the amount of nonlabor inputs used (e.g., capital, energy, materials, and services).
Total factor productivity (TFP), also known as multifactor productivity (MFP), is an indicator of economic performance that compares the quantity of goods and services produced with the inputs used in their production. These inputs include labor, capital, energy, materials, and services. Thus, TFP growth captures the growth in output that is not specifically accounted for by the growth of measured inputs. The sources of TFP growth include technological changes, efficiency improvements, economies of scale in production, the reallocation of resources, and better management techniques.
The BLS TFP measures are based on the growth accounting model introduced by Robert Solow, combined with more recent index number theory.1
The Solow model starts with a production function  :
:

where
 value-added output
 labor input
 capital input
 current technology.
Note that the technology term  is outside the function in equation (1), which means that technical progress can shift the entire production function and does not favor one factor of production over another. This is also referred to as Hicks-neutral technical change.2 Increases in output that result from additional inputs are reflected by a movement along the production function. Increases in output that result from increased productivity are represented by a shift in the production function.
Solow showed that by taking the derivative of the production function with respect to time, one can calculate the rate of technical change, or total factor productivity growth, as

where
the dot notation above a variable indicates the time derivative (e.g.  for time
the weights represent the output elasticities of the factor inputs as 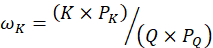 and
and 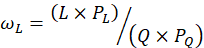
 price of capital
 price of labor
 price of output.
Equation (2) also assumes that:
Output and factor markets are perfectly competitive, such that inputs are paid the value of their marginal products.
The production function exhibits constant returns to scale (CRS), which implies that  .3
.3
However, because the Solow model is continuous, it cannot be applied to actual data covering discrete periods of time. In discrete time, equation (2) can be approximated by:

where  and
and  ,
,  , and
, and  are similarly defined. BLS uses this framework, which is a discrete approximation of the Solow time derivative, along with observed prices and quantities of outputs and inputs.
For estimates of productivity growth within 2-, 3- and 4-digit North American Industry Classification System (NAICS) industries, BLS uses the KLEMS model. KLEMS includes the additional inputs of energy ( ), materials (
 ) and services (
 ). Jorgenson, Gollop, and Fraumeni further showed that TFP is approximated as:

where  is sectoral output and the cost shares (weights) on
  ,
,  , , , and sum to 1.4 To avoid double counting, the intermediate inputs (, , and ) exclude inputs that were produced within the industry. The share weights are defined as:
 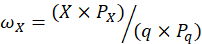 where X is a factor of production. Note that the weights on and in equation (4) are different from the weights on and in equations (2) and (3), because the former equation uses sectoral output while the latter equations use value-added output.
Output is the amount of goods and services produced. Economic output can be measured using several different concepts and definitions. The choice of the output concept for productivity measurement depends on the level of aggregation, the method by which inputs are measured, and the nature of the analysis. Four different definitions of output are used by the BLS productivity program:
Gross output is the total value of goods and services sold. Gross output is currently used only in the retail trade sector and in some other service-providing industries.
Value-added output is the total value of goods and services shipped minus the value of all intermediate inputs (energy, materials and services) used to produce the output. The sum of value-added output across all industries is equal to the gross domestic product (GDP) of the economy. BLS uses value-added output to measure productivity for the business sectors of the U.S. economy. (See economic sectors and industries section below.) Note that a TFP measure that uses a value-added output concept will only include the inputs of capital and labor, as intermediate inputs have been removed.
Sectoral output is the total value of goods and services produced minus the value of intermediate inputs produced within the industry or sector being measured. Sectoral output is equal to deliveries to consumers outside the industry or sector. The subtraction of intrasectoral transactions avoids double counting materials that establishments provide to other establishments in the same industry or sector.5 For detailed industries, most inputs come from outside the industry; thus, the values of sectoral and gross output are similar. For more aggregated sectors, most inputs come from within the sector; thus, sectoral output is closer to value-added output. BLS uses sectoral output for most of its industry productivity measures.
Gross margin output is an alternative output concept used for the retail trade sector and experimental retail industry measures. Gross margin output is the value of sales minus the cost of goods sold. By subtracting the cost of goods sold, gross margin output measures the services provided to retail customers.
Labor hours worked is the total number of hours worked by all workers, including paid employees, the unincorporated self-employed (partners and proprietors), and unpaid family workers (those who work at a family business or farm without pay). Labor hours worked include all hours spent on actual production of goods and services, as well as time that is incidental to production, such as paid time for traveling between job sites, coffee breaks, and machine downtime. Paid vacations and other forms of paid leave are benefits rather than time available for production and are not included in measured hours for productivity analysis.
Whereas labor hours worked treats all hours equally, labor input accounts for the skills and experience of different types of workers (labor composition). This is achieved by cost-share weighting the hours of different groups of workers based on their characteristics of age, sex, education, and class of worker (wage and salary or self-employed).
When estimating TFP growth for business sectors and major industries, BLS accounts for changes in the composition of the workforce (labor composition). With the addition of labor composition, labor in equation (3) becomes approximately the sum of the growth of hours worked ( ) and the growth of labor composition (
 ). Thus, TFP growth becomes:

Capital input, also known as capital services, is the flow of services supplied by physical capital assets (e.g., equipment, structures, inventories, and land) and intangible capital assets (e.g., research and development, artistic originals, and software) used to produce output. Financial capital is not included in these measures.
Capital differs from other inputs in three important ways:
BLS estimates the flow of capital input in three steps. First, data on investment and asset service lives (estimated lifespans of capital assets) are used to estimate the productive capital stock. Next, the rental rate of capital is calculated. Finally, the value of capital input is calculated as the productive capital stock times the rental rate.
The productive capital stock is measured using the perpetual inventory method, which sums all past capital asset investments minus deterioration. According to an age-efficiency function, past investments are assumed to decline in productive capacity as they reach their maximum service life. The age-efficiency function represents the proportion of the investment's original productive capacity that remains at every age. The productive capital stock for a category of identical assets with the same maximum service life is the sum of investments from the current year and all prior years, where each investment is multiplied by the proportion of the original productive capacity that remains. Thus, the age-efficiency function is equal to 1 when the asset is new and declines to 0 when the asset reaches the end of its service life. BLS assumes a hyperbolic age-efficiency function, which implies that the assets deteriorate slowly at first and more rapidly as they age.
The age-efficiency function accounts for three avenues by which the productive capacity of a category of assets can decline. First, assets become physically less productive when used or requiring more downtime for maintenance or repairs. The second avenue is through obsolescence. The third is through failure, when an increasing fraction of the assets in the asset category no longer work each period. With all three of these avenues, one would expect the age-efficiency function for an individual asset to be concave with respect to age. Thus, even a category of one-hoss-shay assets would have a downward sloping age-efficiency function.6
The age-efficiency function assumes that all assets in an asset category have identical maximum service lives. However, assets within an asset category likely have different maximum service lives because the assets are heterogeneous and can be used differently. Therefore, BLS assumes a distribution of maximum service lives for each asset category and computes a cohort age-efficiency function that is a weighted average of the deterioration functions of the individual asset types.7
The final capital stock for each industry by asset-category combination is estimated using the more flexible cohort age-efficiency function, rather than the function with only one asset type. The maximum service life among all assets is used when summing up all previous investments to calculate the stock.
The rental price of capital, or the user cost of capital, is the opportunity cost of holding and using capital assets for a period of time. The equilibrium rental price is equal to the foregone earnings invested in the asset plus the decline in the asset s value. In its simplest form, the rental price for a period is the price of the asset multiplied by the sum of the rate of depreciation and the appropriate rate of return for the asset. Ideally, this measures the possible return if resources were directed to their next best use, rather than to the capital asset. The method BLS uses to construct rental prices of capital is somewhat more complicated. In addition to accounting for depreciation and the rate of return, the method accounts for inflation in new asset prices and various tax effects. Rental prices are computed separately for each asset category by industry combination.
BLS calculates the wealth stock to estimate the depreciation rate of wealth stock. The wealth stock differs from the productive capital stock in that it measures the financial value of the capital stock rather than its productive capacity. Analogously, depreciation differs from deterioration in that it measures the decline in the financial value of the capital stock rather than the decline in its productive capacity. However, the two measures are linked through the age-efficiency function. The main difference between the productive capital stock and the wealth stock is that the productive stock is a point-in-time measure (the current productive capacity of past investments), whereas the wealth stock is a forward-looking measure (the discounted value of the remaining productive capacity of the productive capital stock). The wealth stock is the age-adjusted price of the asset multiplied by real investment and summed over all asset cohorts that have positive productive capacity at time . The asset price reflects the use of the asset for a certain number of years and the expected remaining productivity through its service life. The age-price function is derived from the cohort age-efficiency function and is equal to the discounted value of the remaining productive capacity of the asset divided by the discounted value of the productive capacity of the asset over its entire service life. The age-price function declines over time from 1, when the asset is new, to 0 at the end of its service life. It declines more quickly than the age-efficiency function because the financial value of an asset declines due to a decrease in its remaining service life even if its productive capacity does not.
The rate of return used to calculate the rental price of capital can be either an internal or external rate of return.8 The starting point for the calculation of the internal rate of return is to note that capital income is defined as the product of the productive capital stock and the rental price of capital within an industry. By rearranging the terms within the product, we solve for a rate of return that is a complex function of the productive capital stock; current and past capital prices; the asset depreciation rate; and various tax rates, deductions, and credits.
In addition to labor and capital inputs, energy, materials, and services are used to produce output. Grouped together, energy, materials and services are referred to as intermediate inputs. Energy includes electricity, oil, fuels, natural gas, and petroleum (for most industries). Materials include agricultural and manufactured commodities, such as crops, timber, stone, textiles, chemicals, steel, and cement. Services include water and sewage services; finance and insurance services; professional, scientific, and technical services; and waste management and remediation services. Intermediate inputs include both foreign and domestically sourced energy, materials, services, and semi-finished goods.
Combined inputs represent the aggregation of inputs that are used to produce output. When a value-added output measure is used, combined inputs include the primary inputs of labor and capital. When a sectoral or gross output measure is used, combined inputs include the intermediate inputs of energy, material, and services, in addition to labor and capital.
Productivity is measured at different levels of aggregation. The most aggregated sectors for which BLS produces labor productivity data are the business sector and the nonfarm business sector of the U.S. economy. These productivity measures are indicative of how efficiently most of the economy is operating, allowing for comparisons both over time and with other countries. The U.S. Bureau of Economic Analysis (BEA) calculates business value-added output by removing the gross output of general government, households, and nonprofit institutions serving households from GDP. Output for these three sectors is estimated primarily using labor compensation data. The trends in such output measures will move with measures of input data and tend to imply little or no productivity growth. Thus, BLS excludes these activities from aggregate value-added output to remove potential sources of bias specific to productivity growth measurement.
The measure of business sector output used by BLS to measure productivity also excludes the value added of owner-occupied housing and the rental value of buildings and equipment owned and used by nonprofit institutions serving individuals. These components are excluded because no adequate corresponding labor input measures can be developed.
To measure aggregate total factor productivity, BLS restricts output to the U.S. private business sector, which excludes the output of government enterprises from business output. These enterprise data are removed because subsidies account for a substantial portion of capital income. It is important to note that any adjustments to the scope of output must also be reflected in the inputs to production. For example, if the output of nonprofit establishments is not included in the business sector, then the labor and capital used by nonprofit establishments should not be used to estimate productivity.
Productivity measures are also calculated for industries, industry groups, and subsectors. Measures of industry productivity are useful for determining the effects of efficiency improvements in particular industries. Individuals and companies may also use these data as benchmarks to judge how their firms perform compared with their respective industry. In addition, industry productivity trends help researchers and policymakers better understand industry and sector contributions to more aggregate productivity growth.
At the industry level, BLS uses the sectoral output concept. Sectoral output is close to gross output at the most detailed industry level because nearly all inputs are purchased from other industries.
Productivity is also measured at the state level for the private nonfarm sector. Annual estimates of output and hours worked are used to create productivity data for each state and the District of Columbia. These data can be used in the study of regional and state growth patterns and in analyses of state wage growth and inequality. Comparisons across states can inform discussions regarding the impact of state-level economic regulation and taxes. Likewise, the migration of workers and employers across states can both influence and be driven by productivity growth. However, measuring productivity at the state level can be difficult because a portion of a state’s economy may extend beyond its borders.
Real value-added output for each state and the District of Columbia is constructed at the private nonfarm level. BEA publishes GDP by state and industry. For nonfarm goods-producing industries, state output is estimated using industry value-added data by establishment location. For service-producing industries, state output is measured as the sum of state-level labor income, capital income, and business taxes minus subsidies. These output data are adjusted by subtracting out the state-level output of the farm sector, the output of private households, and the value of owner-occupied housing. Constant dollar value-added output is calculated by using detailed-industry price indexes and applying them to industry current dollar output at the state level.
TFP was developed to help understand sources of labor productivity growth. The relationship between TFP and labor productivity (LP) can be seen by rearranging the terms in equation (5):

In words, labor productivity growth is approximately equal to TFP growth plus the capital-weighted growth in the capital-to-labor ratio
( or capital deepening) plus the labor-input-weighted growth in labor composition.
Unit labor costs measure the total labor costs per unit of output produced. Unit labor costs describe the relationship between labor productivity and compensation per hour and are indicators of inflationary pressure on producers. Increases in hourly compensation increase unit labor costs, whereas increases in labor productivity offset compensation increases and lower unit labor costs.
Unit nonlabor costs measure the total nonlabor costs per unit of output produced. Nonlabor costs can include consumption of fixed capital, taxes on production and imports (minus subsidies), net interest and miscellaneous payments, and business current transfer payments. The total cost per unit of output is the sum of unit labor costs and unit nonlabor costs.
1 Robert M. Solow, “Technical change and the aggregate production function,” The Review of Economics and Statistics, vol. 39, no. 3 (August 1957), pp. 312–20.
2 Ibid.
3 Solow described the residual as representing technical change. However, the residual can include other factors, such as improved management practices and economies of scale. The output elasticity is the percentage change in output that results from a 1-percent change in an input.
4 Dale W. Jorgenson, Frank M. Gollop, and Barbara M. Fraumeni, Productivity and U.S. Economic Growth, (Cambridge, MA: Harvard University Press, 1987) and Susan Fleck, Steven Rosenthal, Matthew Russell, Erich H. Strassner, and Lisa Usher, “A prototype BEA/BLS industry-Level production account for the United States,” Survey of Current Business, vol. 92, no. 11 (November 2012), pp. 44–50.
5 See Thomas Kovarik and Jerin Varghese, “Intrasectoral transactions: the most important productivity statistic you’ve never heard of,” Monthly Labor Review, September 2019, https://www.bls.gov/opub/mlr/2019/article/intrasectoral-transactions-the-most-important-productivity-statistic-you-never-heard-of.htm for details about how these are measured.
6 A one-hoss-shay asset provides the same productivity over its lifetime before failure.
7 Because average maximum service lives are estimates and there are no data about individual asset types with categories, the distribution can also be viewed as accounting for the uncertainty, as well as heterogeneity.
8 The internal rate of return on an asset is the return implied by the zero-profit condition and is calculated at the industry level. The external rate of return is calculated the same way but for the aggregate sector (all industries in the sector).