
An official website of the United States government
An official website of the United States government
The .gov means it's official.
Federal government websites often end in .gov or .mil. Before sharing sensitive information,
make sure you're on a federal government site.
The site is secure.
The
https:// ensures that you are connecting to the official website and that any
information you provide is encrypted and transmitted securely.
Crossref 0
Dispersion in Dispersion: Measuring Establishment‐Level Differences in Productivity, Review of Income and Wealth, 2023.
Estimating intrasectoral transactions prevents double counting and is a critical part of accurate sectoral output measurement.
“In theory, there is no difference between practice and theory, while in practice there is.”
—Benjamin Brewster, The Yale Literary Magazine, October 1881–June 1882
Productivity measurement is, in theory, a simple science. Dividing a measure of output by a measure of inputs yields a measure of the efficiency with which inputs are transformed into outputs. In practice, however, productivity measurement is a complex endeavor. Exactly what outputs are we trying to measure? And what exact inputs are being transformed? Small details in how these questions are answered can strongly influence the resulting conclusions.
In estimating its manufacturing productivity measures, the U.S. Bureau of Labor Statistics (BLS) calculates intrasectoral transactions, which are transactions between businesses operating in the same industry or sector. Intrasectoral transactions are excluded from the sector’s output. In the same way that parents paying an allowance to their children does not increase the family’s overall income—because the transaction occurred inside the family—intrasectoral transactions do not increase a sector’s output, because the transaction occurred within the sector, rather than across its sectoral boundary.
Intrasectoral transactions are substantial, so it is important that they be accounted for in productivity measures. Approximately 30 percent of gross manufacturing output in the United States consists of intrasectoral transactions.1 If we failed to account for intrasectoral transactions, the manufacturing output measurement (and, ultimately, the measure of manufacturing productivity) would be upwardly biased.
Despite their importance, intrasectoral measurements rarely make it into the financial headlines. In this article, we explain why intrasectoral adjustments are necessary and how the adjustments are made. In addition, we describe recent improvements in the calculation process used by BLS to produce these measures.
BLS measurement of manufacturing output is based on sectoral output. Other output concepts exist, such as gross output and value-added output. Each output concept is valuable for certain purposes. Gross output is the simplest kind of output to measure. Gross output is the summed output of all the establishments in the group being measured. It is the easiest to measure because gross revenues are typically captured in government surveys of industry. To avoid double-counting issues, value-added and sectoral output concepts remove the value of certain inputs. While value-added output removes the value of all purchased inputs (such as energy, materials, and purchased services) regardless of which industry produces them, sectoral output removes only the value of inputs produced within the same industry or sector.
To illustrate, let us consider a small economy as represented in figure 1.

| Total Manufacturing | Final demand | |||
|---|---|---|---|---|
| Synthetic dye manufacturing | Textile mills | Furniture manufacturing | Consumer | |
| Yarn mills | Fabric mills | |||
| Synthetic dye ($20) > | Dyed yarn ($50; $30, direct to consumer) > | Woven cloth ($100) > | Cloth sofa ($500) > | |
| Source: U.S. Bureau of Labor Statistics. | ||||
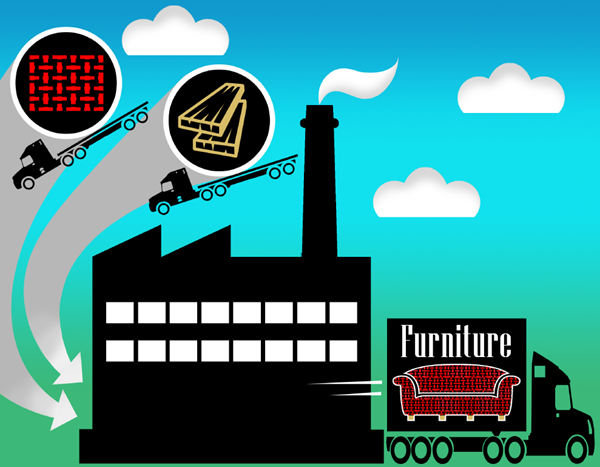
In this small economy, a dye manufacturer supplies a yarn maker. The yarn maker sells some yarn to everyday consumers, and some to a weaver. The weaver uses the yarn to make cloth, which is sold to a furniture maker. Finally, the furniture maker uses the cloth in producing sofas, which are then sold to consumers.
What is the output of the textile mills subsector, which includes both yarn mills and fabric mills? If we were using a gross-output concept, we would simply sum all outputs from the industries in the subsector: $30 + $50 + $100 = $180 of economic activity. Notice, however, that the gross-output concept applied to our hypothetical economy has a double-counting problem. Some of the yarn cost is counted twice: first, as the yarn is sold to woven cloth producers as an intermediate material, and then again as its embedded cost is passed on to the furniture manufacturer. The cost of the dye, which does not even originate from within the textile mills subsector, is also counted as gross textile mills output twice, as it is embedded in the price of the yarn and that of the cloth. As a result of this double counting, in terms of productivity, the gross output measure overstates output.
If we were using a value-added output concept for textile mills, we would begin with the gross output figure and then deduct all outputs that were used as intermediate inputs. In this case, we deduct the $20 cost of the dye, because it was used by the yarn maker and then embedded in the yarn maker’s price. We would also deduct the $50 of yarn that went into cloth, but not the $30 of yarn that went to the consumer as final demand. Our final value-added output for textile mills is $180 – $20 – $50 = $110 worth of value created.
Sectoral output for textile mills is the total gross outputs within the industry, minus the inputs generated from within the textile mills subsector only. Sectoral output for textile mills in this example (containing yarn mills and fabric mills) is the gross output minus the value of the yarn, which originates in the textile mills subsector: ($50 + $30 + $100) – $50 = $130. Sectoral output can also be thought of as the output exiting the sector or subsector under consideration. Notice that we did not deduct the cost of the dye, which originated from outside the textile mills subsector. We also did not deduct the $30 worth of yarn that was sold to final demand, rather than being redirected back into manufacturing as an intermediate input.
Because sectoral output deducts only inputs originating from within the subsector, it has a lower bound equal to the value-added output (when all inputs originate from within the sector), and an upper bound equal to gross output (when no inputs originate from within the sector). Sectoral output equals gross output at the establishment level and converges to value-added output at the total economy level.2 As a result, sectoral output provides a bridge between the gross-output concept and the value-added concept, allowing us to examine the economy at different levels of detail while preventing double-counting issues. The sectoral output measure remains the only estimate that is useful at both the detailed industry level and the aggregate economy level.
To compute sectoral output, we need to remove intrasectoral transaction costs from gross output measures. The sectoral boundaries that we use are defined in the North American Industry Classification System (NAICS). Establishments are grouped into industries based on their primary business activity, with each industry assigned a six-digit code. Similar industries are grouped into subsectors, which are grouped into sectors. As these classifications become broader, the number of digits in their assigned code decreases. The broadest NAICS code level for manufacturing industries is at the two-digit level, known as NAICS sector 31–33. To illustrate the hierarchical NAICS classification system, figure 2 shows a partial diagram of the three-digit NAICS subsector 311.

| NAICS 311 Food manufacturing | |||||
|---|---|---|---|---|---|
| 3112 Grain and oilseed milling | 3113 sugar and confectioneries | 3118 Bakeries | 3119 Other food manufacturing | ||
| 311230 Breakfast cereals | 311313 Beet sugar | 311351 Chocolate and confectioneries | 311813 Cakes, pies, and pastries | 311821 Cookies and crackers | 311999 Other miscellaneous foods (including corn syrup) |
| Source: U.S. Bureau of Labor Statistics. | |||||
Transactions that may be external to the sector at a more detailed NAICS level may be intrasectoral at a broader NAICS level. In figure 2, transactions between beet sugar producers and chocolatiers are intrasectoral at the level of the sugar and confectioneries industry, since they share a common three- and four-digit hierarchy. Transactions between beet sugar producers and breakfast cereals producers are not intrasectoral at the level of the sugar and confectioneries industry—they are in separate four-digit industries—but they are intrasectoral at the food manufacturing level and above. Intrasectorals can also be calculated at levels even more general than three-digit specificity, such as at the levels of durable goods manufacturing, nondurable goods manufacturing, and total manufacturing.
Therefore, the volume of sectoral output depends on both the volume of transactions between industries and the level of detail at which we are examining the output. Because of the nature of the NAICS hierarchy, two industries are more likely to share a broad sector, such as food manufacturing, than to share a more detailed sector, such as bakeries. This means that total intrasectorals at broad levels, such as three-digit subsectors, exceed total intrasectorals at more specific levels, such as the four- or six–digit level.
To illustrate this behavior varying by NAICS level, let us again consider the U.S. beet sugar industry (NAICS 311313). In 2012, this industry had a gross output of $4.75 billion. When we examine beet sugar as a stand-alone industry, its sectoral output of $4.75 billion is identical to the gross output of $4.75 billion, because beet sugar producers do not sell to one another. (See table 1.) However, when we examine the sugar and confectioneries manufacturing industry (NAICS 3113), the sales from beet sugar are now divided between intrasectoral sales to chocolate and confectionery manufacturing companies ($375 million) and sales to customers outside of NAICS 3113—its four-digit sectoral output ($4,375 million). About 8 percent of beet sugar output is intrasectoral at the four-digit level, and 92 percent is sectoral output at this level. If we zoom out one more level to examine food manufacturing (NAICS 311), then sugar sales to producers of breakfast cereal, cakes and pies, cookies and crackers, and other manufactured foods are now considered intrasectoral transactions. These intrasectoral sales are about 40 percent of all output ($1,950 million) from the beet sugar industry, reducing beet sugar output contribution at this level from the original gross of $4.75 billion to only $2.8 billion. If we are examining the productivity of the food manufacturing sector, then double counting nearly $2 billion in sugar sales rather than removing that amount as an intrasectoral adjustment would cause us to greatly overstate the sector’s output.3 Table 1 shows the progression of intrasectoral measurement for this single industry at each level of specificity.
| Sector being measured | Sector description | Beet sugar refining gross output | Beet sugar refining intrasectoral transactions | Beet sugar refining contribution to sectoral output |
|---|---|---|---|---|
| Nondurable manufacturing | All nondurables, including beverages, apparel, paper, etc. | $4,750 | $2,150 | $2,600 |
| Three digit (NAICS 311) | Food manufacturing, including cereals, cookies, pies, etc. | 4,750 | 1,950 | 2,800 |
| Four digit (NAICS 3113) | Sugar and confectioneries, including chocolates and confections | 4,750 | 375 | 4,375 |
| Five digit (NAICS 31131) | Sugar manufacturing, including cane and beet sugar | 4,750 | 0 | 4,750 |
| Six digit (NAICS 311313) | Beet sugar refining | 4,750 | 0 | 4,750 |
| Source: U.S. Bureau of Labor Statistics. | ||||
Table 2 shows how the proportion of gross output resulting from intrasectoral transactions increases for all industries, rather than just sugar, as we climb the NAICS hierarchy from the level of individual industries to the level of all manufacturing output. As can be seen in table 2, the percentage of intrasectoral output increases as we examine the transactions at progressively broader NAICS levels.
| Specificity | Gross output | Intrasectoral output | Percentage of gross output considered intrasectoral |
|---|---|---|---|
| All manufacturing | $5,370 | $1,620 | 30.2 |
| Durable goods manufacturing | 2,490 | 686 | 27.6 |
| Nondurable goods manufacturing | 2,890 | 560 | 19.4 |
| All three-digit NAICS manufacturing | 5,370 | 545 | 10.1 |
| All four-digit NAICS manufacturing | 5,370 | 279 | 5.2 |
| All five-digit NAICS manufacturing | 5,370 | 230 | 4.3 |
| All six-digit NAICS manufacturing | 5,370 | 137 | 2.5 |
| Source: U.S. Bureau of Labor Statistics. | |||
It is important to ensure that BLS measurements of intrasectoral transactions are correct. The sectoral output concept relies on our ability to measure intrasectoral transactions and prevent double counting of outputs at various levels. Underestimating intrasectoral transactions (and thus including double-counted output) would result in upwardly biased measures of output and, consequently, overstated productivity for the industry or sector under consideration. Overestimating intrasectoral transactions would have the opposite effect, causing productivity to be understated.
Intrasectoral transactions as a share of gross output in the manufacturing sector have been relatively stable over time. However, gross output and the amount of output that is classified as intrasectoral can change from year to year. If a particular industry’s inputs are increasingly procured from offshore sources rather than from within the domestic manufacturing sector, then U.S. intrasectoral measures for that input will fall, regardless of whether U.S. industry production of the product is increasing or decreasing. Input substitution can also affect intrasectorals. Consider, for example, a chocolatier deciding to use corn syrup instead of beet sugar in its products. Beet sugar manufacturers share four-digit NAICS 3113 with chocolatiers, but corn syrup is produced in NAICS 3119. The net effect would be a decrease in intrasectoral transactions for sugars and confectioneries (NAICS 3113). Chocolatiers and corn syrup manufacturers still share a three-digit industry, so intrasectoral transactions for food manufacturing (at the three-digit level) would be unaffected by the change. The industry in which intrasectoral transactions have changed the most from 1997 to the present is the textile mills subsector, where the share of intrasectorals has decreased by about 15 percent. Other three-digit NAICS manufacturing industries have changed by 3 percent or less over the same period.
Since we are working with the sectoral output model for industry output measurement, we need an accurate accounting of intrasectoral materials transfers—the domestically manufactured outputs that are also used as inputs to domestic manufacturing. An ideal dataset for this purpose would have two main attributes: (1) it would measure all manufacturing production sold to other manufacturing industries, and (2) it would measure outputs leaving each manufacturing industry to nonmanufacturing industries and final demand.
An ideal dataset for this purpose does not exist. We do have measures of total production by industry, but these do not include what portion of each industry’s production is sold within the sector and what portion leaves the sector. The most comprehensive data available for measuring the movement of intrasectoral goods are the U.S. Census Bureau’s Materials Consumed by Kind of Industry (MCBKI) table. The MCBKI tabulates materials purchases by manufacturing industries and is produced every 5 years as part of the Economic Census.4 The primary difference between the MCBKI tablulations and our ideal dataset is that the MCBKI is measured from the consumer side of the transaction, not the producer side. We can use these data to reconstruct the producer information, but (as we shall explain directly) we cannot simply assume that measured consumption equals production. We must instead use these consumption data to calculate production inputs by source. This requires several adjustments to fully reconstruct the production data we need.
Consumption figures must be adjusted to remove imports and extraneous margin costs, which are not part of domestic production. Imported manufacturing inputs should not be credited to domestic manufacturers as output. To remove these materials from the measure, we use the import matrices from the Bureau of Economic Analysis (BEA) Input–Output Accounts data. These matrices allow us to calculate how much of each intermediate material’s production is coming from foreign producers, rather than from domestic producers. Also, margin costs embedded in procurement such as shipping or wholesale trade margins, if not removed, would inflate the measure of what producers received for their output. The BEA use table, which is also produced as part of BEA’s annual Input–Output Accounts, provides a measure for these margin costs so they can be removed.5 Failure to adjust for imports or extraneous margin costs would bias the intrasectoral measure upward, which would reduce the overall measure of output and bias the productivity measure downward.
Consumption figures must also be adjusted to account for production of secondary products. The MCBKI tables do not specify whether the listed products are from primary producers or secondary producers. We cannot assume that all intermediate products consumed come from their primary industry of origin. For example, if the MCBKI tables show an industry consuming cocoa butter, they will fail to distinguish whether that cocoa butter was sourced from a confectionery manufacturer (NAICS 311351, its primary producer) or a cosmetics manufacturer (NAICS 325620, a secondary producer). Assigning all production of this product to the confectionery industry will distort actual industry outputs, biasing intrasectoral output away from industries with important secondary products sales. We use the primary and secondary products totals from the Economic Census Detailed Statistics by Industry table to distribute production of intermediate materials across both their primary and secondary producing industries.
Some materials listed in the MCBKI are partially specified—that is, they are assigned to an industry group, rather than to a specific industry of origin. For example, an establishment may specify only that its packaging material was sourced from the paper manufacturing industry as a whole (NAICS 3222), rather than specifying that it was from corrugated box, folding paperboard, or paper bag manufacturing (NAICS 322211, 322212, and 322220, respectively). While we don’t have a specific industry of origin in this case, we do have the production totals for each of the industries that make up the subsector. Because each industry’s total production must equal or exceed its production of intermediate materials, there is some portion of each industry’s production that remains unaccounted for. This residual is a combination of final demand and unassigned intermediate materials production. We assign this partially specified production across the industries within the partially specified category, spreading it in proportion to the unaccounted-for production of each six-digit industry.6 In addition to reporting the partially specified materials, establishments may report consumption of miscellaneous materials under a $25,000 threshold by using a code designated “materials not specified–00971000.” When summed across all manufacturing establishments, this miscellaneous total can become quite large. It is distributed across all manufacturing industries to reflect its unknown origin.
The quantities involved in these adjustments are significant. Imported intermediate materials accounted for about 8 percent of manufacturing consumption in 2012, while margin costs accounted for about 4 percent. About 5 percent of all manufacturing production in 2012 was attributable to secondary products production. Partially specified materials make up 17 percent of manufacturing consumption, while miscellaneous materials make up 25 percent.7 Because these percentages are so large, it is critical that this output is correctly estimated and assigned to industries.
The process we have been describing is performed with the MCBKI every 5 years. In the intervening years between these benchmarks, the transactions between industries must be estimated. The transactions are estimated with an iterative RAS algorithm that controls the industry output changes to changes in individual industry production and consumption totals.8 These totals are collected from the U.S. Census Bureau’s Annual Survey of Manufactures. This process allows industry shares to fluctuate independently of one another. In cases in which noncensus years predate the most recent census (up to 2012), the MCBKI totals are used as both leading and trailing benchmarks for the RAS estimation. In years in which a leading benchmark is not yet available (currently 2013 to present, since the 2017 census data has not yet been released), a RAS estimation is performed using only the trailing benchmark. When a new MCBKI table is released, the most recent 5 years are revised to conform to the new leading benchmark calculation.9
In 2017, BLS made two improvements to the process for estimating intrasectoral transactions. These improvements were applied to the entire 1987–2016 historical series at that time. First, prior to 2017, transactions between the manufacturing industries and nonmanufacturing industries were estimated on the basis of aggregate consumption data only. Since 2017, these estimates have depended simultaneously on both consumption and production data. They are then reconciled with a second step to balance production and consumption. This more effectively accommodates industries in which domestic consumption and production are trending in opposite directions, such as an industry experiencing rising demand for its product while moving from domestic to offshore sourcing of its inputs.
The second improvement that BLS made is the bidirectional application of the RAS algorithm. Previously, the RAS algorithm was benchmarked to the preceding MCBKI table only. For example, the 2008–11 years would be based solely on the 2007 industry shares. Under these two improvements, the 2008–11 years are instead calculated with a yearly weighted average of both surrounding benchmarks, those for 2007 and 2012. While this requires a revision of the previous 4 years when a new benchmark becomes available, it results in an overall series that changes more smoothly over time than that obtained from the previous method. Figure 3 compares the new sectoral output series with that of the previous computation method.
| Year | Pre-2016 method | Current method |
|---|---|---|
| 1987 | 100.0 | 100.0 |
| 1988 | 104.0 | 104.1 |
| 1989 | 105.1 | 105.1 |
| 1990 | 105.6 | 105.5 |
| 1991 | 103.8 | 103.7 |
| 1992 | 109.1 | 108.7 |
| 1993 | 113.1 | 112.6 |
| 1994 | 119.1 | 118.6 |
| 1995 | 123.7 | 123.4 |
| 1996 | 128.9 | 128.6 |
| 1997 | 137.7 | 137.4 |
| 1998 | 141.5 | 144.0 |
| 1999 | 147.2 | 149.9 |
| 2000 | 155.7 | 153.7 |
| 2001 | 145.9 | 147.5 |
| 2002 | 142.4 | 148.1 |
| 2003 | 144.3 | 149.6 |
| 2004 | 151.4 | 152.9 |
| 2005 | 158.9 | 158.9 |
| 2006 | 165.3 | 161.6 |
| 2007 | 172.6 | 166.3 |
| 2008 | 172.2 | 158.4 |
| 2009 | 139.7 | 139.4 |
| 2010 | 154.6 | 147.8 |
| 2011 | 166.5 | 151.8 |
| 2012 | 173.3 | 154.1 |
| 2013 | 175.0 | 156.8 |
| 2014 | 177.9 | 159.3 |
| Source: U.S. Bureau of Labor Statistics. | ||
Table 3 shows how rates of output growth in selected manufacturing sectors were affected by the improved intrasectorals calculations. Note that because the percentage of output that is intrasectoral increases as we examine the transactions at progressively broader NAICS levels (as discussed previously, with table 2), the revisions are larger at more aggregate levels.
| Sector or industry | 1987–2014 | 1987–2007 | 2007–14 | |||
|---|---|---|---|---|---|---|
| Original | Revised | Original | Revised | Original | Revised | |
| Manufacturing sector | 2.2 | 1.7 | 2.8 | 2.6 | 0.4 | -0.6 |
| Nondurable manufacturing sector | 1.0 | 0.7 | 1.4 | 1.3 | -0.1 | -0.7 |
| Food and beverage and tobacco products | 1.0 | 0.9 | 1.3 | 1.3 | 0.1 | -0.2 |
| Textile mills and textile product mills | -1.9 | -1.9 | -1.2 | -1.2 | -4.0 | -3.6 |
| Apparel and leather and allied products | -6.4 | -6.5 | -6.2 | -6.2 | -7.2 | -7.3 |
| Paper | 0.1 | -0.1 | 0.6 | 0.5 | -1.1 | -1.6 |
| Printing and related support activities | -0.6 | -0.7 | 0.4 | 0.4 | -3.5 | -3.8 |
| Petroleum and coal products | 1.2 | 1.2 | 1.1 | 1.2 | 1.4 | 1.3 |
| Chemicals | 1.1 | 1.1 | 2.2 | 2.3 | -2.0 | -2.3 |
| Plastics and rubber products | 1.4 | 1.3 | 2.4 | 2.3 | -1.2 | -1.5 |
| Durable manufacturing sector | 2.7 | 2.3 | 3.6 | 3.4 | 0.2 | -0.7 |
| Wood products | 0.0 | -0.4 | 0.9 | 0.8 | -2.7 | -3.4 |
| Nonmetallic mineral products | 0.2 | 0.0 | 1.4 | 1.4 | -3.1 | -3.7 |
| Primary metals | 0.8 | 0.8 | 1.0 | 1.0 | 0.2 | 0.2 |
| Fabricated metal products | 1.1 | 1.0 | 1.9 | 1.8 | -1.2 | -1.4 |
| Machinery | 1.6 | 1.6 | 2.2 | 2.2 | -0.1 | -0.1 |
| Computer and electronic products | 7.1 | 6.8 | 10.3 | 10.1 | -1.4 | -1.9 |
| Electrical equipment and appliances | 0.0 | 0.0 | 0.8 | 0.8 | -2.0 | -2.0 |
| Transportation equipment | 2.0 | 1.8 | 2.2 | 2.2 | 1.3 | 0.9 |
| Furniture and related products | -0.3 | -0.3 | 1.2 | 1.2 | -4.4 | -4.4 |
| Miscellaneous manufacturing | 2.1 | 1.9 | 3.1 | 3.0 | -0.7 | -1.3 |
| Source: U.S. Bureau of Labor Statistics. | ||||||
The use of sectoral output as a tool for measuring productivity at varying levels of NAICS industry detail means it is critical to measure intrasectoral transactions correctly. For this reason—and because the size and variability of these transactions make their measurement an ongoing challenge—BLS is always seeking to improve the methods used for measuring intrasectoral transactions. The recent improvements to this process will produce a more accurate series, albeit one that is revised every 5 years when benchmarks are updated.
Thomas Kovarik, and Jerin Varghese, "Intrasectoral transactions: the most important productivity statistic you’ve never heard of," Monthly Labor Review, U.S. Bureau of Labor Statistics, September 2019, https://doi.org/10.21916/mlr.2019.20
1 While our discussion is confined to manufacturing, it is possible for nonmanufacturing industries to have intrasectoral transactions as well. In addition to manufacturing industries, BLS calculates industry-level intrasectoral adjustments for wholesale trade, utilities, and telecommunications industries. BLS does not calculate industry-level intrasectoral adjustments for other nonmanufacturing industries because of a lack of data. Intrasectoral data are calculated for all sectors at the National Income and Product Accounts level.
2 Sectoral output does not deduct imported materials, while value-added output does. Therefore, sectoral output will match value-added output at the total economy level in a closed economy, and the two will converge (but not match) in an open economy.
3 Double counting in this example would mean counting output first as revenue for the beet sugar industry and then again as part of the revenue for the cookie/pie company. Both transactions occur within NAICS 311; therefore, the activity should only be counted once.
4 It would also be possible to use the BEA Input–Output Accounts tables for these estimations. The BEA tables provide consumption data at varying levels of NAICS specificity, so some six-digit industry data would need to be estimated. The MCBKI tables from the Census Bureau provide consumption data at the six-digit NAICS level. The MCBKI data also tend to be released in a more timely fashion than are the benchmarked Input–Output tables.
5 See the “use table” on the Bureau of Economic Analysis (BEA) website at https://apps.bea.gov/industry/xls/io-annual/Use_SUT_Framework_2007_2012_DET.xlsx.
6 If this production were assigned equally to the smaller industries, it would be possible for an industry’s outbound intrasectoral transactions to exceed its gross production—which would be a contradiction. To avoid this, BLS proportionally assigns production by the amount of an industry’s total production that has not already been determined to be intrasectoral.
7 Materials partially specified at an all-manufacturing or a two-digit NAICS level make up 2.6 percent of manufacturing consumption, while materials partially specified at a three-digit, four-digit, or five-digit NAICS level make up 14.4 percent. The distribution of the latter to six-digit NAICS industries does not affect the estimation of output at the major sector level. See the table below, with data from 2012:
| Level of specificity | Partially specified materials cost | Percentage of all partically specified | Percentage of all manufacturing consumption |
|---|---|---|---|
| All manufacturing | $556 million | 0.1 | 0.0 |
| Two digit | 79 billion | 15.0 | 2.6 |
| Three digit | 181.8 billion | 34.6 | 5.9 |
| Four digit | 161.5 billion | 30.7 | 5.2 |
| Five digit | 103 billion | 19.6 | 3.3 |
8 For more information on the RAS algorithm, see Michael Bacharach, “Estimating nonnegative matrices from marginal data,” International Economic Review, September 1965.
9 Note that this means a revision in intrasectorals from 2013–16 will be issued when the 2017 MCBKI tables are published. This revision will affect existing 2013–16 manufacturing productivity measurements.