
An official website of the United States government
An official website of the United States government
The .gov means it's official.
Federal government websites often end in .gov or .mil. Before sharing sensitive information,
make sure you're on a federal government site.
The site is secure.
The
https:// ensures that you are connecting to the official website and that any
information you provide is encrypted and transmitted securely.
Nonfatal workplace injury and illness data collected for the Survey of Injuries and Illnesses (SOII) are used to tabulate estimates for two separate data series—industry summary estimates (released annually) and more detailed case circumstance and worker characteristic estimates for cases that involved days away from work, job transfer, or restriction (released biennially). For the data on case circumstances and worker characteristics, case data over a two-year reference period are combined into the biennial release. For example, case data from 2021–22 are combined for estimates for that period and are published in 2023.
Part of the estimation process involves weighting sample units and cases to represent all injuries and illnesses from units on the frame from which the sample was selected. Sample unit, case weighting, and calculation of incidence rates are described in the sections that follow.
By means of a weighting procedure, sample units represent all units in their state, industry, employment size class, and ownership (private sector, state government, or local government), also referred to as a sampling cell. An original summary weight (OSW) for each sample unit is determined by the inverse of the sampling ratio (number of units selected relative to the number of frame units available for selection) for the sampling cell from which the unit was selected. (See example in SOII Sample design section.)
Prior to the tabulation of summary estimates, the original summary weight for a sample unit is adjusted by numerical factors to account for nonresponse from some sample units, benchmarking the sampling frame to the current survey year, and the occasional inability for some sample units to report data for the unit as it was sampled. A final summary weight (FSW) used in the tabulation of estimates is determined by applying the below factors to the original weight.
Unit nonresponse adjustment factor (UNRAF) is an adjustment made to account for nonrespondents. Because a small proportion of SOII participants do not respond, weights of responding employers in a sampling cell are adjusted to account for nonrespondents by applying a unit nonresponse adjustment factor.
Outlier adjustment factor (OAF) is applied when an establishment experiences a rare circumstance that makes its case count or hours worked unrepresentative of its sampling cell. Including such data with the original sampling weight would have an undue influence on the estimates. For example, an establishment reports an unusually high number of illness cases and comments that these were the result of a severe and uncommon scabies outbreak. The outlier adjustment factor adjusts the unit’s weight to 1 to avoid an overrepresentation of this uncommon occurrence. An adjustment factor to distribute the remaining weighted employment of the outlier unit is also applied to each of the remaining useable units in the sampling cell.
Benchmark factors (BMF) is the procedure of linking the universe file to the reference year of the survey. The sample for a particular survey year must be drawn prior to that year, so that selected establishments may be pre-notified of their obligation to maintain logs throughout the year. As a result, the universe file from which the sampling frame was developed is not current to the reference year of the survey, making it necessary to adjust the data before publication to reflect current employment levels. This procedure is known as benchmarking. For the SOII, all estimates of totals are adjusted by benchmark factors at the state, industry, and ownership level, and at the national, industry, and ownership level as well. The benchmarking procedure requires a source of accurate employment data which can be converted into annual average employment figures at the industry level for which separate estimates are desired. The SOII uses employment data primarily derived from the BLS Quarterly Census of Employment and Wages.
Reaggregation factor (REAG) occurs when, on the occasional instances, a sample unit may be unable to report data for the unit as it was sampled, adjustments are made to account for these situations by applying a reaggregation factor to the unit’s original summary weight. For example, a sample unit that was involved in a merger may report data covering both the original sample unit and the unit or units with which it merged, requiring an adjustment to the weight to account for the additional unit(s) included in the reported data.
Therefore, the final summary weight for a sample unit is determined by the product of the original summary weight and these four adjustment factors, or
FSW= OSW x UNRAF x OAF x BMF x REAG
where,
FSW = final summary weight
OSW = original summary weight
UNRAF = unit nonresponse adjustment factor
OAF = outlier adjustment factor
BMF = benchmark factor
REAG = reaggregation factor
This applies to SOII cases involving days away from work (DAFW) and cases with days of job transfer or restriction (DJTR). Each of these cases is weighted by the respective sample unit’s final summary weight with which it is associated. In addition, the final summary weight that is applied to each case is adjusted for several factors to ensure that the number of usable cases that have been submitted are equal to the DAFW and DJTR cases used in the tabulation of summary estimates. These factors are used to adjust for case subsampling (see section on the SOII Sample design for discussion of subsampling) and case nonresponse for those establishments that did not provide information on all cases involving days away from work or cases with job transfer or restriction which occurred in their establishment in the survey year.
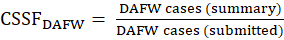
At the establishment level and for each of two different case types, the case subsampling factor (CSSF) adjusts for instances in which the submitted number of usable cases with either DAFW or cases with DJTR differs from the number of DAFW and DJTR cases reported on the summary. For example, suppose 18 DAFW cases and 21 DJTR cases are reported on the sample unit’s summary; to minimize the burden on the respondent, only 3 DAFW and 5 DJTR case forms are submitted and used. This CSSF is designed to weight the number of DAFW and DJTR cases for which usable data were reported to equal the total number of DAFW and DJTR cases indicated on the summary (that is, the number of DAFW and DJTR cases that the establishment experienced). A maximum threshold is applied to this factor, beyond which further adjustments are accomplished through other factors described below. The CSSF is calculated for each case type and is defined as the ratio of cases reported on the summary to the number of cases for which case data were submitted, or
 and
and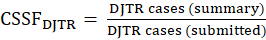
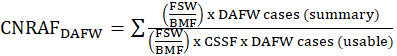
Case nonresponse adjustment factor (CNRAF) is applied at the sampling cell level by case type (i.e., DAFW and DJTR). The CNRAF is applied after the CSSF in instances where the CSSF failed to adequately adjust reported summary DAFW and DJTR cases to equal the submitted usable DAFW and DJTR cases for a sampling cell. The CNRAF is designed to adjust for cases that were not reported as a result of nonresponse within the sampling cell. A maximum threshold is applied to this factor, beyond which further adjustments are accomplished through the CRAF discussed below. The CNRAF is calculated for each case type as
 and
and
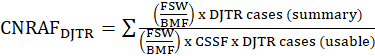
where,
FSW = final summary weight;
BMF = benchmark factor; and
CSSF = case subsampling factor for the case type.
Case ratio adjustment factor (CRAF) is applied after both the CSSF and CNRAF factors have been applied but have failed to adjust for missing cases. The CRAF is applied at the estimation cell level (target estimation industry and size class) by case type (i.e., DAFW and DJTR). The CRAF is calculated as
 and
and

where,
FSW = final summary weight;
CSSF = case subsampling factor for the case type; and
CNRAF = case nonresponse adjustment factor for the case type.
Incidence rates are calculated using the total case counts obtained through the weighting and benchmarking procedures described above. The adjusted estimates for a particular characteristic, such as injury and illness cases involving days away from work, are aggregated to the appropriate level of industry detail. The total is multiplied by 200,000 for injuries and illnesses combined and for injuries only (that is, 40 hours per week multiplied by 50 weeks—the base of hours commonly regarded as worked by 100 full-time employees during a calendar year). The product is then divided by the weighted and benchmarked estimate of hours worked as reported in the SOII for the industry segment. The formula for calculating the incidence rate is as follows:

Incidence rates for higher levels of industry detail are produced using aggregated weighted and benchmarked totals. Incidence rates may be computed by industry, employment size, state, various case circumstances, and select worker characteristics. Incidence rates for illnesses and for case and worker characteristic categories are published per 10,000 full-time employees, using 20,000,000 hours instead of 200,000 hours in the formula shown above. (The 20,000,000 hours refers to 10,000 full-time employees working 40 hours per week, 50 weeks per year.) Incidence rates per 10,000 workers can be converted to rates per 100 workers by moving the decimal point left two places and rounding the resulting rate to the nearest tenth.
Estimates from the SOII are based on a scientifically selected probability sample, rather than a census of the entire population. (See section on SOII Sample design.) Sampling methodology makes it possible to collect data from a sample from which inferences can be made regarding the characteristics of the population from which the sample was selected. These sample-based estimates may differ from the results obtained from a census of the population. The sample used for the SOII was one of many possible samples, each of which could have produced different estimates. The variation in the sample estimates across all possible samples that could have been drawn is measured by the relative standard error (RSE), which is used to calculate a confidence interval around a sample estimate.
The 95-percent confidence interval is the interval centered on the sample estimate and includes all values that are within 1.96 times the estimate's standard error. If several different samples were selected and used to estimate a population value (such as injury and illness incidence rates), the 95-percent confidence interval would include the true population value approximately 95 percent of the time.
To calculate the 95-percent confidence range given an RSE:
For example, in 2014 the total injury and illness case incidence rate for nursing care facilities (NAICS 6231) was 7.4 cases per 100 full-time workers, with an estimated RSE of 1.2 percent.
All estimates derived from a sample survey are subject to sampling and nonsampling errors. Sampling errors occur because observations are made on a sample, not on the entire population. Percent-relative standard errors, which are a measure of the sampling error in the estimates, are calculated as part of the SOII estimation process. Both the estimates and the percent-relative standard errors of the estimates can be found at the Industry Injury and Illness Data webpage. Relative standard error estimates for case circumstances and worker characteristic data may be obtained by contacting IIFStaff@bls.gov.
Nonsampling errors in the estimates can be attributed to many sources. Some examples are the inability to obtain information about all cases in the sample, mistakes in recording or coding the data, or definitional difficulties. Although not measured, nonsampling errors will always occur when statistics are gathered. To minimize the nonsampling errors in the estimates, standard procedures are applied to each respondent’s information. Completed survey forms are automatically reviewed to ensure the consistency and viability of each case, followed by manual review at the regional and national offices, and apparent inconsistencies are verified with the employer.