
An official website of the United States government
An official website of the United States government
The .gov means it's official.
Federal government websites often end in .gov or .mil. Before sharing sensitive information,
make sure you're on a federal government site.
The site is secure.
The
https:// ensures that you are connecting to the official website and that any
information you provide is encrypted and transmitted securely.

Crossref 0
ÜRETİCİ FİYATLARININ TÜKETİCİ FİYATLARINA ETKİSİ: TÜRKİYE’DEN KANITLAR, Abant Sosyal Bilimler Dergisi, 2022.
Adjusting Health Expenditures for Inflation: A Review of Measures for Health Services Research in the United States, Health Services Research, 2018.
Analyses of the PPI for personal consumption and the CPI-U, the PPI for export goods and the IPP export index, and the PPI for final demand and the BEA price indexes for GDP and gross domestic purchases reveal that (1) the PPI for personal consumption and the CPI-U differ in scope and coverage, categorization, and other technical areas; (2) the PPI for export goods and the IPP export index are similar in scope, but differ because the IPP export index is constructed from actual export prices whereas the PPI for export goods uses commodity prices as proxies for export prices; and (3) the PPI for final demand and the BEA price indexes for GDP and for gross domestic purchases differ as a result of calculation formulas, coverage, and their respective treatments of government and international transactions.
With the release of Producer Price Index (PPI) data for January 2011, the Bureau of Labor Statistics (BLS, the Bureau) introduced a new index aggregation system, the Final Demand–Intermediate Demand System, on an experimental basis. The new system expands coverage beyond that of the current PPI Stage of Processing (SOP) system by adding price indexes for services, construction, exports, and government purchases.1 The Bureau plans to shift the focus of the PPI press release to this new system with the release of data for January 2014. The PPI for final demand, an index that measures price change for goods, services, and construction products sold for personal consumption, for capital investment, for export, and to government, will be highlighted in the updated PPI press release. To provide a complete picture of final-demand inflation, and to allow data users to analyze final-demand inflation at its component source, the system also includes indexes that track price change for outputs sold for personal consumption, for capital investment, for export, and to government. The PPIs for personal consumption and exports are designed to measure price change for roughly the same portions of the economy measured by the Consumer Price Index (CPI) and the International Price Program (IPP) index for exports. The PPI for overall final demand measures price change for approximately the same portion of the economy measured by the Bureau of Economic Analysis (BEA) price indexes for gross domestic product (GDP) and gross domestic purchases.
This article examines methodological and empirical similarities and differences among several sets of price indexes. It is important to note that the economic concepts measured by each government program, and thus the indexes produced by each, need not exhibit the same levels, or even the same trends, over time. The article shows that, although the new PPIs appear to measure price change for the same portions of the economy as do the CPI and the IPP and BEA indexes, important methodological differences exist that in some cases result in substantially different movements for apparently similar indexes.
The All items CPI for all urban consumers (CPI-U), U.S. city average, measures the average change in prices urban consumers pay for goods and services.2 The PPI for personal consumption tracks the average change in selling prices received by producers for goods and services sold to consumers.3 The PPI for personal consumption and the CPI cover similar sectors of the economy but differ in a number of ways. Differences can be classified into three main areas: scope and coverage, categorization, and other technical differences.4
Scope and coverage. The scope of the PPI for personal consumption includes all marketable output sold by domestic producers to the personal consumption sector of the economy. The majority of the marketable output sold by domestic producers comes from the private sector; however, government produces some marketable output that is within the PPI’s scope. In contrast to the PPI’s scope, that of the CPI includes goods and services provided by business or government when explicit user charges are assessed and the goods or services are paid for by consumers.
The most heavily weighted item in the All Items CPI, owners’ equivalent rent, accounts for approximately 24 percent of the overall index. Owners’ equivalent rent is the implicit rent that owner occupants would have to pay if they were renting their homes and is included in the CPI in order to capture the cost of shelter for owner-occupied housing units.5 The PPI for personal consumption does not include owners’ equivalent rent within its scope, because owners’ equivalent rent is not a domestically produced, marketable output.
The PPI for personal consumption and the CPI also differ in their treatment of imports. The CPI includes within its scope goods and services purchased by domestic consumers and therefore includes imports. The PPI, in contrast, does not include imports, because imports are by definition not produced by domestic firms. Imports compose a substantial portion of the CPI, especially within the apparel and new-cars component, and their inclusion in the CPI and exclusion in the PPI for personal consumption causes a substantial difference between the two indexes.
The CPI includes only components of personal consumption that are directly paid for by the consumer, whereas the PPI for personal consumption includes components of personal consumption that are not paid for by the consumer. For example, the PPI for personal consumption includes medical services that are paid for by third parties such as employers or the federal government. The CPI, by contrast, includes only payments made directly by consumers for medical care. In December 2011, medical care services composed 23.1 percent of the PPI for personal consumption but only 5.3 percent of the all items CPI.
A final difference in scope between the PPI and the CPI occurs for services whose prices contain an interest rate component. The CPI’s scope excludes changes in interest rates or interest costs.6 The scope of the CPI includes services, such as banking services and insurance services, whose prices have an interest rate component, but the interest rate component of these services is not included in the index. The scope of the PPI also encompasses services whose prices include an interest rate component, but this index includes the interest rate component of those prices. Banking services account for approximately 4 percent of the PPI for personal consumption, and insurance services compose 3.8 percent. Within the PPI, changes in interest rates will affect price indexes for banking and insurance. The scope of the CPI includes some banking services, such as ATM fees, and many insurance services; however, the interest rate component of these services is not included. Changes in interest rates therefore do not affect the CPI.
In contrast to the CPI, the PPI does not currently have complete coverage of services. In the mid-1980s, the Bureau began expanding PPI coverage beyond mining, manufacturing, agriculture, and utilities, introducing its first services price index in 1985. The effort to expand coverage into the services sector of the economy is ongoing. The PPI currently covers approximately 72 percent of services, as measured by 2007 Census revenue figures for the sector. Because the PPI does not have complete coverage of services, a number of services are included in the CPI that are not included in the PPI for personal consumption. Among the most important of these services are residential rent, accounting for approximately 6.5 percent of the CPI, and education services, composing slightly more than 3 percent of the CPI.
Categorization. The PPI and the CPI categorize a number of goods and services differently within their index structures. Differences in categorization for goods and services are mitigated at high levels of aggregation but can create discrepancies at lower levels. The PPI, for example, classifies utilities, such as electric power and natural gas, as goods, while the CPI categorizes utilities as services. The overall PPI for personal consumption and the CPI both include utilities; however, the PPI for personal consumption services excludes utilities, while the CPI for services includes utilities, making the two services indexes less comparable than the overall indexes.
The PPI and the CPI also differ in their categorization and treatment of trade and transportation. The PPI generally separates the costs of transporting, retailing, and wholesaling goods from the cost of the good itself and classifies trade and transportation as services. In contrast, prices for goods as measured by the CPI typically include the value of the good, the value of transporting the good, and the trade margins associated with the sale of the good.
Other technical differences. Several other technical differences exist between the PPI for personal consumption and the CPI. The PPI and the CPI are both constructed with the use of a modified Laspeyres index formula, but the CPI updates weights every 2 years and the PPI updates weights every 5 years. The CPI also implements a geometric mean formula at the item level that the PPI does not. The geometric calculation reduces substitution bias, leading to lower measures of inflation in periods of price increases. The PPI attempts to collect prices for a specific day of the month (the Tuesday of the week containing the 13th), while the CPI collects prices throughout the month. Finally, prices measured by the CPI include sales and excise taxes, while prices measured by the PPI exclude those taxes.
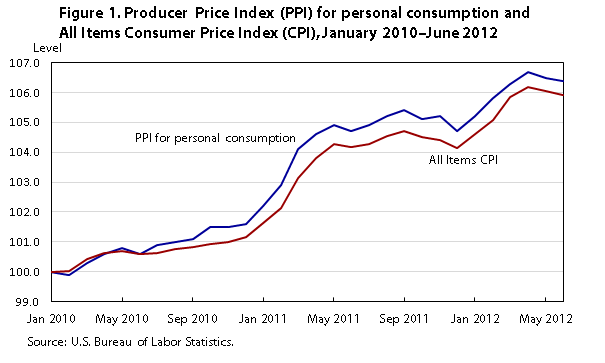
| Month and year | PPI for personal consumption | All items CPI |
|---|---|---|
Jan 2010 | 100.0 | 100.0 |
Feb 2010 | 99.9 | 100.0 |
Mar 2010 | 100.3 | 100.4 |
Apr 2010 | 100.6 | 100.6 |
May 2010 | 100.8 | 100.7 |
Jun 2010 | 100.6 | 100.6 |
Jul 2010 | 100.9 | 100.6 |
Aug 2010 | 101.0 | 100.7 |
Sep 2010 | 101.1 | 100.8 |
Oct 2010 | 101.5 | 100.9 |
Nov 2010 | 101.5 | 101.0 |
Dec 2010 | 101.6 | 101.2 |
Jan 2011 | 102.2 | 101.6 |
Feb 2011 | 102.9 | 102.1 |
Mar 2011 | 104.1 | 103.1 |
Apr 2011 | 104.6 | 103.8 |
May 2011 | 104.9 | 104.3 |
Jun 2011 | 104.7 | 104.2 |
Jul 2011 | 104.9 | 104.3 |
Aug 2011 | 105.2 | 104.5 |
Sep 2011 | 105.4 | 104.7 |
Oct 2011 | 105.1 | 104.5 |
Nov 2011 | 105.2 | 104.4 |
Dec 2011 | 104.7 | 104.1 |
Jan 2012 | 105.2 | 104.6 |
Feb 2012 | 105.8 | 105.1 |
Mar 2012 | 106.3 | 105.9 |
Apr 2012 | 106.7 | 106.2 |
May 2012 | 106.5 | 106.1 |
Jun 2012 | 106.4 | 105.9 |
| Source: U.S. Bureau of Labor Statistics. | ||
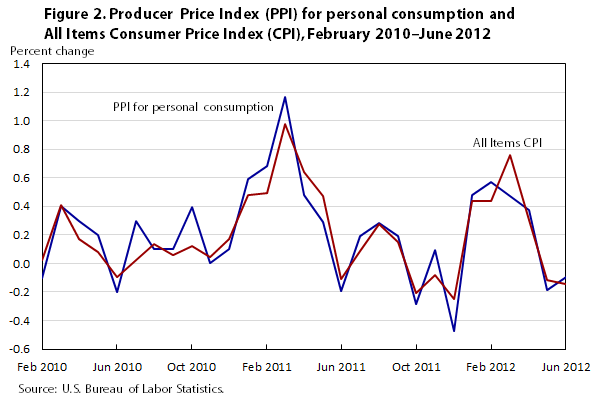
| Month and year | PPI for personal consumption | All items CPI |
|---|---|---|
Feb 2010 | -0.1 | 0.0 |
Mar 2010 | 0.4 | 0.4 |
Apr 2010 | 0.3 | 0.2 |
May 2010 | 0.2 | 0.1 |
Jun 2010 | -0.2 | -0.1 |
Jul 2010 | 0.3 | 0.0 |
Aug 2010 | 0.1 | 0.1 |
Sep 2010 | 0.1 | 0.1 |
Oct 2010 | 0.4 | 0.1 |
Nov 2010 | 0.0 | 0.0 |
Dec 2010 | 0.1 | 0.2 |
Jan 2011 | 0.6 | 0.5 |
Feb 2011 | 0.7 | 0.5 |
Mar 2011 | 1.2 | 1.0 |
Apr 2011 | 0.5 | 0.6 |
May 2011 | 0.3 | 0.5 |
Jun 2011 | -0.2 | -0.1 |
Jul 2011 | 0.2 | 0.1 |
Aug 2011 | 0.3 | 0.3 |
Sep 2011 | 0.2 | 0.2 |
Oct 2011 | -0.3 | -0.2 |
Nov 2011 | 0.1 | -0.1 |
Dec 2011 | -0.5 | -0.2 |
Jan 2012 | 0.5 | 0.4 |
Feb 2012 | 0.6 | 0.4 |
Mar 2012 | 0.5 | 0.8 |
Apr 2012 | 0.4 | 0.3 |
May 2012 | -0.2 | -0.1 |
Jun 2012 | -0.1 | -0.1 |
| Source: U.S. Bureau of Labor Statistics. | ||
Historical index comparison. Figures 1 and 2 respectively compare index levels and percent changes of the PPI for personal consumption with index levels and percent changes of the All Items CPI, with neither index seasonally adjusted.7 The figures show that, in spite of the aforesaid methodological differences between the PPI and the CPI, the indexes exhibited similar trends and similar monthly percent changes over the sample period. From January 2010 through June 2012, the all items CPI rose 5.9 percent and the PPI for personal consumption moved up 6.4 percent. The standard deviations of the monthly percent changes in the CPI and PPI were 0.30 and 0.34, respectively, and the correlation between the monthly percent changes was 0.91. Note, however, that although the PPI for personal consumption and the CPI are highly correlated over the timeframe examined, the sample period is small and there was considerable movement in food and energy prices, which the PPI and the CPI measure similarly, over that period. If, instead, there had been high volatility in an area such as owners’ equivalent rent or banking, the indexes may have been far less correlated.
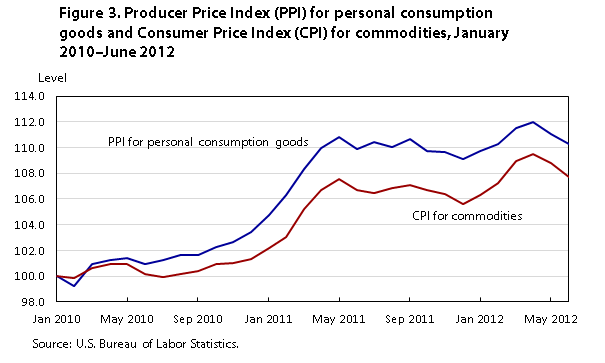
| Month and year | PPI for personal consumption goods | CPI for commodities |
|---|---|---|
Jan 2010 | 100.0 | 100.0 |
Feb 2010 | 99.2 | 99.9 |
Mar 2010 | 101.0 | 100.7 |
Apr 2010 | 101.2 | 101.0 |
May 2010 | 101.4 | 101.0 |
Jun 2010 | 100.9 | 100.1 |
Jul 2010 | 101.3 | 99.9 |
Aug 2010 | 101.6 | 100.2 |
Sep 2010 | 101.6 | 100.4 |
Oct 2010 | 102.3 | 100.9 |
Nov 2010 | 102.6 | 101.0 |
Dec 2010 | 103.4 | 101.4 |
Jan 2011 | 104.7 | 102.2 |
Feb 2011 | 106.3 | 103.0 |
Mar 2011 | 108.3 | 105.2 |
Apr 2011 | 110.0 | 106.7 |
May 2011 | 110.8 | 107.6 |
Jun 2011 | 109.9 | 106.7 |
Jul 2011 | 110.5 | 106.5 |
Aug 2011 | 110.0 | 106.9 |
Sep 2011 | 110.7 | 107.1 |
Oct 2011 | 109.7 | 106.7 |
Nov 2011 | 109.7 | 106.4 |
Dec 2011 | 109.1 | 105.6 |
Jan 2012 | 109.7 | 106.3 |
Feb 2012 | 110.3 | 107.3 |
Mar 2012 | 111.5 | 109.0 |
Apr 2012 | 112.0 | 109.5 |
May 2012 | 111.0 | 108.8 |
Jun 2012 | 110.2 | 107.7 |
| Source: U.S. Bureau of Labor Statistics. | ||
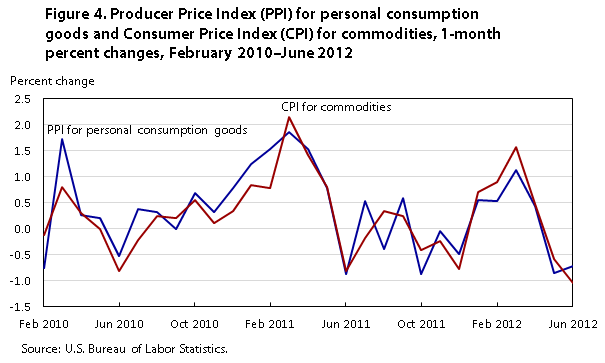
| Month and year | PPI for personal consumption goods | CPI for commodities |
|---|---|---|
Feb 2010 | -0.8 | -0.1 |
Mar 2010 | 1.7 | 0.8 |
Apr 2010 | 0.3 | 0.3 |
May 2010 | 0.2 | 0.0 |
Jun 2010 | -0.5 | -0.8 |
Jul 2010 | 0.4 | -0.2 |
Aug 2010 | 0.3 | 0.2 |
Sep 2010 | 0.0 | 0.2 |
Oct 2010 | 0.7 | 0.5 |
Nov 2010 | 0.3 | 0.1 |
Dec 2010 | 0.8 | 0.3 |
Jan 2011 | 1.2 | 0.8 |
Feb 2011 | 1.5 | 0.8 |
Mar 2011 | 1.9 | 2.2 |
Apr 2011 | 1.5 | 1.4 |
May 2011 | 0.8 | 0.8 |
Jun 2011 | -0.9 | -0.8 |
Jul 2011 | 0.5 | -0.2 |
Aug 2011 | -0.4 | 0.3 |
Sep 2011 | 0.6 | 0.2 |
Oct 2011 | -0.9 | -0.4 |
Nov 2011 | 0.0 | -0.2 |
Dec 2011 | -0.5 | -0.8 |
Jan 2012 | 0.5 | 0.7 |
Feb 2012 | 0.5 | 0.9 |
Mar 2012 | 1.1 | 1.6 |
Apr 2012 | 0.4 | 0.5 |
May 2012 | -0.9 | -0.6 |
Jun 2012 | -0.7 | -1.1 |
| Source: U.S. Bureau of Labor Statistics. | ||
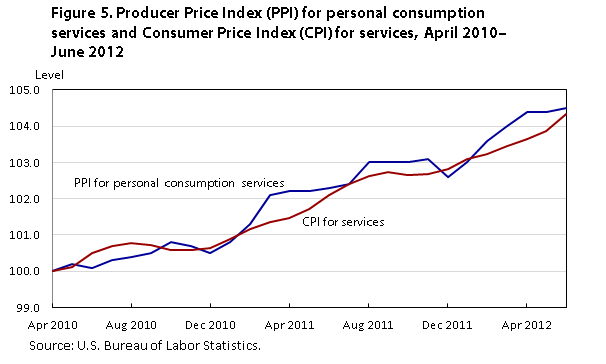
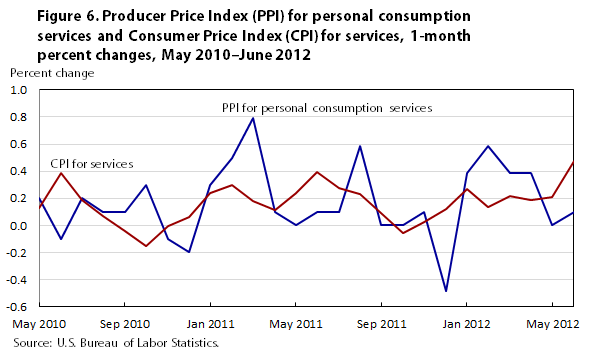
As mentioned previously, differences in categorization between the PPI and the CPI are more pronounced between detailed indexes than high-level indexes, because the differences are mitigated at high levels of aggregation. To examine this phenomenon further, figures 3 and 4 compare the PPI for personal consumption goods with the CPI for commodities and figures 5 and 6 compare the PPI for personal consumption services with the CPI for services.
From January 2010 through June 2012, the PPI for personal consumption goods increased at a quicker rate than the CPI for commodities, rising 10.2 percent, compared with a 7.7-percent increase in the CPI. The PPI also was slightly more volatile: the standard deviation in the monthly percent change for the PPI for personal consumption goods was 0.81 percent, versus a 0.75-percent standard deviation in the CPI for commodities. The correlation between the monthly percent changes in the PPI and CPI goods indexes was 0.86, slightly less than the 0.91-percent correlation in the changes in the overall index, providing some evidence of the categorization differences previously discussed.
| Month and year | PPI for personal consumption services | CPI for services |
|---|---|---|
Apr 2010 | 100.0 | 100.0 |
May 2010 | 100.2 | 100.1 |
Jun 2010 | 100.1 | 100.5 |
Jul 2010 | 100.3 | 100.7 |
Aug 2010 | 100.4 | 100.8 |
Sep 2010 | 100.5 | 100.7 |
Oct 2010 | 100.8 | 100.6 |
Nov 2010 | 100.7 | 100.6 |
Dec 2010 | 100.5 | 100.6 |
Jan 2011 | 100.8 | 100.9 |
Feb 2011 | 101.3 | 101.2 |
Mar 2011 | 102.1 | 101.4 |
Apr 2011 | 102.2 | 101.5 |
May 2011 | 102.2 | 101.7 |
Jun 2011 | 102.3 | 102.1 |
Jul 2011 | 102.4 | 102.4 |
Aug 2011 | 103.0 | 102.6 |
Sep 2011 | 103.0 | 102.7 |
Oct 2011 | 103.0 | 102.7 |
Nov 2011 | 103.1 | 102.7 |
Dec 2011 | 102.6 | 102.8 |
Jan 2012 | 103.0 | 103.1 |
Feb 2012 | 103.6 | 103.2 |
Mar 2012 | 104.0 | 103.4 |
Apr 2012 | 104.4 | 103.6 |
May 2012 | 104.4 | 103.9 |
Jun 2012 | 104.5 | 104.3 |
| Source: U.S. Bureau of Labor Statistics. | ||
| Month and year | PPI for personal consumption services | CPI for services |
|---|---|---|
May 2010 | 0.2 | 0.1 |
Jun 2010 | -0.1 | 0.4 |
Jul 2010 | 0.2 | 0.2 |
Aug 2010 | 0.1 | 0.1 |
Sep 2010 | 0.1 | 0.0 |
Oct 2010 | 0.3 | -0.1 |
Nov 2010 | -0.1 | 0.0 |
Dec 2010 | -0.2 | 0.1 |
Jan 2011 | 0.3 | 0.2 |
Feb 2011 | 0.5 | 0.3 |
Mar 2011 | 0.8 | 0.2 |
Apr 2011 | 0.1 | 0.1 |
May 2011 | 0.0 | 0.2 |
Jun 2011 | 0.1 | 0.4 |
Jul 2011 | 0.1 | 0.3 |
Aug 2011 | 0.6 | 0.2 |
Sep 2011 | 0.0 | 0.1 |
Oct 2011 | 0.0 | -0.1 |
Nov 2011 | 0.1 | 0.0 |
Dec 2011 | -0.5 | 0.1 |
Jan 2012 | 0.4 | 0.3 |
Feb 2012 | 0.6 | 0.1 |
Mar 2012 | 0.4 | 0.2 |
Apr 2012 | 0.4 | 0.2 |
May 2012 | 0.0 | 0.2 |
Jun 2012 | 0.1 | 0.5 |
| Source: U.S. Bureau of Labor Statistics. | ||
The PPI for personal consumption services and the CPI for services increased at approximately the same rate from April 2010 through June 2012; however, the monthly percent changes of the two indexes varied considerably. The PPI was more volatile, exhibiting a standard deviation of 0.27 as opposed to a 0.15-percent standard deviation in the CPI, and the correlation coefficient between the monthly percent changes was only 0.15. Differences in categorization, as well as in scope and coverage, between the PPI and CPI services indexes manifest themselves clearly in the historical index movements.
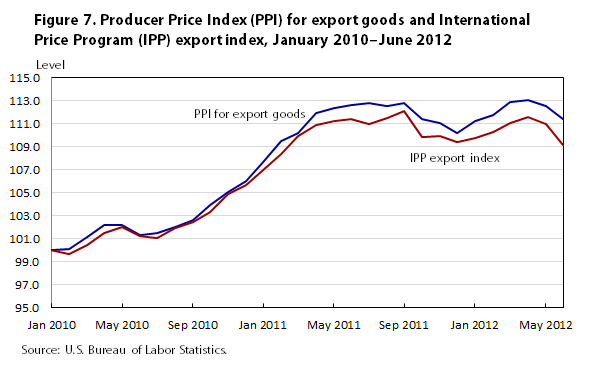
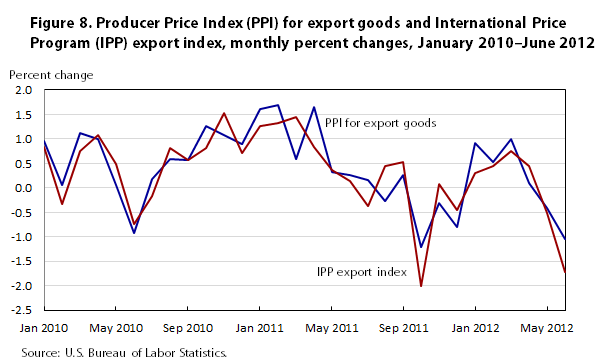
The PPI for exports tracks the average change in selling prices received by manufacturers of goods and services sold to foreign buyers by domestic producers. The IPP export index measures the change over time in the prices of goods or services sold to foreign buyers by U.S. residents.8 The scopes for exports within the two indexes are similar. The PPI’s scope includes all marketable output sold by domestic producers to foreign buyers. The IPP index’s scope includes all goods and services sold to foreign buyers. While the IPP program’s scope for exports includes both goods and services, the aggregate IPP export index’s scope includes only goods. For this reason, this section compares the PPI for exports of goods with the IPP exports index.
Although the PPI for export goods and the IPP export index are similar in scope, differences do exist between the two indexes, and these differences can be classified into two main categories: (1) export prices versus proxy export prices and (2) other technical differences.
Export prices versus proxy export prices. The PPI program and the IPP collect prices directly from domestic manufacturers. The IPP export index, however, is constructed from prices for goods sold specifically to foreign buyers. The PPI, in contrast, is constructed from PPI commodity indexes, which include prices for transactions to both foreign buyers and domestic purchasers. The PPI uses commodity indexes as proxies for pure export indexes and aggregates the indexes on the basis of export values derived from the BEA table titled “Use of commodities by industries, before redefinition,” from the Benchmark Input–Output Data Tables of the United States.9 Constructing indexes from pure export prices versus constructing them from proxy export prices may create differences between the IPP export index and the PPI for export goods, depending upon whether the type of buyer (foreign or domestic) affects manufacturer pricing patterns and depending upon the period over which any comparison is undertaken.
Other technical differences. The PPI for export goods and the IPP export index also differ in weighting, the timing of data collection, and the inclusion of transportation and insurance costs. The PPI and the IPP index both employ a modified Laspeyres index formula; however, the IPP index weights are updated yearly, whereas the PPI weights are updated every 5 years. The PPI weights are derived from Census of Manufactures data in conjunction with BEA Use of Commodities data. The Census data reflect total revenue received by domestic manufacturers for a given commodity. The BEA Use data indicate the portion of total revenue that is sold as export for a given commodity. The PPI export weight for a commodity is obtained by multiplying the Census revenue value for the commodity by the portion of use that is for export for the same commodity. The IPP index weights are constructed from trade value figures from the U.S. Census Bureau. As mentioned earlier, the PPI program attempts to collect prices on the Tuesday of the week containing the 13th of the month; the IPP, by contrast, collects prices as close as possible to the first business day of the month. Finally, goods prices collected by the PPI program typically do not include the cost of transporting or insuring the good. The IPP, by comparison, ideally collects prices at the U.S. port of embarkation, including the cost of insuring and transporting the good from the manufacturer to the port.
Historical index comparison.
| Month and year | PPI for export goods | IPP export index |
|---|---|---|
Jan 2010 | 100.0 | 100.0 |
Feb 2010 | 100.1 | 99.7 |
Mar 2010 | 101.2 | 100.4 |
Apr 2010 | 102.2 | 101.5 |
May 2010 | 102.2 | 102.0 |
Jun 2010 | 101.3 | 101.2 |
Jul 2010 | 101.5 | 101.1 |
Aug 2010 | 102.1 | 101.9 |
Sep 2010 | 102.6 | 102.5 |
Oct 2010 | 103.9 | 103.3 |
Nov 2010 | 105.0 | 104.9 |
Dec 2010 | 106.0 | 105.6 |
Jan 2011 | 107.7 | 107.0 |
Feb 2011 | 109.5 | 108.4 |
Mar 2011 | 110.2 | 109.9 |
Apr 2011 | 112.0 | 110.9 |
May 2011 | 112.3 | 111.3 |
Jun 2011 | 112.6 | 111.4 |
Jul 2011 | 112.8 | 111.0 |
Aug 2011 | 112.5 | 111.5 |
Sep 2011 | 112.8 | 112.1 |
Oct 2011 | 111.5 | 109.9 |
Nov 2011 | 111.1 | 109.9 |
Dec 2011 | 110.2 | 109.4 |
Jan 2012 | 111.2 | 109.8 |
Feb 2012 | 111.8 | 110.3 |
Mar 2012 | 112.9 | 111.1 |
Apr 2012 | 113.0 | 111.6 |
May 2012 | 112.6 | 111.0 |
Jun 2012 | 111.4 | 109.1 |
| Source: U.S. Bureau of Labor Statistics. | ||
| Month and year | PPI for export goods | IPP export index |
|---|---|---|
Jan 2010 | 0.9 | 0.8 |
Feb 2010 | 0.1 | -0.3 |
Mar 2010 | 1.1 | 0.7 |
Apr 2010 | 1.0 | 1.1 |
May 2010 | 0.1 | 0.5 |
Jun 2010 | -0.9 | -0.7 |
Jul 2010 | 0.2 | -0.2 |
Aug 2010 | 0.6 | 0.8 |
Sep 2010 | 0.6 | 0.6 |
Oct 2010 | 1.3 | 0.8 |
Nov 2010 | 1.1 | 1.5 |
Dec 2010 | 0.9 | 0.7 |
Jan 2011 | 1.6 | 1.3 |
Feb 2011 | 1.7 | 1.3 |
Mar 2011 | 0.6 | 1.5 |
Apr 2011 | 1.7 | 0.8 |
May 2011 | 0.3 | 0.4 |
Jun 2011 | 0.3 | 0.1 |
Jul 2011 | 0.2 | -0.4 |
Aug 2011 | -0.3 | 0.4 |
Sep 2011 | 0.3 | 0.5 |
Oct 2011 | -1.2 | -2.0 |
Nov 2011 | -0.3 | 0.1 |
Dec 2011 | -0.8 | -0.5 |
Jan 2012 | 0.9 | 0.3 |
Feb 2012 | 0.5 | 0.5 |
Mar 2012 | 1.0 | 0.8 |
Apr 2012 | 0.1 | 0.4 |
May 2012 | -0.4 | -0.5 |
Jun 2012 | -1.0 | -1.7 |
| Source: U.S. Bureau of Labor Statistics. | ||
The PPI for export goods (not seasonally adjusted) and the IPP export index moved similarly from January 2010 through June 2012. (See figures 7 and 8.) The PPI for export goods, however, rose at a slightly higher rate of 11.4 percent compared with the IPP index, which climbed 9.1 percent. The difference in frequency of weight updates between the two indexes helps explain the higher rate of increase in the PPI for export goods. The IPP export index is reweighted annually, reducing substitution bias in comparison to the PPI for export goods, which is reweighted every 5 years. The PPI for export goods was marginally less volatile, exhibiting a 0.79-percent standard deviation compared with a 0.83-percent standard deviation in the IPP export index. The correlation of 1-month percent changes in the PPI for export goods with that in the IPP export index from January 2010 through June 2012 was 0.86.
The analysis indicates that, at least over the short period studied, the PPI for export goods measures price change for exports relatively accurately, even though it is constructed from proxy export price data. The PPI for export goods and the IPP for exports moved similarly from January 2010 through June 2012, resulting in a high correlation between the monthly percent changes in the two indexes. The high correlation suggests that domestic manufacturers of goods tend to adjust prices similarly for products sold to both domestic and foreign buyers.
This section compares the PPI for final demand with the BEA price indexes for GDP and gross domestic purchases. The BEA GDP price index is identical to the gross domestic purchases index, except in its treatment of foreign transactions.
The PPI for final demand tracks price change for goods, services, and construction sold for personal consumption, for capital investment, to government, and for export. The BEA GDP price index measures price change for goods, services, and construction products sold for personal consumption, for capital investment, to government, and for (net) export.10 The two indexes differ primarily in four areas: calculation formulas, international accounts, government, and coverage.
Calculation formulas. The PPI for final demand is calculated with the use of a modified Laspeyres formula with weights updated every 5 years. The GDP price index is constructed by means of a Fisher ideal index formula. A Fisher ideal index is a chain-weighted index that is the geometric mean between a Laspeyres and a Paasche index. Weights for the GDP price index are therefore updated in each period. By reweighting each period, substitution bias is reduced in the GDP price index relative to the PPI for final demand.
International accounts. The PPI for final demand includes exports and excludes imports, whereas the GDP price index measures price change for net exports (exports less imports). Tracking prices for net exports means that the GDP price index does not fully reflect price change for final goods in cases where the change results from price passthrough from imported intermediate goods. In contrast, the PPI for final demand fully reflects price change in final goods, even in cases where the price change results from price passthrough from imported intermediate goods. For example, a change in the price of imported petroleum that is passed on in its entirety to refined petroleum products sold to U.S. consumers would be fully reflected in the PPI for final demand but not in the GDP price index, because imports are subtracted in deriving GDP.
Government. The government portion of the PPI for final demand measures price change for goods, services, and construction purchased by general government at the state and local level. BEA measures the value of government output by the cost of inputs—that is, as the sum of employee compensation, consumption of fixed capital, and intermediate goods and services purchased. BEA uses a number of methods to separate the price and quantity components of government output, including price index deflation and quantity extrapolation.11 Hence, BEA and the PPI differ in their treatment of government: BEA includes both the value of government purchases and the value of government employee compensation, while the PPI includes only the value of government purchases. Government, therefore, accounts for less weight in the PPI for final demand than in the GDP price index. In the final quarter of 2010 government consumption and investment accounted for 20.8 percent of GDP, while in December 2010 government purchases composed 8.4 percent of the PPI for final demand. In addition, the PPI for final demand will be affected only by price changes to goods, services, or construction purchased by government, whereas wages may affect the GDP price index.
Coverage. A final difference between the PPI for final demand and the GDP price index is that the PPI’s coverage of final demand is incomplete whereas BEA’s coverage of GDP is complete. Currently, on the basis of 2007 revenue figures, the PPI covers approximately 76.3 percent of GDP. Important areas not included in the PPI are education, residential rent, and residential construction.
| Quarter and year | PPI for final demand | GDP price index |
|---|---|---|
Quarter 1, 2010 | 100.0 | 100.0 |
Quarter 2, 2010 | 100.6 | 100.4 |
Quarter 3, 2010 | 100.8 | 100.9 |
Quarter 4, 2010 | 101.6 | 101.5 |
Quarter 1, 2011 | 103.2 | 102.0 |
Quarter 2, 2011 | 104.9 | 102.6 |
Quarter 3, 2011 | 105.3 | 103.4 |
Quarter 4, 2011 | 105.1 | 103.5 |
Quarter 1, 2012 | 106.0 | 104.0 |
Quarter 2, 2012 | 106.7 | 104.4 |
| Sources: U.S. Bureau of Labor Statistics, U.S. Bureau of Economic Analysis. | ||
| Quarter and year | PPI for final demand | GDP price index |
|---|---|---|
Quarter 2, 2010 | 0.6 | 0.4 |
Quarter 3, 2010 | 0.2 | 0.5 |
Quarter 4, 2010 | 0.7 | 0.5 |
Quarter 1, 2011 | 1.6 | 0.5 |
Quarter 2, 2011 | 1.7 | 0.6 |
Quarter 3, 2011 | 0.4 | 0.7 |
Quarter 4, 2011 | -0.2 | 0.1 |
Quarter 1, 2012 | 0.8 | 0.5 |
Quarter 2, 2012 | 0.6 | 0.4 |
| Sources: U.S. Bureau of Labor Statistics, U.S. Bureau of Economic Analysis. | ||
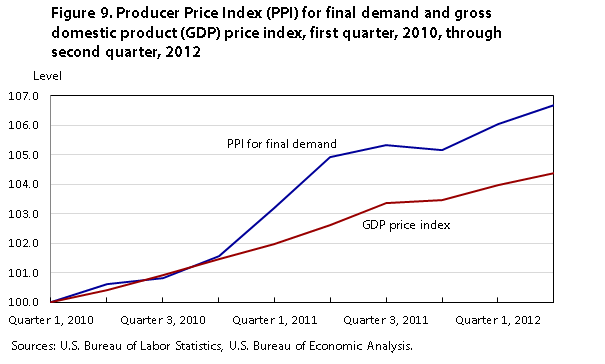
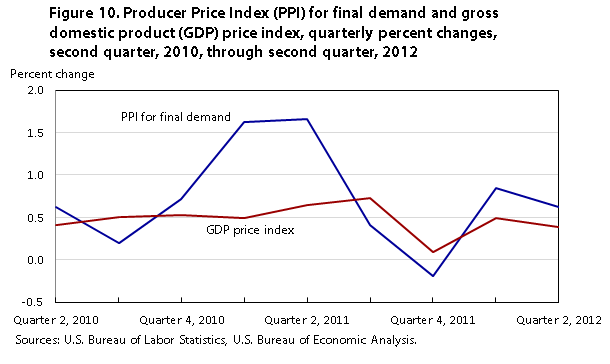
Historical index movements. Figures 9 and 10 respectively compare the index levels and quarterly percent changes in the PPI for final demand with those for the GDP price index. For comparability purposes, the PPI for final demand was converted to a quarterly series by taking the mean value of the monthly index levels contained in each quarter. The published BEA GDP price index is seasonally adjusted, and the PPI for final demand was not seasonally adjusted at the time of publication of this article. The comparison that follows is therefore between the unadjusted PPI for final demand and the seasonally adjusted BEA GDP price index.
From the first quarter of 2010 to the second quarter of 2012, the PPI for final demand was more volatile and increased at a faster rate than the GDP price index. The PPI for final demand rose 6.7 percent and the GDP price index advanced 4.4 percent. The standard deviation in the quarterly percent change of the PPI for final demand was 0.61, versus a 0.18-percent standard deviation in the GDP price index. The correlation between the quarterly percent changes in the PPI for final demand and the GDP price index was 0.51.
Throughout most of the 2010–2012 period, the PPI for final demand and the GDP price index exhibited similar quarterly percent changes; however, a divergence occurred from the fourth quarter of 2010 to the second quarter of 2011. Over this period, the PPI increased at a substantially higher rate than the GDP price index. The different treatment of foreign transactions of the two indexes partially explains the divergence in their movements. The PPI for final demand tracks export prices, whereas the BEA GDP price index measures price change for net exports. From September 2010 to April 2011, the PPI for gasoline rose 46.9 percent and the PPI for crude petroleum grew 50.2 percent. Because the GDP price index tracks prices only for net exports, rising gasoline prices that result from price passthrough of imported crude petroleum products are not fully reflected in the index. In contrast, the PPI for final demand fully reflects higher gasoline prices. For example, as imported crude petroleum prices rise, the PPI for refined gasoline likely also will rise, as a result of price transmission from imported crude petroleum to domestically produced gasoline, causing the aggregate index to increase as well. Similarly, with regard to the GDP price index, refined gasoline prices also will rise as a result of price transmission from imported crude petroleum to domestically produced refined gasoline; however, there is where the similarity ends: the effect of higher refined gasoline prices in the GDP price index will be mitigated as higher prices for imported crude petroleum are subtracted from the aggregate index. According to the Energy Information Exchange, net imported crude oil was 62 percent of net crude oil inputs to refineries in 2010.12 The two programs’ different ways of accounting for international transactions, combined with both the relatively large share of crude petroleum imported by the United States and rising prices for crude petroleum, likely caused the GDP price index to increase less than the PPI for final demand from the fourth quarter of 2010 to the second quarter of 2011.
As previously discussed, the GDP price index is calculated with the use of a Fisher ideal formula, which reweights the index in each period. In contrast, the PPI for final demand is reweighted every 5 years. Differences in formula between the PPI for final demand and the GDP price index resulted in different movements for the aggregate indexes throughout the sample period. Through reweighting in each period, the GDP price index is better able than the PPI for final demand to capture substitution by buyers from more expensive to less expensive goods.
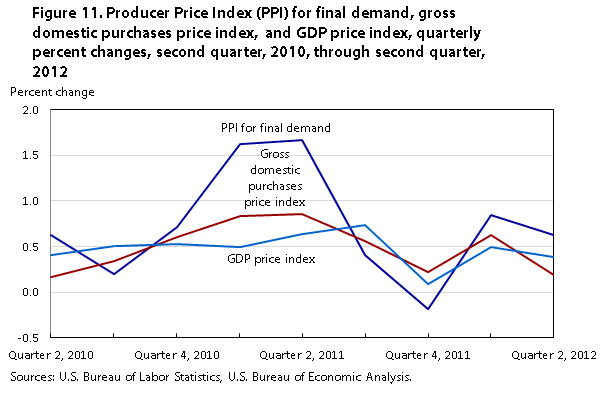
The gross domestic purchases price index tracks prices for commodities sold for personal consumption, capital investment, government purchase, and import. The index is identical to the GDP price index, except in its treatment of foreign transactions: the GDP price index tracks prices for net exports, while the gross domestic purchases price index measures price changes for imports.
Differences. Differences between the GDP price index and the PPI for final demand resulting from calculation formulas, government accounts, and coverage also hold true between the gross domestic purchases price index and the PPI for final demand. In terms of foreign transactions, the PPI for final demand and the gross domestic purchases price index also differ: the PPI for final demand includes exports and excludes imports, whereas the gross domestic purchases price index excludes exports and includes imports. Because neither the PPI for final demand nor the gross domestic purchases price index measures price change for net exports, both indexes fully reflect price changes in final goods in cases where the change results from price passthrough from imported intermediate goods.
Historical index movements. Like the GDP price index, the gross domestic purchases price index rose less than the PPI for final demand from the first quarter of 2010 to the second quarter of 2012. The advance was 4.5 percent, compared with a 6.7-percent gain in the PPI for final demand. From the fourth quarter of 2010 to the second quarter of 2011, however, the differences in percent changes between the PPI for final demand and the gross domestic purchases price index were less pronounced than the differences in percent changes between the PPI for final demand and the GDP price index. The GDP price index rose 1.1 percent less than the PPI for final demand in the first quarter of 2011 and 1.0 percent less in the second quarter. The gross domestic purchases price index increased 0.8 percent less than the PPI for final demand in each of the same two quarters. (See figure 11.) The correlation between the quarterly percent changes in the PPI for final demand and the gross domestic purchases price index was 0.80, notably higher than the 0.51 correlation between the quarterly percent changes in the PPI for final demand and the GDP price index.
| Quarter and year | PPI for final demand | Gross domestic purchases price index | GDP price index |
|---|---|---|---|
Quarter 2, 2010 | 0.6 | 0.2 | 0.4 |
Quarter 3, 2010 | 0.2 | 0.3 | 0.5 |
Quarter 4, 2010 | 0.7 | 0.6 | 0.5 |
Quarter 1, 2011 | 1.6 | 0.8 | 0.5 |
Quarter 2, 2011 | 1.7 | 0.9 | 0.6 |
Quarter 3, 2011 | 0.4 | 0.6 | 0.7 |
Quarter 4, 2011 | -0.2 | 0.2 | 0.1 |
Quarter 1, 2012 | 0.8 | 0.6 | 0.5 |
Quarter 2, 2012 | 0.6 | 0.2 | 0.4 |
| Sources: U.S. Bureau of Labor Statistics, U.S. Bureau of Economic Analysis. | |||
Because the GDP price index and the gross domestic purchases price index differ only in their treatment of international accounts, the higher correlation between the PPI for final demand and the gross domestic purchases price index must have resulted from differences in the international accounts portion of the indexes. By tracking prices for net exports, the GDP price index does not fully reflect changes in final-goods prices that result from price passthrough of intermediate import goods. The gross domestic purchases price index and PPI for final demand, by contrast, do not track net export prices, allowing the indexes to fully reflect price changes to final-demand goods. This methodological difference regarding the treatment of international transactions caused the PPI for final demand and the BEA gross domestic purchases price index to rise more than the GDP price index in the first two quarters of 2011, when prices for crude petroleum and gasoline were rising rapidly, and likely explains the closer relationship between the PPI for final demand and the BEA gross domestic purchases price index. It is important to note, however, that the observed closer relationship between the PPI for final demand and the gross domestic purchases price index (as opposed to the GDP price index) may have been a consequence of the particular sample period chosen, because petroleum prices were advancing rapidly during that period.
Within the final-demand portion of the new PPI aggregation system are a number of price indexes that cover areas of the economy similar to those covered by other government price indexes. This article compares and contrasts methodologies and historical data between the two members of each of the following sets of price indexes: the PPI for personal consumption and the CPI-U, the PPI for export goods and the IPP export index, and the PPI for final demand and the BEA price indexes for GDP and gross domestic purchases.
The analysis shows that the PPI for personal consumption and the CPI-U differ in three main areas: scope and coverage, categorization, and other technical areas (such as methods of weighting, the timing of when prices are collected, the frequency of updating weights, and taxes). Several of these differences, especially those related to scope and coverage, are more pronounced within services than goods. Analysis of historical data supports this contention: monthly percent changes between the PPI for personal consumption goods and the CPI for commodities are much more correlated than percent changes between the PPI for personal consumption services and the CPI for services. As a result of these differences, data users requiring an index that tracks prices consumers pay for goods and services should use the CPI whereas those wanting an index measuring change in domestic producer prices for goods and services sold to consumers should use the PPI for personal consumption.
The PPI for export goods and the IPP export index are similar in scope, differing mainly as a result of the PPI’s using commodity price indexes in conjunction with BEA weight data as a proxy for pure export price indexes. Analysis of historical data, albeit for a relatively brief period from 2010 through 2012, however, indicates that, although the PPI export index is constructed from proxy export price data, the index measures price change for exports relatively accurately. The correlation between the PPI for export goods and the IPP goods export index was 0.86 over the sample period. Note that the PPI calculates export indexes as a necessary component of its overall aggregation system and its final-demand price index. Because the PPI for exports is constructed from proxy export price data, the Bureau of Labor Statistics recommends that data users requiring only an export index use the IPP export price index.
The PPI for final demand and the BEA price indexes for GDP and gross domestic purchases differ as a result of calculation formulas, coverage, and their respective treatments of government and international transactions. Analysis of the data shows that the PPI for final demand and the BEA GDP price index were moderately correlated (0.51) over the sample period. The PPI for final demand and the BEA gross domestic purchases price index exhibited a stronger correlation of 0.80. The higher correlation between the PPI for final demand and the gross domestic purchases index resulted from differences in the international accounts portion of the BEA indexes. By tracking net exports, the GDP price index does not fully reflect changes in final-goods prices that result from price passthrough of intermediate import goods. The gross domestic purchases price index and the PPI for final demand, by contrast, do not track net export prices, allowing the indexes to fully reflect price change to final-demand goods. This distinction was particularly important over the sample period, when prices for crude petroleum advanced considerably.
!--?pagebreak?-->!--?pagebreak?-->!--?pagebreak?-->!--?pagebreak?-->!--?pagebreak?-->!--?pagebreak?-->!--?pagebreak?-->!--?pagebreak?-->Jonathan C. Weinhagen, "Comparing new final-demand producer price indexes with other government price indexes," Monthly Labor Review, U.S. Bureau of Labor Statistics, January 2014, https://doi.org/10.21916/mlr.2014.4
1 For a detailed description of the new PPI aggregation system, see Jonathan C. Weinhagen, “A new, experimental system of indexes from the PPI program,” Monthly Labor Review, February 2011, pp. 3–24, https://www.bls.gov/opub/mlr/2011/02/art1full.pdf.
2 For a detailed description of the CPI methodology, see “The Consumer Price Index,” BLS handbook of methods (U.S. Bureau of Labor Statistics, June 2007), chapter 17, https://www.bls.gov/opub/hom/.
3 All PPI aggregate indexes, including the SOP indexes and final-demand producer price indexes, are constructed from producers’ output prices. In both the SOP system and the final-demand indexes presented in this article, prices of goods are aggregated according to the type of buyer and producer output prices are used as a proxy for actual prices paid by the buyer. In many cases, the same commodity is purchased by different types of buyers and is therefore included in more than one aggregate index. In these cases, the same PPI commodity index often is used in all aggregations. For example, regular gasoline is purchased for personal consumption, export, government use, and business use. The PPI program publishes only one commodity index for regular gasoline (wpu057104), and this index is used in all aggregations regardless of whether the gasoline is sold for personal consumption, for export, to government, or to businesses.
4 The Bureau publishes three official CPIs: the CPI for All Urban Consumers (CPI-U), the CPI for Urban Wage Earners and Clerical Workers (CPI-W), and the Chained CPI for All Urban Consumers (C-CPI-U). For the remainder of this paper, all references to the CPI are to the CPI-U.
5 Spending to purchase and improve houses is considered investment and outside the scope of the CPI. Investment in residential housing is in the scope of the PPI but would be classified in the investment portion of final demand as opposed to the personal consumption component. As of 2013, the PPI’s coverage of the construction sector of the economy was incomplete and did not include residential construction.
6 See “The Consumer Price Index” in the BLS handbook of methods, p.3.
7 For comparison purposes, indexes in all figures were rebased to equal 100 in the first period of the sample.
8 For a detailed description of the methodology behind the IPP, see “International price indexes,” BLS handbook of methods (U.S. Bureau of Labor Statistics), chapter 15, https://www.bls.gov/opub/hom/.
9 See note 3.
10 For more information on the BEA price indexes, see A guide to the National Income and Product Accounts of the United States (U.S. Department of Commerce, Bureau of Economic Analysis), https://www.bea.gov/national/pdf/nipaguid.pdf.
11 See “Government consumption expenditures and gross investment,” chapter 9 of Concepts and methods of the U.S. National Income and Product Accounts (U.S. Department of Commerce, Bureau of Economic Analysis, November 2012), https://www.bea.gov/resources/methodologies/nipa-handbook.
12 See “U.S. oil import dependence: declining no matter how you measure it,” This week in petroleum (U.S. Energy Information Administration, May 25, 2011), http://www.eia.gov/oog/info/twip/twiparch/110525/twipprint.html.