An official website of the United States government
An official website of the United States government
The .gov means it's official.
Federal government websites often end in .gov or .mil. Before sharing sensitive information,
make sure you're on a federal government site.
The site is secure.
The
https:// ensures that you are connecting to the official website and that any
information you provide is encrypted and transmitted securely.
In 2013, U.S. nonfarm employment trended up, continuing the lengthiest employment recovery in the Current Employment Statistics (CES) survey’s history. This article uses CES data to discuss how private and public industry employment, hours, and earnings changed over the year and compares these changes with those of the prior 2 years. Not surprisingly, the greatest number of jobs added in 2013 were in private service-providing industry sectors. Some goods-producing industries—while not the largest contributors to total nonfarm employment—accelerated job growth markedly over the year. Meanwhile, many other industry sectors continued to slowly but steadily add jobs or began to recover those which had been lost in previous years. Positive industry employment trends generally reflected similar movements in related economic indicators over the year.
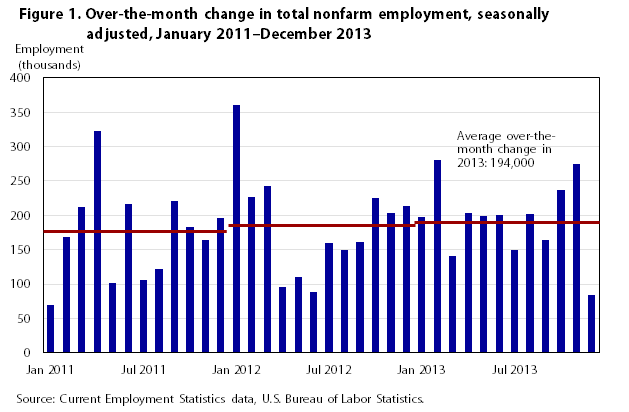
Nonfarm payroll employment in the United States continued to recover in 2013, according to data from the Current Employment Statistics (CES) survey.1 The economy added a total of 2.3 million nonfarm jobs, averaging 194,000 per month, similar to increases in each of the prior 2 years (see figure 1). Most major industry sectors saw employment gains over the year, with many of the largest 2012 contributors to nonfarm job growth having similar increases in 2013.
| Month | Employment | Over-the-month change | Yearly average over-the-month change |
|---|---|---|---|
Jan 2011 | 130,815 | 70 | 174 |
Feb 2011 | 130,983 | 168 | 174 |
Mar 2011 | 131,195 | 212 | 174 |
Apr 2011 | 131,517 | 322 | 174 |
May 2011 | 131,619 | 102 | 174 |
Jun 2011 | 131,836 | 217 | 174 |
Jul 2011 | 131,942 | 106 | 174 |
Aug 2011 | 132,064 | 122 | 174 |
Sep 2011 | 132,285 | 221 | 174 |
Oct 2011 | 132,468 | 183 | 174 |
Nov 2011 | 132,632 | 164 | 174 |
Dec 2011 | 132,828 | 196 | 174 |
Jan 2012 | 133,188 | 360 | 186 |
Feb 2012 | 133,414 | 226 | 186 |
Mar 2012 | 133,657 | 243 | 186 |
Apr 2012 | 133,753 | 96 | 186 |
May 2012 | 133,863 | 110 | 186 |
Jun 2012 | 133,951 | 88 | 186 |
Jul 2012 | 134,111 | 160 | 186 |
Aug 2012 | 134,261 | 150 | 186 |
Sep 2012 | 134,422 | 161 | 186 |
Oct 2012 | 134,647 | 225 | 186 |
Nov 2012 | 134,850 | 203 | 186 |
Dec 2012 | 135,064 | 214 | 186 |
Jan 2013 | 135,261 | 197 | 194 |
Feb 2013 | 135,541 | 280 | 194 |
Mar 2013 | 135,682 | 141 | 194 |
Apr 2013 | 135,885 | 203 | 194 |
May 2013 | 136,084 | 199 | 194 |
Jun 2013 | 136,285 | 201 | 194 |
Jul 2013 | 136,434 | 149 | 194 |
Aug 2013 | 136,636 | 202 | 194 |
Sep 2013 | 136,800 | 164 | 194 |
Oct 2013 | 137,037 | 237 | 194 |
Nov 2013 | 137,311 | 274 | 194 |
Dec 2013 | 137,386 | 84 | 194 |
| Source: Current Employment Statistics data, U.S. Bureau of Labor Statistics. | |||
| Months since recession began | Nov 1943 | Jun 1990 | Jan 2008 | Pre-2008 average |
|---|---|---|---|---|
0 | 100 | 100 | 100 | 100 |
1 | 99.83 | 99.97 | 99.94 | 99.86 |
2 | 99.61 | 99.77 | 99.88 | 99.68 |
3 | 99.36 | 99.69 | 99.73 | 99.56 |
4 | 98.77 | 99.55 | 99.59 | 99.26 |
5 | 98.23 | 99.41 | 99.47 | 98.94 |
6 | 98.05 | 99.36 | 99.32 | 98.68 |
7 | 97.96 | 99.25 | 99.13 | 98.44 |
8 | 97.86 | 98.97 | 98.80 | 98.14 |
9 | 97.73 | 98.83 | 98.46 | 97.97 |
10 | 97.32 | 98.64 | 97.91 | 97.72 |
11 | 97.41 | 98.52 | 97.40 | 97.63 |
12 | 97.41 | 98.61 | 96.83 | 97.60 |
13 | 97.76 | 98.58 | 96.32 | 97.51 |
14 | 97.84 | 98.58 | 95.72 | 97.64 |
15 | 97.86 | 98.61 | 95.23 | 97.78 |
16 | 97.61 | 98.63 | 94.97 | 97.89 |
17 | 96.78 | 98.58 | 94.64 | 97.89 |
18 | 96.46 | 98.60 | 94.40 | 98.18 |
19 | 96.10 | 98.65 | 94.24 | 98.43 |
20 | 95.45 | 98.59 | 94.08 | 98.63 |
21 | 94.50 | 98.64 | 93.94 | 98.85 |
22 | 89.91 | 98.78 | 93.93 | 98.70 |
23 | 90.14 | 98.90 | 93.73 | 99.12 |
24 | 91.07 | 98.96 | 93.74 | 99.53 |
25 | 91.34 | 99.02 | 93.71 | 99.69 |
26 | 93.02 | 99.15 | 93.82 | 100.13 |
27 | 91.67 | 99.18 | 94.00 | |
28 | 93.87 | 99.35 | 94.37 | |
29 | 95.54 | 99.47 | 94.28 | |
30 | 96.56 | 99.66 | 94.24 | |
31 | 97.46 | 99.95 | 94.21 | |
32 | 98.44 | 100.17 | 94.17 | |
33 | 99.59 | 94.34 | ||
34 | 100.21 | 94.44 | ||
35 | 94.49 | |||
36 | 94.54 | |||
37 | 94.66 | |||
38 | 94.82 | |||
39 | 95.05 | |||
40 | 95.12 | |||
41 | 95.28 | |||
42 | 95.36 | |||
43 | 95.45 | |||
44 | 95.61 | |||
45 | 95.74 | |||
46 | 95.86 | |||
47 | 96.00 | |||
48 | 96.26 | |||
49 | 96.42 | |||
50 | 96.60 | |||
51 | 96.67 | |||
52 | 96.75 | |||
53 | 96.81 | |||
54 | 96.93 | |||
55 | 97.03 | |||
56 | 97.15 | |||
57 | 97.31 | |||
58 | 97.46 | |||
59 | 97.61 | |||
60 | 97.76 | |||
61 | 97.96 | |||
62 | 98.06 | |||
63 | 98.21 | |||
64 | 98.35 | |||
65 | 98.50 | |||
66 | 98.60 | |||
67 | 98.75 | |||
68 | 98.87 | |||
69 | 99.04 | |||
70 | 99.24 | |||
71 | 99.29 | |||
| Source: Current Employment Statistics data, U.S. Bureau of Labor Statistics. | ||||
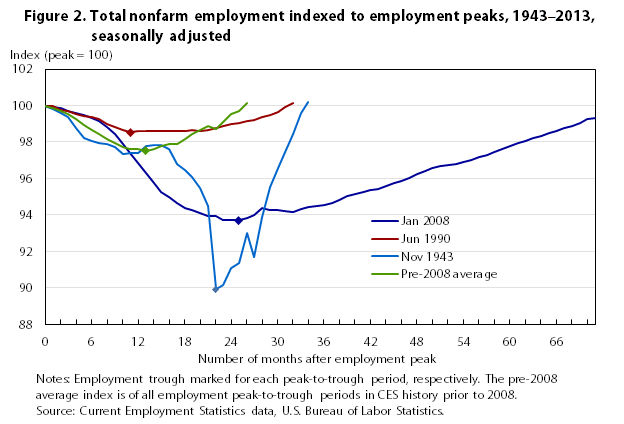
The 2008–2010 employment downturn, with 8.7 million jobs lost, was by far the most severe in magnitude since the inception of the CES survey (also referred to as the establishment survey) in 1939. In relative terms, employment fell by 6.3 percent, a decline second only to the downturn during World War II (see figure 2). From November 1943 to September 1945, payroll employment fell by 10.1 percent, representing 4.3 million jobs lost; the subsequent recovery took 12 months. In contrast, the current employment recovery has been the longest in the history of the CES survey—46 months and counting at the close of the 2013. To put this time span into perspective, the second longest employment recovery lasted 21 months after the employment downturn that ended in May 1991.
CES data serve as principal federal economic indicators. Gains in employment, hours, and earnings indicated steady economic growth in 2013.
Total nonfarm employment and aggregate hours (the product of employment and average weekly hours) tend to coincide closely with business cycle peaks. Temporary help employment and manufacturing average weekly hours often lead business cycle turning points.
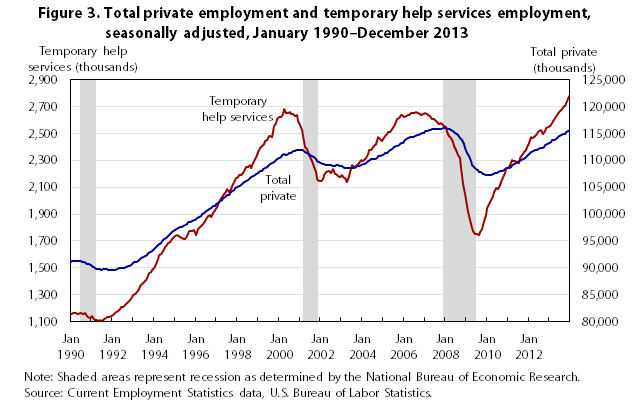
Temporary help services employment grew by 8.9 percent over the year, compared with 6.3 percent and 6.7 percent in 2012 and 2011, respectively. Economic theory suggests that business establishments wary of future economic conditions are more likely to purchase labor through temporary help firms to meet short-term fluctuations in demand than hire permanent employees, and that they hire permanent employees only after they are more confident that demand for their products or services has increased (see figure 3).
| Month | Total private | Temporary help services |
|---|---|---|
Jan 1990 | 91,032 | 1,156 |
Feb 1990 | 91,255 | 1,163 |
Mar 1990 | 91,353 | 1,169 |
Apr 1990 | 91,311 | 1,162 |
May 1990 | 91,239 | 1,162 |
Jun 1990 | 91,307 | 1,164 |
Jul 1990 | 91,273 | 1,165 |
Aug 1990 | 91,156 | 1,159 |
Sep 1990 | 91,088 | 1,163 |
Oct 1990 | 90,923 | 1,141 |
Nov 1990 | 90,766 | 1,136 |
Dec 1990 | 90,692 | 1,129 |
Jan 1991 | 90,565 | 1,141 |
Feb 1991 | 90,253 | 1,125 |
Mar 1991 | 90,089 | 1,116 |
Apr 1991 | 89,882 | 1,112 |
May 1991 | 89,742 | 1,109 |
Jun 1991 | 89,777 | 1,113 |
Jul 1991 | 89,704 | 1,110 |
Aug 1991 | 89,741 | 1,121 |
Sep 1991 | 89,797 | 1,130 |
Oct 1991 | 89,763 | 1,133 |
Nov 1991 | 89,672 | 1,134 |
Dec 1991 | 89,683 | 1,142 |
Jan 1992 | 89,690 | 1,151 |
Feb 1992 | 89,624 | 1,157 |
Mar 1992 | 89,653 | 1,170 |
Apr 1992 | 89,788 | 1,183 |
May 1992 | 89,901 | 1,199 |
Jun 1992 | 89,959 | 1,208 |
Jul 1992 | 89,973 | 1,213 |
Aug 1992 | 90,047 | 1,223 |
Sep 1992 | 90,137 | 1,230 |
Oct 1992 | 90,317 | 1,249 |
Nov 1992 | 90,443 | 1,264 |
Dec 1992 | 90,616 | 1,285 |
Jan 1993 | 90,904 | 1,296 |
Feb 1993 | 91,145 | 1,305 |
Mar 1993 | 91,091 | 1,318 |
Apr 1993 | 91,368 | 1,342 |
May 1993 | 91,622 | 1,364 |
Jun 1993 | 91,785 | 1,379 |
Jul 1993 | 91,993 | 1,399 |
Aug 1993 | 92,184 | 1,412 |
Sep 1993 | 92,410 | 1,428 |
Oct 1993 | 92,695 | 1,463 |
Nov 1993 | 92,931 | 1,467 |
Dec 1993 | 93,202 | 1,483 |
Jan 1994 | 93,436 | 1,500 |
Feb 1994 | 93,633 | 1,528 |
Mar 1994 | 94,058 | 1,567 |
Apr 1994 | 94,374 | 1,594 |
May 1994 | 94,667 | 1,601 |
Jun 1994 | 94,973 | 1,629 |
Jul 1994 | 95,323 | 1,653 |
Aug 1994 | 95,596 | 1,665 |
Sep 1994 | 95,916 | 1,686 |
Oct 1994 | 96,124 | 1,696 |
Nov 1994 | 96,520 | 1,716 |
Dec 1994 | 96,774 | 1,720 |
Jan 1995 | 97,090 | 1,735 |
Feb 1995 | 97,284 | 1,744 |
Mar 1995 | 97,486 | 1,737 |
Apr 1995 | 97,641 | 1,728 |
May 1995 | 97,641 | 1,720 |
Jun 1995 | 97,849 | 1,717 |
Jul 1995 | 97,958 | 1,716 |
Aug 1995 | 98,215 | 1,740 |
Sep 1995 | 98,455 | 1,776 |
Oct 1995 | 98,577 | 1,773 |
Nov 1995 | 98,726 | 1,774 |
Dec 1995 | 98,855 | 1,779 |
Jan 1996 | 98,853 | 1,745 |
Feb 1996 | 99,250 | 1,790 |
Mar 1996 | 99,469 | 1,795 |
Apr 1996 | 99,650 | 1,811 |
May 1996 | 99,956 | 1,829 |
Jun 1996 | 100,246 | 1,850 |
Jul 1996 | 100,482 | 1,866 |
Aug 1996 | 100,698 | 1,884 |
Sep 1996 | 100,860 | 1,891 |
Oct 1996 | 101,123 | 1,879 |
Nov 1996 | 101,411 | 1,911 |
Dec 1996 | 101,575 | 1,928 |
Jan 1997 | 101,789 | 1,949 |
Feb 1997 | 102,086 | 1,974 |
Mar 1997 | 102,392 | 2,004 |
Apr 1997 | 102,690 | 2,026 |
May 1997 | 102,950 | 2,046 |
Jun 1997 | 103,158 | 2,057 |
Jul 1997 | 103,445 | 2,085 |
Aug 1997 | 103,475 | 2,066 |
Sep 1997 | 103,925 | 2,083 |
Oct 1997 | 104,207 | 2,107 |
Nov 1997 | 104,490 | 2,139 |
Dec 1997 | 104,788 | 2,165 |
Jan 1998 | 105,060 | 2,178 |
Feb 1998 | 105,240 | 2,191 |
Mar 1998 | 105,385 | 2,193 |
Apr 1998 | 105,640 | 2,203 |
May 1998 | 105,987 | 2,223 |
Jun 1998 | 106,201 | 2,248 |
Jul 1998 | 106,274 | 2,248 |
Aug 1998 | 106,592 | 2,266 |
Sep 1998 | 106,790 | 2,243 |
Oct 1998 | 106,970 | 2,281 |
Nov 1998 | 107,210 | 2,307 |
Dec 1998 | 107,522 | 2,335 |
Jan 1999 | 107,642 | 2,357 |
Feb 1999 | 107,993 | 2,387 |
Mar 1999 | 108,076 | 2,404 |
Apr 1999 | 108,382 | 2,423 |
May 1999 | 108,602 | 2,439 |
Jun 1999 | 108,820 | 2,451 |
Jul 1999 | 109,072 | 2,479 |
Aug 1999 | 109,203 | 2,481 |
Sep 1999 | 109,387 | 2,474 |
Oct 1999 | 109,735 | 2,550 |
Nov 1999 | 109,987 | 2,573 |
Dec 1999 | 110,238 | 2,605 |
Jan 2000 | 110,437 | 2,619 |
Feb 2000 | 110,539 | 2,623 |
Mar 2000 | 110,873 | 2,644 |
Apr 2000 | 111,091 | 2,676 |
May 2000 | 110,972 | 2,649 |
Jun 2000 | 111,187 | 2,648 |
Jul 2000 | 111,384 | 2,654 |
Aug 2000 | 111,400 | 2,640 |
Sep 2000 | 111,636 | 2,645 |
Oct 2000 | 111,614 | 2,630 |
Nov 2000 | 111,822 | 2,638 |
Dec 2000 | 111,920 | 2,588 |
Jan 2001 | 111,859 | 2,564 |
Feb 2001 | 111,860 | 2,527 |
Mar 2001 | 111,796 | 2,482 |
Apr 2001 | 111,468 | 2,398 |
May 2001 | 111,393 | 2,380 |
Jun 2001 | 111,156 | 2,337 |
Jul 2001 | 110,993 | 2,324 |
Aug 2001 | 110,802 | 2,297 |
Sep 2001 | 110,536 | 2,252 |
Oct 2001 | 110,179 | 2,215 |
Nov 2001 | 109,834 | 2,158 |
Dec 2001 | 109,634 | 2,145 |
Jan 2002 | 109,470 | 2,148 |
Feb 2002 | 109,324 | 2,161 |
Mar 2002 | 109,264 | 2,189 |
Apr 2002 | 109,172 | 2,213 |
May 2002 | 109,093 | 2,218 |
Jun 2002 | 109,115 | 2,221 |
Jul 2002 | 109,035 | 2,202 |
Aug 2002 | 108,975 | 2,232 |
Sep 2002 | 108,958 | 2,200 |
Oct 2002 | 109,070 | 2,196 |
Nov 2002 | 109,058 | 2,183 |
Dec 2002 | 108,893 | 2,174 |
Jan 2003 | 108,949 | 2,192 |
Feb 2003 | 108,798 | 2,178 |
Mar 2003 | 108,602 | 2,168 |
Apr 2003 | 108,572 | 2,140 |
May 2003 | 108,589 | 2,182 |
Jun 2003 | 108,560 | 2,212 |
Jul 2003 | 108,556 | 2,263 |
Aug 2003 | 108,592 | 2,249 |
Sep 2003 | 108,746 | 2,256 |
Oct 2003 | 108,888 | 2,266 |
Nov 2003 | 108,927 | 2,277 |
Dec 2003 | 109,040 | 2,300 |
Jan 2004 | 109,209 | 2,291 |
Feb 2004 | 109,241 | 2,303 |
Mar 2004 | 109,535 | 2,314 |
Apr 2004 | 109,758 | 2,346 |
May 2004 | 110,065 | 2,379 |
Jun 2004 | 110,152 | 2,377 |
Jul 2004 | 110,179 | 2,395 |
Aug 2004 | 110,291 | 2,409 |
Sep 2004 | 110,444 | 2,418 |
Oct 2004 | 110,769 | 2,474 |
Nov 2004 | 110,798 | 2,456 |
Dec 2004 | 110,926 | 2,445 |
Jan 2005 | 111,018 | 2,459 |
Feb 2005 | 111,248 | 2,480 |
Mar 2005 | 111,386 | 2,492 |
Apr 2005 | 111,735 | 2,507 |
May 2005 | 111,883 | 2,505 |
Jun 2005 | 112,146 | 2,531 |
Jul 2005 | 112,425 | 2,550 |
Aug 2005 | 112,615 | 2,567 |
Sep 2005 | 112,700 | 2,604 |
Oct 2005 | 112,800 | 2,612 |
Nov 2005 | 113,107 | 2,637 |
Dec 2005 | 113,246 | 2,634 |
Jan 2006 | 113,555 | 2,621 |
Feb 2006 | 113,839 | 2,631 |
Mar 2006 | 114,094 | 2,633 |
Apr 2006 | 114,260 | 2,634 |
May 2006 | 114,276 | 2,650 |
Jun 2006 | 114,357 | 2,649 |
Jul 2006 | 114,513 | 2,648 |
Aug 2006 | 114,659 | 2,657 |
Sep 2006 | 114,745 | 2,648 |
Oct 2006 | 114,761 | 2,639 |
Nov 2006 | 114,956 | 2,637 |
Dec 2006 | 115,122 | 2,643 |
Jan 2007 | 115,353 | 2,647 |
Feb 2007 | 115,405 | 2,642 |
Mar 2007 | 115,575 | 2,636 |
Apr 2007 | 115,627 | 2,628 |
May 2007 | 115,753 | 2,609 |
Jun 2007 | 115,810 | 2,605 |
Jul 2007 | 115,813 | 2,596 |
Aug 2007 | 115,742 | 2,586 |
Sep 2007 | 115,774 | 2,567 |
Oct 2007 | 115,838 | 2,573 |
Nov 2007 | 115,919 | 2,567 |
Dec 2007 | 115,974 | 2,553 |
Jan 2008 | 115,977 | 2,543 |
Feb 2008 | 115,862 | 2,505 |
Mar 2008 | 115,756 | 2,480 |
Apr 2008 | 115,535 | 2,466 |
May 2008 | 115,320 | 2,434 |
Jun 2008 | 115,114 | 2,403 |
Jul 2008 | 114,853 | 2,372 |
Aug 2008 | 114,595 | 2,338 |
Sep 2008 | 114,173 | 2,313 |
Oct 2008 | 113,687 | 2,239 |
Nov 2008 | 112,911 | 2,120 |
Dec 2008 | 112,218 | 2,046 |
Jan 2009 | 111,397 | 1,961 |
Feb 2009 | 110,699 | 1,914 |
Mar 2009 | 109,889 | 1,856 |
Apr 2009 | 109,088 | 1,796 |
May 2009 | 108,794 | 1,773 |
Jun 2009 | 108,368 | 1,752 |
Jul 2009 | 108,096 | 1,749 |
Aug 2009 | 107,864 | 1,747 |
Sep 2009 | 107,723 | 1,769 |
Oct 2009 | 107,452 | 1,792 |
Nov 2009 | 107,437 | 1,850 |
Dec 2009 | 107,205 | 1,894 |
Jan 2010 | 107,225 | 1,945 |
Feb 2010 | 107,187 | 1,975 |
Mar 2010 | 107,300 | 2,004 |
Apr 2010 | 107,492 | 2,032 |
May 2010 | 107,586 | 2,065 |
Jun 2010 | 107,696 | 2,093 |
Jul 2010 | 107,816 | 2,084 |
Aug 2010 | 107,933 | 2,116 |
Sep 2010 | 108,040 | 2,136 |
Oct 2010 | 108,239 | 2,173 |
Nov 2010 | 108,388 | 2,202 |
Dec 2010 | 108,482 | 2,245 |
Jan 2011 | 108,554 | 2,241 |
Feb 2011 | 108,777 | 2,260 |
Mar 2011 | 109,008 | 2,298 |
Apr 2011 | 109,328 | 2,295 |
May 2011 | 109,494 | 2,294 |
Jun 2011 | 109,680 | 2,284 |
Jul 2011 | 109,899 | 2,279 |
Aug 2011 | 110,024 | 2,314 |
Sep 2011 | 110,292 | 2,336 |
Oct 2011 | 110,469 | 2,362 |
Nov 2011 | 110,660 | 2,377 |
Dec 2011 | 110,882 | 2,395 |
Jan 2012 | 111,246 | 2,428 |
Feb 2012 | 111,474 | 2,474 |
Mar 2012 | 111,720 | 2,466 |
Apr 2012 | 111,822 | 2,473 |
May 2012 | 111,953 | 2,486 |
Jun 2012 | 112,028 | 2,509 |
Jul 2012 | 112,200 | 2,519 |
Aug 2012 | 112,336 | 2,522 |
Sep 2012 | 112,495 | 2,496 |
Oct 2012 | 112,750 | 2,515 |
Nov 2012 | 112,961 | 2,535 |
Dec 2012 | 113,176 | 2,546 |
Jan 2013 | 113,395 | 2,551 |
Feb 2013 | 113,658 | 2,573 |
Mar 2013 | 113,822 | 2,590 |
Apr 2013 | 114,010 | 2,612 |
May 2013 | 114,232 | 2,635 |
Jun 2013 | 114,433 | 2,654 |
Jul 2013 | 114,603 | 2,664 |
Aug 2013 | 114,783 | 2,681 |
Sep 2013 | 114,936 | 2,701 |
Oct 2013 | 115,183 | 2,705 |
Nov 2013 | 115,455 | 2,742 |
Dec 2013 | 115,541 | 2,774 |
| Source: Current Employment Statistics data, U.S. Bureau of Labor Statistics. | ||
The average workweek of all employees, at 34.3 hours in December 2013, edged down by 0.1 hour over the year. Combining employment growth and relatively flat average weekly hours, the index of aggregate weekly hours continued to trend up over the year (+1.8 percent). The workweek for manufacturing production employees, a leading indicator, increased by 0.2 hour to 41.9 hours in 2013, while the manufacturing workweek for all employees edged up 0.1 hour to 40.9 hours. Manufacturing overtime hours edged up 0.2 hour over the year.
Average hourly earnings of all employees increased 1.9 percent over the year. Aggregate weekly earnings (the product of employment, average weekly hours, and average hourly earnings) rose 4.0 percent in 2013.
Aggregate earnings are an input into personal income, a component of Gross Domestic Product. Gross Domestic Product increased in real terms over the same 12-month span.2
In 2013, the rate of growth in average hourly and weekly earnings outpaced inflation as measured by the Consumer Price Index for All Urban Consumers.3 As a result, real earnings for all employees rose over the year.
| Industry | Percent distribution | Employment (in thousands) |
|---|---|---|
Financial activities | 3.17 | 74 |
Education and health services | 13.89 | 338 |
Manufacturing | 3.76 | 88 |
Wholesale trade | 4.16 | 99 |
Professional and business services | 28.08 | 677 |
Construction | 6.50 | 156 |
Mining and logging | 1.35 | 31 |
Transportation and warehousing | 3.42 | 75 |
Retail trade | 15.03 | 345 |
Other services | 1.22 | 29 |
Leisure and hospitality | 19.26 | 454 |
| Source: Current Employment Statistics data, U.S. Bureau of Labor Statistics. | ||
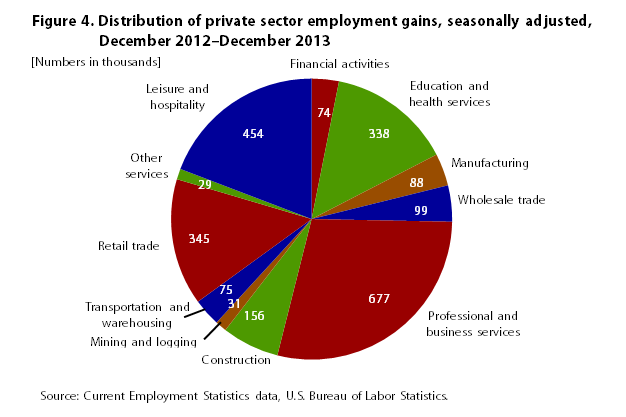
In December 2013, the 12-month diffusion index for private sector employment stood at 70.5, indicating that job growth was widespread among industries. An index value of 50 or more indicates that more industries are adding jobs than losing them. Over the year, private sector employment increased by 2.4 million (+2.1 percent); this increase was similar to the prior year’s growth. About three-quarters of the gain occurred in four major industry sectors (see figure 4 and table 1), three of which—professional and business services, leisure and hospitality, and education and health services—also contributed the largest number of jobs in 2012. Another major contributor to the total private employment gain in 2013 was retail trade, which added more jobs than education and health services over the year. Combined, professional and business services, leisure and hospitality, education and health services, and retail trade make up about half of total nonfarm employment.
| Industry | 12-month percent change | 12-month change in level (in thousands) | ||
|---|---|---|---|---|
| 2011 | 2012 | 2013 | 2013 | |
| Total nonfarm | 1.6 | 1.7 | 1.7 | 2,331 |
| Total private | 2.2 | 2.1 | 2.1 | 2,365 |
| Mining and logging | 13.4 | 2.3 | 3.6 | 31 |
| Mining | 14.0 | 2.3 | 3.6 | 29 |
| Construction | 2.6 | 2.0 | 2.7 | 156 |
| Residential building | 3.0 | 2.6 | 7.1 | 42 |
| Residential specialty trade contractors | 2.4 | 2.9 | 4.9 | 74 |
| Manufacturing | 1.8 | 1.4 | 0.7 | 88 |
| Durable goods | 3.2 | 1.9 | 1.0 | 76 |
| Wood products | -0.7 | 3.0 | 3.6 | 12 |
| Motor vehicles and parts | 7.6 | 7.5 | 5.3 | 42 |
| Nondurable goods | -0.6 | 0.6 | 0.3 | 12 |
| Wholesale trade | 2.4 | 1.7 | 1.7 | 99 |
| Retail trade | 1.9 | 1.0 | 2.3 | 345 |
| Motor vehicle and parts dealers | 3.4 | 2.5 | 3.6 | 64 |
| Food and beverage stores | 0.9 | 2.1 | 3.0 | 86 |
| Financial activities | 0.6 | 1.2 | 0.9 | 74 |
| Professional and business services | 3.4 | 3.2 | 3.7 | 677 |
| Professional and technical services | 3.1 | 3.0 | 2.6 | 204 |
| Computer systems design and related services | 6.0 | 5.6 | 3.7 | 62 |
| Management and technical consulting services | 5.9 | 4.5 | 5.4 | 62 |
| Administrative and waste services | 3.4 | 3.0 | 5.2 | 423 |
| Temporary help services | 6.7 | 6.3 | 8.9 | 228 |
| Education and health services | 1.8 | 2.4 | 1.6 | 338 |
| Health care | 1.7 | 1.9 | 1.4 | 203 |
| Ambulatory health care services | 2.7 | 2.9 | 2.8 | 178 |
| Hospitals | 1.2 | 0.9 | 0.0 | -1 |
| Nursing and residential care facilities | 0.6 | 1.5 | 0.8 | 26 |
| Social assistance | 0.6 | 6.8 | 3.3 | 104 |
| Leisure and hospitality | 2.9 | 3.2 | 3.2 | 454 |
| Arts, entertainment, and recreation | 1.4 | 3.1 | 4.3 | 86 |
| Food services and drinking places | 3.3 | 3.6 | 3.4 | 340 |
| Government | -1.4 | -0.3 | -0.2 | -34 |
| Federal, except U.S. Postal Service | -0.1 | -0.4 | -3.1 | -69 |
| U.S. Postal Service | -4.4 | -2.6 | -1.6 | -10 |
| State government | -1.8 | 0.2 | 0.3 | 14 |
| Local government | -1.3 | -0.3 | 0.2 | 30 |
| Source: Current Employment Statistics data, U.S. Bureau of Labor Statistics. | ||||
Professional and business services added 677,000 jobs in 2013, growing at a slightly faster pace than during the prior year. By October 2012, this industry sector had recovered the number of the jobs it had lost between December 2007 and August 2009. As 2013 came to a close, employment in professional and business services had expanded to 791,000 above its prerecession employment level.
Within the sector, temporary help services contributed about one-third of the 2013 employment gain. Employment growth in the industry accelerated to 8.9 percent over the year (see figure 3). The other major contributors to employment gains within the professional and business services sector occurred in services to buildings and dwellings, in computer systems design and related services, and in management and technical consulting services, which each added about 60,000 jobs over the year.
Computer systems design and management and technical consulting lost relatively fewer jobs during their recent employment downturns, 2.2 percent and 2.8 percent, respectively. Moreover, these two industries have been among the fastest growing within professional and business services since the end of the recession. As a result of the robust recoveries in these industries, the number of computer systems design and management jobs and technical consulting services jobs were back up to their previous highs by July 2010 and November 2010, respectively, and continued to expand through 2013.
Employment trends in retail trade and in leisure and hospitality often coincide with consumer demand, income, and expectations for the future. Several economic statistics related to the consumer indicated economic growth and improved confidence in 2013. Among these positive indicators were a 10.8-percentage-point increase in the Consumer Confidence Index over the year and growth in disposable personal income and retail sales (see table 2).4
| Select indicators(1) | 12-month percent change(2) | 2013 level(3) | ||
|---|---|---|---|---|
| 2011 | 2012 | 2013 | ||
| Real Gross Domestic Product | 1.8 | 2.8 | 1.9 | $16.0 trillion |
| Consumer Price Index for All Urban Consumers | 3.0 | 1.8 | 1.5 | 234.6 |
| Retail sales(4) | 6.1 | 4.9 | 3.7 | $382.6 billion |
| Disposable personal income (2009 chained dollars) | 2.4 | 2.0 | .7 | $11.7 trillion |
| Consumer Confidence Index | 1.4 | 1.9 | 10.8 | 77.5 |
| New home construction starts | 28.8 | 41.6 | 6.6 | 1.0 million |
| Housing Market Index | 5.0 | 26.0 | 10.0 | 57.0 |
| Residential construction spending | 8.4 | 20.0 | 18.3 | $353 billion |
| Real federal consumption expenditures and gross investment | -2.6 | -1.4 | -5.1 | $1.1 trillion |
| Real state and local consumption expenditures and gross investment | -3.6 | -.7 | -.2 | $1.7 trillion |
| Real personal health care expenditures | 2.7 | 2.7 | 2.2 | $1.8 trillion |
| Notes: (1) All data except for retail sales and indexes are seasonally adjusted annualized rates. (2) Percent changes in real gross domestic product, disposable personal income, and government real consumption expenditures and gross investment, and real personal health expenditures are annual average percent changes as calculated by the U.S. Bureau of Economic Analysis. Percent changes in Consumer Price Index for all urban consumers, retail sales, new home construction starts, and residential construction spending are December-to-December percent changes. Changes in the Consumer Confidence Index and the Housing Market Index are December-to-December 12-month net changes. (3) 2013 level is the December 2013 or 4th quarter 2013 estimate of the selected indicator, depending on whether the indicator is released on a monthly or quarterly basis. (4) Retail sales exclude food service and drinking places. Sources: U.S. Bureau of Economic Analysis, U.S. Census Bureau, The Conference Board, National Association of Home Builders, and the U.S. Bureau of Labor Statistics, with author's calculations. | ||||
Leisure and hospitality employment increased by 454,000 in 2013, a gain similar to that in the prior year. By December 2013, employment in the industry stood 887,000 above its December 2007 prerecession peak. During its employment recovery and expansion that began in January 2010, food services and drinking places contributed approximately 80 percent of the employment gain in leisure and hospitality.
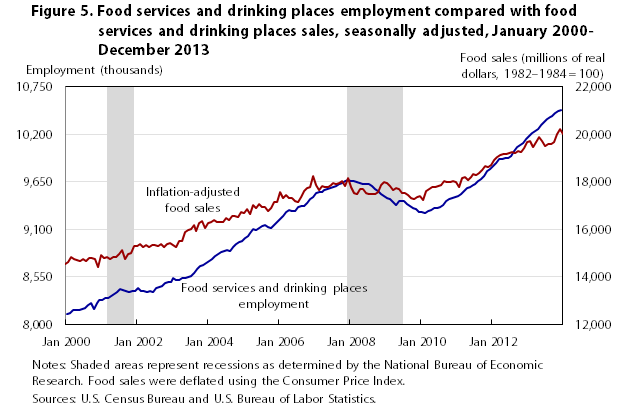
In 2013, food services added 341,000 jobs. Full-service and limited-service restaurants have been the two major drivers of job growth within food services and drinking places. The job gains in these industries in 2013 coincided with strong sales in food services and drinking places over the same 12-month period (see figure 5).5
| Month | Food sales (millions of real dollars, 1982–1984 = 100) | Food services and drinking places establishments employment (in thousands) |
|---|---|---|
Jan 2000 | 14,535 | 8,116 |
Feb 2000 | 14,639 | 8,126 |
Mar 2000 | 14,835 | 8,165 |
Apr 2000 | 14,754 | 8,170 |
May 2000 | 14,716 | 8,163 |
Jun 2000 | 14,670 | 8,175 |
Jul 2000 | 14,739 | 8,188 |
Aug 2000 | 14,674 | 8,218 |
Sep 2000 | 14,810 | 8,241 |
Oct 2000 | 14,782 | 8,175 |
Nov 2000 | 14,752 | 8,243 |
Dec 2000 | 14,395 | 8,283 |
Jan 2001 | 14,909 | 8,283 |
Feb 2001 | 14,812 | 8,306 |
Mar 2001 | 14,834 | 8,305 |
Apr 2001 | 14,765 | 8,328 |
May 2001 | 14,821 | 8,354 |
Jun 2001 | 14,845 | 8,375 |
Jul 2001 | 14,942 | 8,403 |
Aug 2001 | 15,137 | 8,394 |
Sep 2001 | 14,733 | 8,388 |
Oct 2001 | 14,944 | 8,378 |
Nov 2001 | 14,984 | 8,383 |
Dec 2001 | 15,308 | 8,383 |
Jan 2002 | 15,307 | 8,421 |
Feb 2002 | 15,384 | 8,386 |
Mar 2002 | 15,240 | 8,387 |
Apr 2002 | 15,337 | 8,376 |
May 2002 | 15,252 | 8,389 |
Jun 2002 | 15,360 | 8,377 |
Jul 2002 | 15,342 | 8,420 |
Aug 2002 | 15,295 | 8,433 |
Sep 2002 | 15,367 | 8,439 |
Oct 2002 | 15,244 | 8,480 |
Nov 2002 | 15,381 | 8,493 |
Dec 2002 | 15,411 | 8,484 |
Jan 2003 | 15,344 | 8,531 |
Feb 2003 | 15,239 | 8,511 |
Mar 2003 | 15,500 | 8,514 |
Apr 2003 | 15,504 | 8,532 |
May 2003 | 15,882 | 8,535 |
Jun 2003 | 15,964 | 8,551 |
Jul 2003 | 16,002 | 8,557 |
Aug 2003 | 16,176 | 8,590 |
Sep 2003 | 15,939 | 8,637 |
Oct 2003 | 16,249 | 8,679 |
Nov 2003 | 16,340 | 8,691 |
Dec 2003 | 16,062 | 8,713 |
Jan 2004 | 16,286 | 8,738 |
Feb 2004 | 16,315 | 8,753 |
Mar 2004 | 16,410 | 8,795 |
Apr 2004 | 16,307 | 8,817 |
May 2004 | 16,319 | 8,841 |
Jun 2004 | 16,318 | 8,852 |
Jul 2004 | 16,494 | 8,857 |
Aug 2004 | 16,404 | 8,851 |
Sep 2004 | 16,560 | 8,898 |
Oct 2004 | 16,575 | 8,930 |
Nov 2004 | 16,515 | 8,948 |
Dec 2004 | 16,751 | 8,970 |
Jan 2005 | 16,701 | 8,999 |
Feb 2005 | 16,876 | 9,027 |
Mar 2005 | 16,631 | 9,052 |
Apr 2005 | 17,012 | 9,101 |
May 2005 | 16,914 | 9,089 |
Jun 2005 | 17,058 | 9,113 |
Jul 2005 | 16,960 | 9,135 |
Aug 2005 | 16,945 | 9,145 |
Sep 2005 | 16,759 | 9,129 |
Oct 2005 | 16,885 | 9,118 |
Nov 2005 | 17,156 | 9,153 |
Dec 2005 | 17,162 | 9,183 |
Jan 2006 | 17,553 | 9,226 |
Feb 2006 | 17,319 | 9,254 |
Mar 2006 | 17,441 | 9,304 |
Apr 2006 | 17,336 | 9,327 |
May 2006 | 17,326 | 9,310 |
Jun 2006 | 17,210 | 9,318 |
Jul 2006 | 17,152 | 9,356 |
Aug 2006 | 17,354 | 9,374 |
Sep 2006 | 17,598 | 9,372 |
Oct 2006 | 17,724 | 9,400 |
Nov 2006 | 17,764 | 9,452 |
Dec 2006 | 18,248 | 9,478 |
Jan 2007 | 17,871 | 9,517 |
Feb 2007 | 17,653 | 9,533 |
Mar 2007 | 17,835 | 9,536 |
Apr 2007 | 17,771 | 9,552 |
May 2007 | 17,766 | 9,572 |
Jun 2007 | 17,874 | 9,584 |
Jul 2007 | 17,953 | 9,593 |
Aug 2007 | 17,908 | 9,602 |
Sep 2007 | 17,947 | 9,620 |
Oct 2007 | 18,050 | 9,637 |
Nov 2007 | 17,838 | 9,658 |
Dec 2007 | 18,166 | 9,673 |
Jan 2008 | 17,788 | 9,662 |
Feb 2008 | 17,515 | 9,659 |
Mar 2008 | 17,510 | 9,648 |
Apr 2008 | 17,707 | 9,632 |
May 2008 | 17,698 | 9,628 |
Jun 2008 | 17,536 | 9,622 |
Jul 2008 | 17,469 | 9,628 |
Aug 2008 | 17,479 | 9,605 |
Sep 2008 | 17,510 | 9,573 |
Oct 2008 | 17,554 | 9,547 |
Nov 2008 | 17,857 | 9,514 |
Dec 2008 | 17,997 | 9,484 |
Jan 2009 | 17,957 | 9,462 |
Feb 2009 | 17,823 | 9,448 |
Mar 2009 | 17,661 | 9,419 |
Apr 2009 | 17,728 | 9,388 |
May 2009 | 17,689 | 9,426 |
Jun 2009 | 17,522 | 9,433 |
Jul 2009 | 17,553 | 9,431 |
Aug 2009 | 17,445 | 9,398 |
Sep 2009 | 17,335 | 9,368 |
Oct 2009 | 17,294 | 9,344 |
Nov 2009 | 17,369 | 9,334 |
Dec 2009 | 17,389 | 9,305 |
Jan 2010 | 17,228 | 9,299 |
Feb 2010 | 17,634 | 9,295 |
Mar 2010 | 17,715 | 9,313 |
Apr 2010 | 17,801 | 9,325 |
May 2010 | 17,786 | 9,342 |
Jun 2010 | 17,846 | 9,350 |
Jul 2010 | 17,884 | 9,357 |
Aug 2010 | 18,019 | 9,380 |
Sep 2010 | 18,002 | 9,429 |
Oct 2010 | 18,009 | 9,452 |
Nov 2010 | 18,052 | 9,459 |
Dec 2010 | 17,989 | 9,479 |
Jan 2011 | 17,802 | 9,489 |
Feb 2011 | 18,158 | 9,515 |
Mar 2011 | 18,218 | 9,550 |
Apr 2011 | 18,083 | 9,578 |
May 2011 | 18,200 | 9,595 |
Jun 2011 | 18,339 | 9,614 |
Jul 2011 | 18,273 | 9,627 |
Aug 2011 | 18,354 | 9,655 |
Sep 2011 | 18,501 | 9,683 |
Oct 2011 | 18,679 | 9,720 |
Nov 2011 | 18,636 | 9,771 |
Dec 2011 | 18,692 | 9,794 |
Jan 2012 | 18,906 | 9,832 |
Feb 2012 | 19,050 | 9,863 |
Mar 2012 | 19,128 | 9,910 |
Apr 2012 | 19,170 | 9,913 |
May 2012 | 19,171 | 9,922 |
Jun 2012 | 19,216 | 9,929 |
Jul 2012 | 19,274 | 9,952 |
Aug 2012 | 19,237 | 10,003 |
Sep 2012 | 19,315 | 10,060 |
Oct 2012 | 19,256 | 10,076 |
Nov 2012 | 19,448 | 10,097 |
Dec 2012 | 19,684 | 10,147 |
Jan 2013 | 19,729 | 10,181 |
Feb 2013 | 19,452 | 10,217 |
Mar 2013 | 19,664 | 10,235 |
Apr 2013 | 19,895 | 10,267 |
May 2013 | 19,718 | 10,310 |
Jun 2013 | 19,531 | 10,347 |
Jul 2013 | 19,596 | 10,382 |
Aug 2013 | 19,616 | 10,406 |
Sep 2013 | 19,702 | 10,419 |
Oct 2013 | 20,008 | 10,453 |
Nov 2013 | 20,210 | 10,475 |
Dec 2013 | 20,012 | 10,487 |
Arts, entertainment, and recreation, adding 86,000 jobs in 2013, also contributed to the leisure and hospitality employment gain over the year. While the increase was smaller in magnitude than the annual job gain in food service, it represented relatively faster growth at 4.3 percent—an acceleration over the prior year’s 3.1-percent growth. Amusements, gambling, and recreation contributed 63,000 jobs to the 2013 increase.
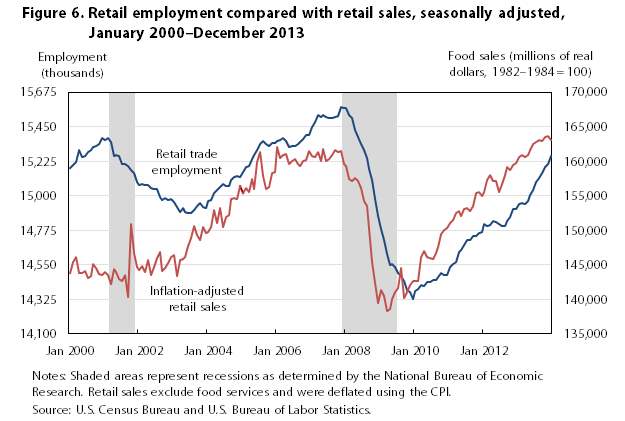
Retail trade added 345,000 jobs over the year̶ —more than double the jobs added in 2012. By December 2013, the industry had recovered 75 percent, or 937,000 of the 1.3 million jobs lost between November 2007 and December 2009. Similar to employment and sales in food services and drinking places, employment trends in retail trade coincide with sales growth in the industry (see figure 6).6
| Month | Food sales (millions of real dollars, 1982–1984 = 100) | Retail trade employment (in thousands) |
|---|---|---|
Jan 2000 | 143,817 | 15,150 |
Feb 2000 | 145,376 | 15,181 |
Mar 2000 | 146,109 | 15,197 |
Apr 2000 | 143,817 | 15,220 |
May 2000 | 143,823 | 15,298 |
Jun 2000 | 144,122 | 15,253 |
Jul 2000 | 143,129 | 15,259 |
Aug 2000 | 143,377 | 15,287 |
Sep 2000 | 145,053 | 15,298 |
Oct 2000 | 144,489 | 15,317 |
Nov 2000 | 143,645 | 15,324 |
Dec 2000 | 143,525 | 15,339 |
Jan 2001 | 143,924 | 15,376 |
Feb 2001 | 143,597 | 15,360 |
Mar 2001 | 142,164 | 15,378 |
Apr 2001 | 144,418 | 15,348 |
May 2001 | 143,975 | 15,257 |
Jun 2001 | 142,945 | 15,263 |
Jul 2001 | 142,624 | 15,257 |
Aug 2001 | 143,501 | 15,207 |
Sep 2001 | 140,290 | 15,206 |
Oct 2001 | 150,941 | 15,195 |
Nov 2001 | 146,683 | 15,170 |
Dec 2001 | 144,616 | 15,147 |
Jan 2002 | 144,278 | 15,091 |
Feb 2002 | 144,762 | 15,073 |
Mar 2002 | 144,008 | 15,074 |
Apr 2002 | 145,748 | 15,069 |
May 2002 | 143,515 | 15,072 |
Jun 2002 | 144,663 | 15,051 |
Jul 2002 | 146,006 | 15,042 |
Aug 2002 | 146,807 | 15,045 |
Sep 2002 | 144,162 | 14,990 |
Oct 2002 | 144,604 | 14,975 |
Nov 2002 | 145,212 | 14,986 |
Dec 2002 | 146,202 | 14,970 |
Jan 2003 | 146,377 | 14,980 |
Feb 2003 | 143,360 | 14,956 |
Mar 2003 | 145,648 | 14,925 |
Apr 2003 | 145,880 | 14,896 |
May 2003 | 146,180 | 14,919 |
Jun 2003 | 147,706 | 14,897 |
Jul 2003 | 148,844 | 14,890 |
Aug 2003 | 150,636 | 14,884 |
Sep 2003 | 149,348 | 14,905 |
Oct 2003 | 148,627 | 14,936 |
Nov 2003 | 150,464 | 14,954 |
Dec 2003 | 149,644 | 14,924 |
Jan 2004 | 149,718 | 14,921 |
Feb 2004 | 150,500 | 14,964 |
Mar 2004 | 153,003 | 14,969 |
Apr 2004 | 151,019 | 15,017 |
May 2004 | 153,183 | 15,034 |
Jun 2004 | 150,446 | 15,056 |
Jul 2004 | 151,981 | 15,078 |
Aug 2004 | 152,199 | 15,062 |
Sep 2004 | 154,498 | 15,066 |
Oct 2004 | 154,665 | 15,100 |
Nov 2004 | 154,529 | 15,124 |
Dec 2004 | 156,385 | 15,130 |
Jan 2005 | 155,427 | 15,124 |
Feb 2005 | 156,099 | 15,152 |
Mar 2005 | 155,517 | 15,187 |
Apr 2005 | 157,481 | 15,190 |
May 2005 | 155,997 | 15,241 |
Jun 2005 | 159,938 | 15,263 |
Jul 2005 | 161,268 | 15,296 |
Aug 2005 | 157,873 | 15,336 |
Sep 2005 | 155,987 | 15,354 |
Oct 2005 | 156,243 | 15,334 |
Nov 2005 | 158,262 | 15,326 |
Dec 2005 | 158,371 | 15,345 |
Jan 2006 | 161,982 | 15,344 |
Feb 2006 | 160,461 | 15,355 |
Mar 2006 | 160,912 | 15,364 |
Apr 2006 | 161,086 | 15,377 |
May 2006 | 159,644 | 15,353 |
Jun 2006 | 159,986 | 15,316 |
Jul 2006 | 160,361 | 15,325 |
Aug 2006 | 159,612 | 15,325 |
Sep 2006 | 159,368 | 15,338 |
Oct 2006 | 159,989 | 15,351 |
Nov 2006 | 160,228 | 15,370 |
Dec 2006 | 161,494 | 15,397 |
Jan 2007 | 160,751 | 15,397 |
Feb 2007 | 160,672 | 15,451 |
Mar 2007 | 161,305 | 15,479 |
Apr 2007 | 160,012 | 15,524 |
May 2007 | 161,689 | 15,515 |
Jun 2007 | 160,017 | 15,529 |
Jul 2007 | 160,349 | 15,510 |
Aug 2007 | 160,859 | 15,506 |
Sep 2007 | 161,676 | 15,507 |
Oct 2007 | 161,263 | 15,513 |
Nov 2007 | 161,532 | 15,516 |
Dec 2007 | 159,529 | 15,576 |
Jan 2008 | 159,234 | 15,571 |
Feb 2008 | 157,397 | 15,570 |
Mar 2008 | 157,109 | 15,528 |
Apr 2008 | 157,527 | 15,506 |
May 2008 | 157,104 | 15,429 |
Jun 2008 | 156,172 | 15,379 |
Jul 2008 | 154,219 | 15,335 |
Aug 2008 | 153,508 | 15,299 |
Sep 2008 | 150,199 | 15,245 |
Oct 2008 | 145,462 | 15,172 |
Nov 2008 | 142,398 | 15,103 |
Dec 2008 | 139,509 | 14,981 |
Jan 2009 | 141,296 | 14,870 |
Feb 2009 | 140,549 | 14,783 |
Mar 2009 | 138,333 | 14,715 |
Apr 2009 | 138,568 | 14,618 |
May 2009 | 140,054 | 14,549 |
Jun 2009 | 141,029 | 14,554 |
Jul 2009 | 141,652 | 14,537 |
Aug 2009 | 144,576 | 14,495 |
Sep 2009 | 140,223 | 14,479 |
Oct 2009 | 141,066 | 14,447 |
Nov 2009 | 142,149 | 14,387 |
Dec 2009 | 142,664 | 14,373 |
Jan 2010 | 142,730 | 14,325 |
Feb 2010 | 142,673 | 14,381 |
Mar 2010 | 146,141 | 14,394 |
Apr 2010 | 146,983 | 14,420 |
May 2010 | 146,150 | 14,414 |
Jun 2010 | 145,965 | 14,437 |
Jul 2010 | 145,866 | 14,436 |
Aug 2010 | 146,701 | 14,454 |
Sep 2010 | 147,626 | 14,451 |
Oct 2010 | 149,442 | 14,472 |
Nov 2010 | 150,025 | 14,500 |
Dec 2010 | 150,382 | 14,481 |
Jan 2011 | 151,109 | 14,484 |
Feb 2011 | 151,543 | 14,538 |
Mar 2011 | 152,560 | 14,555 |
Apr 2011 | 152,734 | 14,567 |
May 2011 | 152,025 | 14,632 |
Jun 2011 | 153,129 | 14,643 |
Jul 2011 | 153,193 | 14,679 |
Aug 2011 | 152,816 | 14,714 |
Sep 2011 | 153,546 | 14,710 |
Oct 2011 | 155,383 | 14,736 |
Nov 2011 | 155,589 | 14,738 |
Dec 2011 | 154,929 | 14,757 |
Jan 2012 | 155,509 | 14,762 |
Feb 2012 | 157,328 | 14,818 |
Mar 2012 | 158,027 | 14,803 |
Apr 2012 | 157,131 | 14,808 |
May 2012 | 157,077 | 14,833 |
Jun 2012 | 155,606 | 14,827 |
Jul 2012 | 156,705 | 14,814 |
Aug 2012 | 157,980 | 14,802 |
Sep 2012 | 159,210 | 14,802 |
Oct 2012 | 158,772 | 14,834 |
Nov 2012 | 159,385 | 14,861 |
Dec 2012 | 159,701 | 14,915 |
Jan 2013 | 160,589 | 14,917 |
Feb 2013 | 160,905 | 14,944 |
Mar 2013 | 160,548 | 14,953 |
Apr 2013 | 160,925 | 14,944 |
May 2013 | 161,659 | 14,967 |
Jun 2013 | 162,485 | 15,002 |
Jul 2013 | 162,813 | 15,040 |
Aug 2013 | 163,030 | 15,089 |
Sep 2013 | 162,892 | 15,118 |
Oct 2013 | 163,498 | 15,146 |
Nov 2013 | 163,570 | 15,187 |
Dec 2013 | 163,109 | 15,210 |
| Sources: U.S. Census Bureau and U.S. Bureau of Labor Statistics. | ||
Within retail trade, food and beverage stores contributed the largest number of jobs over the year, 86,000. As 2013 came to a close, employment in food and beverage stores had expanded to 101,000 above its March 2008 peak. Furthermore, job growth in food stores accelerated each year since employment started to recover in 2010.
General merchandise stores added 64,000 jobs in 2013, following a loss of 83,000 jobs in 2012.
Although their increases were smaller in magnitude, motor vehicle and parts dealers; building material and garden supply stores; and sporting goods, hobby, book, and music stores saw stronger employment gains in 2013, adding 64,000, 39,000, and 35,000 jobs, respectively. The employment increase in motor vehicles and parts dealers coincided with a strong 6.5-percent over-the-year sales increase in motor vehicles and parts dealers.7
Clothing and clothing accessories stores and miscellaneous store retailers both trended downward in 2013.
During the collapse of the housing market, construction was the first industry sector to see sustained job losses leading into the 2007–2009 recession. Employment in the industry peaked in April 2006 and then declined until January 2011. Construction lost 2.3 million jobs during this period—nearly one-third of its total employment. Employment growth in construction increased by 2.7 percent in 2013, compared with increases of 2.0 percent in 2012 and 2.6 percent in 2011.
From January 2011 through December 2013, construction regained 444,000 or 19.4 percent of the jobs it had lost during the industry’s employment downturn. Over half of the recovered jobs were among specialty trade contractors and were split nearly evenly between the residential and nonresidential components.
In 2013, construction contributed 156,000 jobs to total nonfarm employment. The largest portion of the 2013 construction employment gain came from residential specialty trade contractors (+74,000). Construction of buildings added 56,000 jobs, which were concentrated in residential construction (+42,000). Employment in nonresidential construction industries edged up by 37,000 over the year, while employment remained essentially flat in heavy and civil engineering construction (+3,000).
Employment rose by 5.5 percent in residential construction industries in 2013; this growth was more than double the rate for 2012. The stronger growth in residential construction employment coincided with improvement in other economic indicators for the industry. New home construction starts reached their highest level in nearly 6 years in December 2013, while the Housing Market Index, which tracks builder confidence in the market for newly built, single-family homes, increased 10 percentage points, reaching its highest level in over 7 years in August 2013.8 Residential construction spending increased greatly over the year—18.3 percent—compared with an 8.0-percent over-the-year increase in total private construction spending.9 The positive residential construction indicators coincided with employment growth accelerating in wood product manufacturing, an industry that primarily produces wood materials used in construction projects.
Mining contributed 31,000 jobs to total nonfarm employment over the year. Employment growth in the industry increased by 3.6 percent in 2013, up from 2.3 percent the prior year. Within the industry sector, essentially all of the job gain occurred in support activities for mining (+21,000) and oil and gas extraction (+12,000).
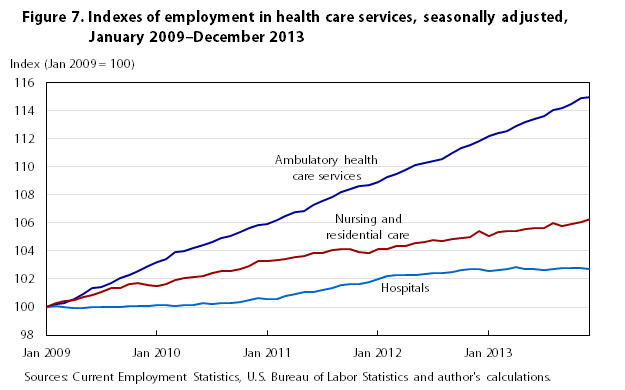
Employment growth in health care slowed to 1.4 percent over the year, compared with a 1.9-percent increase in 2012. Real personal health care expenditures increased by 2.2 percent in 2013, similar to expenditures in the prior year.10 Employment trends among the health care industries varied, with job growth slowing in hospitals and accelerating in ambulatory health care services (see figure 7).
| Month | Ambulatory health care services | Nursing and residential care | Hospitals |
|---|---|---|---|
Jan 2009 | 100.0 | 100.0 | 100.0 |
Feb 2009 | 100.2 | 100.3 | 100.1 |
Mar 2009 | 100.3 | 100.4 | 100.0 |
Apr 2009 | 100.6 | 100.5 | 99.9 |
May 2009 | 101.0 | 100.7 | 100.0 |
Jun 2009 | 101.3 | 100.8 | 100.0 |
Jul 2009 | 101.5 | 101.1 | 100.0 |
Aug 2009 | 101.7 | 101.3 | 100.0 |
Sep 2009 | 102.1 | 101.4 | 100.0 |
Oct 2009 | 102.3 | 101.6 | 100.1 |
Nov 2009 | 102.6 | 101.7 | 100.1 |
Dec 2009 | 102.9 | 101.6 | 100.1 |
Jan 2010 | 103.2 | 101.5 | 100.1 |
Feb 2010 | 103.4 | 101.6 | 100.1 |
Mar 2010 | 103.9 | 101.9 | 100.1 |
Apr 2010 | 104.0 | 102.1 | 100.1 |
May 2010 | 104.2 | 102.1 | 100.1 |
Jun 2010 | 104.4 | 102.2 | 100.3 |
Jul 2010 | 104.6 | 102.4 | 100.2 |
Aug 2010 | 104.9 | 102.6 | 100.3 |
Sep 2010 | 105.1 | 102.6 | 100.3 |
Oct 2010 | 105.4 | 102.7 | 100.4 |
Nov 2010 | 105.7 | 102.9 | 100.5 |
Dec 2010 | 105.8 | 103.2 | 100.6 |
Jan 2011 | 105.9 | 103.3 | 100.6 |
Feb 2011 | 106.2 | 103.3 | 100.6 |
Mar 2011 | 106.5 | 103.4 | 100.8 |
Apr 2011 | 106.8 | 103.6 | 100.9 |
May 2011 | 106.9 | 103.7 | 101.1 |
Jun 2011 | 107.3 | 103.8 | 101.1 |
Jul 2011 | 107.6 | 103.9 | 101.2 |
Aug 2011 | 107.9 | 104.0 | 101.3 |
Sep 2011 | 108.2 | 104.1 | 101.6 |
Oct 2011 | 108.4 | 104.1 | 101.6 |
Nov 2011 | 108.6 | 103.9 | 101.7 |
Dec 2011 | 108.7 | 103.9 | 101.8 |
Jan 2012 | 108.9 | 104.1 | 102.0 |
Feb 2012 | 109.3 | 104.1 | 102.2 |
Mar 2012 | 109.5 | 104.3 | 102.3 |
Apr 2012 | 109.8 | 104.4 | 102.3 |
May 2012 | 110.2 | 104.6 | 102.3 |
Jun 2012 | 110.3 | 104.6 | 102.3 |
Jul 2012 | 110.4 | 104.7 | 102.4 |
Aug 2012 | 110.6 | 104.7 | 102.5 |
Sep 2012 | 111.0 | 104.9 | 102.5 |
Oct 2012 | 111.3 | 104.9 | 102.6 |
Nov 2012 | 111.6 | 105.0 | 102.7 |
Dec 2012 | 111.8 | 105.4 | 102.7 |
Jan 2013 | 112.2 | 105.0 | 102.6 |
Feb 2013 | 112.4 | 105.3 | 102.7 |
Mar 2013 | 112.5 | 105.4 | 102.7 |
Apr 2013 | 112.9 | 105.5 | 102.8 |
May 2013 | 113.2 | 105.6 | 102.7 |
Jun 2013 | 113.4 | 105.7 | 102.7 |
Jul 2013 | 113.6 | 105.6 | 102.6 |
Aug 2013 | 114.0 | 106.0 | 102.7 |
Sep 2013 | 114.2 | 105.8 | 102.8 |
Oct 2013 | 114.5 | 105.9 | 102.8 |
Nov 2013 | 114.9 | 106.1 | 102.8 |
Dec 2013 | 114.9 | 106.2 | 102.7 |
| Sources: Current Employment Statistics, U.S. Bureau of Labor Statistics and author's calculations. | |||
Within the health care industries, hospitals experienced the most marked change in employment trend over the year. Hospital employment peaked in April 2013 and then started to decline, resulting in zero net change over the year. The downward employment trend in the industry coincides with an increasing deficit between hospital insurance income and hospital insurance cost rates, as calculated by the Centers for Medicare and Medicaid Services.11
Ambulatory health care services continued to add jobs in 2013. Employment gains averaged 15,000 per month, the same as in 2012. Within ambulatory care, offices of physicians, outpatient care centers, and home health care services accounted for 78 percent of the employment gain. Over-the-year job growth accelerated in the latter two industries compared with 2012 but decelerated in offices of physicians.
Nursing and residential care facilities employment rose by 26,000 over the year, but within the industry, nursing care facilities continued to trend down. Since its employment peak in June 2011 through the end of 2013, the industry lost 26,000 jobs.
Social assistance employment also continued to grow in 2013; job gains totaled 104,000 over the year, compared with 201,000 jobs added in 2012. The majority of these gains occurred in services for the elderly and disabled, an industry that provides in-home nonmedical assistance to elderly and disabled people.12
Employment continued to trend up over the year in wholesale trade, transportation and warehousing, manufacturing, and financial activities. Wholesale trade matched its 2012 employment growth rate, while employment growth decelerated in the latter three industries in 2013.
Over the year, wholesale trade added 99,000 jobs, representing a 1.7-percent gain. Within the sector, durable goods contributed nearly half of the job gain (+44,000), followed by electronic markets and agents and brokers, which added 33,000 jobs over the year. Acceleration of job growth in electronic markets was offset by decelerating growth in the durable and nondurable good components of wholesale trade.
Wholesale trade employment declined by 602,000, or 10.0 percent, from November 2007 to May 2010. By the end of 2013, the industry had regained 59.3 percent of the jobs it had lost during its employment downturn.
Although manufacturing employment increased by 89,000, or 0.7 percent, over the year, the employment growth rate was half that of 2012. The bulk of the manufacturing employment gain in 2013 occurred in durable goods (+78,000), with motor vehicles and parts manufacturing adding 46,000 jobs.
The annual job growth in motor vehicles and parts slowed by 2.2 percentage points in 2013 compared with 2012; however, the 5.3-percent increase in the industry’s employment over the year was more than twice that of total private employment (+2.1 percent). Employment growth in motor vehicle and parts manufacturing mirrored strong employment growth in motor vehicles and parts dealers’ employment and sales in the United States.
Transportation and warehousing employment increased by 74,000 in 2013; however, job growth slowed to 1.7 percent from 2.9 percent in 2012. Couriers and messengers (+19,000) and truck transportation (+20,000) accounted for half of the employment increase over the past year.
Financial activities employment continued its slow upward trend in 2013. The industry added 75,000 jobs over the year—a 1.0-percent gain. The over-the-year change was nearly all attributable to real estate (+39,000) and insurance carriers and related activities (+32,000). Financial activities has recovered 227,000 of the 719,000 jobs lost between December 2006 and February 2011.
Government employment edged down by 34,000 over the year after declining by 58,000 in 2012.
Federal government employment declined by 78,000, or 2.8 percent, over the year. The majority of the loss occurred in federal except U.S. Postal Service (–69,000), after 2 years of little change in this portion of federal government employment. This trend coincided with an ongoing decrease in real consumption expenditures and gross investment by the federal government.13 As the Postal Service continued to face financial difficulties, it implemented voluntary early retirement and replaced career employees with noncareer employees.14 As a result, employment in the U.S. Postal Service continued to trend down
Conversely, in 2013, both state and local governments began to recover from their employment downturns. The changes in employment trends mirrored similar trend changes in both consumption expenditures and gross investment by state and local governments, which, in the second quarter of 2013, began to increase after a downward trend that had lasted more than 3 years.15
State government gained 39,000 jobs between an employment low in July 2013 and December 2013, with essentially all of the gain occurring in state government education. State education, which includes state colleges and universities, was not strongly affected by the most recent recession: state government education accounted for only 11,000 of the 189,000 public sector jobs lost between state government’s employment’s all-time high in August 2008 and its most recent low in July 2013. The non-education component of state government employment changed little in 2013.
Local government employment also started to recover over the year, edging up by 39,000 jobs between an employment low in March 2013 and December 2013; however, in contrast to state government employment, most of the change occurred in the non-education portion. The education component of local government employment, which primarily consists of local public school jobs, showed little net change from December 2012 to December 2013.
OVER THE YEAR, NONFARM PAYROLL EMPLOYMENT CONTINUED TO RECOVER after a severe downturn from January 2008 through February 2010, thereby posting the lengthiest employment recovery in the history of the CES survey. Professional and business services, food services and drinking places, retail trade, and health care continued as the major contributors to job growth in 2013. Employment growth accelerated over the year in professional and business services, retail trade, construction, and mining, while manufacturing, health care, financial activities, and transportation and warehousing experienced slower job growth. In the public sector, federal government employment continued to trend down, while state and local government employment started to recover.
!--?pagebreak>!--?pagebreak>!--?pagebreak>!--?pagebreak>!--?pagebreak>Kara Sullivan, "Nonfarm employment continued its road to recovery in 2013," Monthly Labor Review, U.S. Bureau of Labor Statistics, March 2014, https://doi.org/10.21916/mlr.2014.10
1 The Current Employment Statistics (CES) program, which provides detailed industry data on employment, hours, and earnings of workers on nonfarm payrolls, is a monthly survey of about 144,000 businesses and government agencies, representing approximately 554,000 individual worksites. For more information on the program’s concepts and methodology, see “Technical notes to establishment survey data,” https://www.bls.gov/web/empsit/cestn.htm. To access CES data, see “Current Employment Statistics—CES (national),” https://www.bls.gov/ces. The CES data used in this article are seasonally adjusted unless otherwise noted.
2 Bureau of Economic Analysis, “Gross domestic product & income,” table 1.1.1, https://www.bea.gov/iTable/iTable.cfm?ReqID=9&step=1#reqid=9&step=1&isuri=1.
3 “Consumer Price Index – January 2014” news release (Bureau of Labor Statistics, February 20, 2014), https://www.bls.gov/news.release/pdf/cpi.pdf. The Consumer Price Index (CPI) is a measure of the average change over time in the prices paid by urban consumers for a market basket of consumer goods and services.
4 Consumer Confidence Index, http://www.conference-board.org/data/consumerconfidence.cfm, (Accessed Feb. 12, 2014) ; National income and product account tables, “Personal income and its disposition,” table 2.1 (Bureau of Economic Analysis, January 30, 2014),
https://www.bea.gov/iTable/iTable.cfm?ReqID=9&step=1#reqid=9&step=1&isuri=1&910=x&911=0&903=58&904=2010&905=2013&906=a.
5 Monthly retail sales & seasonal factors 1992–present (adjusted), (U.S. Census Bureau, February 13, 2014), https://www.census.gov/retail/marts/www/timeseries.html.
6 Monthly retail sales & seasonal factors 1992–present (adjusted).
7 Advance monthly sales for retail and food services, table 1 (U.S. Census Bureau, February 13, 2014), https://www2.census.gov/retail/releases/historical/marts/adv1401.pdf
8 New privately owned housing units started, monthly seasonally adjusted (U.S. Census Bureau, February 19, 2014), https://www.census.gov/construction/nrc/historical_data/index.html; and
NAHB/Wells Fargo Housing Market Index (HMI), table 2, (National Association of Home Builders, February 18, 2014), http://www.nahb.org/reference_list.aspx?sectionID=134.
9 Value of private construction put in place—seasonally adjusted annual rate, (U.S. Census Bureau, February 3, 2014), https://www.census.gov/construction/c30/historical_data.html.
10 National income and product accounts, table 2.3.1, “Percent change from preceding period in real personal consumption expenditures by major type of product” (Bureau of Economic Analysis, January 30, 2014), https://www.bea.gov/iTable/iTable.cfm?ReqID=9&step=1#reqid=9&step=1&isuri=1.
11 2013 expanded and supplementary tables: HI cost and income rates (Centers for Medicare & Medicaid Services, May 31, 2013), http://www.cms.gov/Research-Statistics-Data-and-Systems/Statistics-Trends-and-Reports/ReportsTrustFunds/index.html?redirect=/reportstrustfunds/.
12 With the release of data on February 7, 2014, historical data for services for the elderly and disabled was reconstructed back to April 1979. Employment for a number of state programs that provide funding for services for the elderly and disabled had been incorrectly coded as being in private households (NAICS 814). With the first quarter of 2013, that employment was reclassified as services for the elderly and disabled. For more information, see https://www.bls.gov/web/empsit/cesbmart.htm#Reconstruction.
13 National income and product account tables, personal income and its disposition, table 1.1.1 (Bureau of Economic Analysis, January 30, 2014), https://www.bea.gov/iTable/iTable.cfm?ReqID=9&step=1#reqid=9&step=1&isuri=1&910=x&911=0&903=58&904=2010&905=2013&906=a.
14 “United States Postal Regulatory Commission, form 10-Q” (U.S. Postal Service, Quarterly financial report, February 7, 2013), http://about.usps.com/who-we-are/financials/financial-conditions-results-reports/fy2014-q1.pdf.
15 National income and product account tables, government current receipts and expenditures, table 1.1.1 (Bureau of Economic Analysis, February 2014), https://www.bea.gov/iTable/iTable.cfm?ReqID=9&step=1#reqid=9&step=3&isuri=1&.