
An official website of the United States government
An official website of the United States government
The .gov means it's official.
Federal government websites often end in .gov or .mil. Before sharing sensitive information,
make sure you're on a federal government site.
The site is secure.
The
https:// ensures that you are connecting to the official website and that any
information you provide is encrypted and transmitted securely.
Crossref 0
Surrogate Champions for the Poor, Poor Representation, 2018.
Achieving Better Representation, Poor Representation, 2018.
Development and application of machine learning models in US consumer price index forecasting: Analysis of a hybrid approach, Data Science in Finance and Economics, 2024.
The Political Visibility of the Poor, Poor Representation, 2018.
Congressional Unresponsiveness to the Poor, Poor Representation, 2018.
One hundred years of piñon nuts, a largely forgotten wild food crop from the American Southwest (1850–1950), Trees, Forests and People, 2024.
Updating Wilkie's Economic Scenario Generator for U.S. Applications, SSRN Electronic Journal , 2017.
Index, Poor Representation, 2018.
Poor Representation, Poor Representation, 2018.
AI meets economics: Can deep learning surpass machine learning and traditional statistical models in inflation time series forecasting?, Data Science in Finance and Economics, 2025.
Legislators’ Unresponsiveness to the Poor, Poor Representation, 2018.
Positioned for Legislative Success, Poor Representation, 2018.
What about the Poor?, Poor Representation, 2018.
Congressional Inaction for the Poor, Poor Representation, 2018.
The 2017 Data Challenge of the American Statistical Association, Computational Statistics, 2022.
Bibliography, Poor Representation, 2018.
Development and application of machine learning models in US consumer price index forecasting: Analysis of a hybrid approach, Data Science in Finance and Economics, 2024.
Long-Run Discounting and Climate Change: Evidence from Real Estate, SSRN Electronic Journal, 2015.
Interdisciplinary Thinking: Financial Literacy Crosses Disciplinary Boundaries, PRIMUS, 2021.
For 100 years now, the Consumer Price Index has measured price change in the U.S. economy. Breaking the 100-year period into several distinct subperiods, this article examines major patterns and trends in price change during each one and highlights notable features of the CPI data. Also discussed are the reaction of the public and policymakers to the inflation of the day and the inflation experience of Americans in each subperiod.
The year 2013 marked, in a sense, the 100th anniversary of the Consumer Price Index (CPI), because 1913 is the first year for which official CPI data became available. For 100 years, the index has been a major measure of consumer inflation in the U.S. economy, through war and peace, booms and recessions. Over those 100 years, the general public and policymakers have focused almost constantly on inflation; they have feared it, bemoaned it, sought it, and even tried to whip it. Different subperiods saw different trends in price movement, so each generation of Americans had a different experience of price change from the ones before and after it. This article looks at major trends in price change from one subperiod to the next and at how Americans and their leaders regarded those trends and reacted to them.
Largest 12-month increase: June 1919–June 1920, 23.7 percent
Largest 12-month decrease: June 1920–June 1921, 15.8 percent
Annualized increase of major components, 1913–1929:
Prices of selected items, 1913:
It’s March 15, 1913, and according to The New York Times, the National Housewives League is concerned. Meat prices are up, and the group wants something done about it. In huge print, a headline proclaims their solution: “Raise meat animals, housewives advise. Tell the home farmers that is up to them to check soaring prices.”1
A few months later, the same newspaper reported on a bulletin issued by the Bureau of Labor Statistics (BLS, the Bureau). The bulletin’s data showed the reason for the League’s concern: although the price of several staples had fallen from January to February, meat prices were up. Moreover, most meat prices were considerably higher in 1913 than they were throughout the 1890s. Smoked bacon had increased 111.6 percent, for example. Round steak had risen 84.5 percent.2
Whatever the home farmers may or may not have done, however, the coming years would produce more price increases. When the CPI was finally created in 1921 and a time series back to 1913 was established, it would show food prices more than doubling from 1913 to 1920. Only a sharp recession in 1921 would produce a decline.
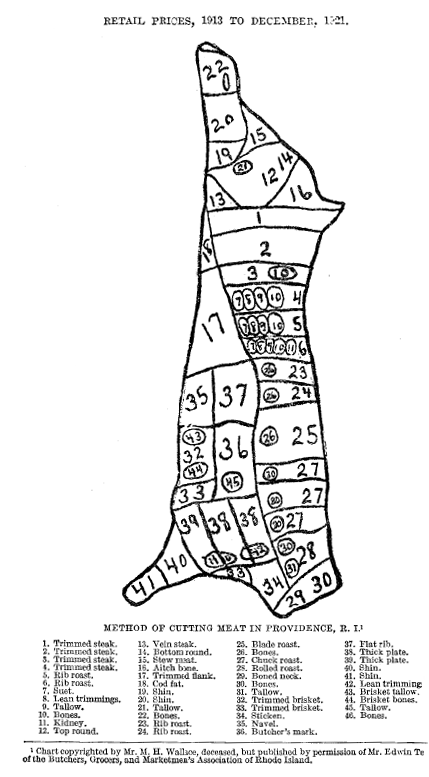
So, even before the existence of the CPI, inflation was on the minds of the public and in the headlines of the news. Indeed, in some ways, little seems to have changed over the past 100 years. Price increases, particularly in frequently purchased goods, vex the public and greatly color its perception of the economy. Of course, BLS price data were controversial even before the existence of the CPI: a March 2, 1914, story published in The New York Times details criticism of BLS bulletins as providing misleading data about the cost of living. J. W. Sullivan, an author and activist, wrote to Secretary of Labor William B. Wilson, asserting that the bulletins were “inadequate as a basis for percentages representing the general cost of living.”3 Indeed, general dissatisfaction with the state of price statistics helped lead to the creation of what became the official CPI. As prices increased during and following World War I, a consensus was reached that the existing data, consisting predominantly of food price measures, was inadequate as a basis for measuring the cost of living or the general price level. More comprehensive price collection in 92 cities began in 1917, and in 1919 the Bureau began publishing semiannual cost-of-living data for 32 cities. Estimates back to 1913 for the country as a whole also were created, although some wholesale price data were used to augment the retail price data. Regular publication of the official U.S. CPI began in February 1921.4 A survey of White wage-earner families in 92 cities formed the basis of the market basket used to calculate the early CPI. The major groups of that CPI (then called the Cost of Living Index) were food, clothing, housing, fuel and light, housefurnishings, and miscellaneous.5 A more detailed look at what was actually being priced provides a glimpse into the nation’s life at the time. Food staples dominated. Beef was of particular importance; indeed, one BLS bulletin from 1923 shows several diagrams of cows, illustrating the way beef was cut in different cities. The men’s clothing index of 1919 prominently included straw hats. Durable goods were few; there were no cars or radios priced in the early CPI.
| Month and year | Percent change |
|---|---|
Jan 1914 | 2.4 |
Feb 1914 | 1.7 |
Mar 1914 | 1.4 |
Apr 1914 | .0 |
May 1914 | 1.4 |
June 1914 | 1.7 |
July 1914 | 1.7 |
Aug 1914 | 2.3 |
Sep 1914 | 2.3 |
Oct 1914 | 1.0 |
Nov 1914 | 1.0 |
Dec 1914 | 1.0 |
Jan 1915 | .7 |
Feb 1915 | 1.0 |
Mar 1915 | .3 |
Apr 1915 | 2.4 |
May 1915 | 2.0 |
June 1915 | 1.7 |
July 1915 | .7 |
Aug 1915 | -.7 |
Sep 1915 | -.7 |
Oct 1915 | 1.0 |
Nov 1915 | 1.3 |
Dec 1915 | 2.0 |
Jan 1916 | 3.3 |
Feb 1916 | 4.0 |
Mar 1916 | 6.0 |
Apr 1916 | 6.0 |
May 1916 | 6.0 |
June 1916 | 6.9 |
July 1916 | 6.9 |
Aug 1916 | 8.3 |
Sep 1916 | 9.9 |
Oct 1916 | 10.1 |
Nov 1916 | 11.3 |
Dec 1916 | 11.6 |
Jan 1917 | 11.8 |
Feb 1917 | 14.4 |
Mar 1917 | 13.9 |
Apr 1917 | 17.9 |
May 1917 | 20.0 |
June 1917 | 19.8 |
July 1917 | 18.5 |
Aug 1917 | 18.9 |
Sep 1917 | 18.9 |
Oct 1917 | 19.5 |
Nov 1917 | 17.7 |
Dec 1917 | 18.5 |
Jan 1918 | 19.4 |
Feb 1918 | 17.9 |
Mar 1918 | 16.7 |
Apr 1918 | 13.0 |
May 1918 | 12.8 |
June 1918 | 13.7 |
July 1918 | 17.7 |
Aug 1918 | 17.9 |
Sep 1918 | 18.6 |
Oct 1918 | 18.6 |
Nov 1918 | 20.2 |
Dec 1918 | 20.5 |
Jan 1919 | 18.4 |
Feb 1919 | 14.7 |
Mar 1919 | 16.7 |
Apr 1919 | 17.4 |
May 1919 | 16.9 |
June 1919 | 15.0 |
July 1919 | 15.3 |
Aug 1919 | 15.2 |
Sep 1919 | 13.2 |
Oct 1919 | 13.2 |
Nov 1919 | 14.0 |
Dec 1919 | 14.8 |
Jan 1920 | 16.8 |
Feb 1920 | 20.9 |
Mar 1920 | 20.6 |
Apr 1920 | 21.8 |
May 1920 | 22.1 |
June 1920 | 23.7 |
July 1920 | 19.6 |
Aug 1920 | 14.5 |
Sep 1920 | 12.6 |
Oct 1920 | 10.1 |
Nov 1920 | 6.8 |
Dec 1920 | 2.3 |
Jan 1921 | -1.4 |
Feb 1921 | -5.6 |
Mar 1921 | -7.3 |
Apr 1921 | -11.0 |
May 1921 | -14.1 |
June 1921 | -15.8 |
July 1921 | -15.1 |
Aug 1921 | -12.5 |
Sep 1921 | -12.5 |
Oct 1921 | -12.2 |
Nov 1921 | -12.1 |
Dec 1921 | -10.7 |
Jan 1922 | -11.1 |
Feb 1922 | -8.3 |
Mar 1922 | -8.8 |
Apr 1922 | -7.6 |
May 1922 | -5.8 |
June 1922 | -5.1 |
July 1922 | -5.1 |
Aug 1922 | -6.4 |
Sep 1922 | -5.1 |
Oct 1922 | -4.4 |
Nov 1922 | -3.5 |
Dec 1922 | -2.5 |
Jan 1923 | -.8 |
Feb 1923 | -.8 |
Mar 1923 | .8 |
Apr 1923 | 1.2 |
May 1923 | 1.4 |
June 1923 | 1.8 |
July 1923 | 2.6 |
Aug 1923 | 3.2 |
Sep 1923 | 3.6 |
Oct 1923 | 3.2 |
Nov 1923 | 3.0 |
Dec 1923 | 2.6 |
Jan 1924 | 2.8 |
Feb 1924 | 2.6 |
Mar 1924 | 1.6 |
Apr 1924 | .8 |
May 1924 | .6 |
June 1924 | .0 |
July 1924 | -.8 |
Aug 1924 | -.6 |
Sep 1924 | -.8 |
Oct 1924 | -.6 |
Nov 1924 | -.4 |
Dec 1924 | -.2 |
Jan 1925 | .2 |
Feb 1925 | .2 |
Mar 1925 | 1.0 |
Apr 1925 | 1.2 |
May 1925 | 1.6 |
June 1925 | 2.7 |
July 1925 | 3.9 |
Aug 1925 | 4.1 |
Sep 1925 | 3.3 |
Oct 1925 | 3.3 |
Nov 1925 | 4.7 |
Dec 1925 | 3.9 |
Jan 1926 | 3.7 |
Feb 1926 | 3.7 |
Mar 1926 | 2.9 |
Apr 1926 | 4.1 |
May 1926 | 3.1 |
June 1926 | 1.1 |
July 1926 | -1.1 |
Aug 1926 | -1.7 |
Sep 1926 | -.8 |
Oct 1926 | -.8 |
Nov 1926 | -2.0 |
Dec 1926 | -1.5 |
Jan 1927 | -2.2 |
Feb 1927 | -2.6 |
Mar 1927 | -2.6 |
Apr 1927 | -3.5 |
May 1927 | -2.2 |
June 1927 | -.6 |
July 1927 | -1.5 |
Aug 1927 | -1.5 |
Sep 1927 | -1.5 |
Oct 1927 | -1.3 |
Nov 1927 | -1.9 |
Dec 1927 | -2.1 |
Jan 1928 | -1.5 |
Feb 1928 | -1.7 |
Mar 1928 | -1.2 |
Apr 1928 | -1.0 |
May 1928 | -1.1 |
June 1928 | -2.8 |
July 1928 | -1.0 |
Aug 1928 | -.2 |
Sep 1928 | .0 |
Oct 1928 | -.8 |
Nov 1928 | -.8 |
Dec 1928 | -1.0 |
Jan 1929 | -1.0 |
Feb 1929 | -.2 |
Mar 1929 | -.6 |
Apr 1929 | -1.2 |
May 1929 | -1.2 |
June 1929 | .0 |
July 1929 | 1.0 |
Aug 1929 | 1.2 |
Sep 1929 | .2 |
Oct 1929 | .4 |
Nov 1929 | .4 |
Dec 1929 | .2 |
Source: U.S. Bureau of Labor Statistics. | |
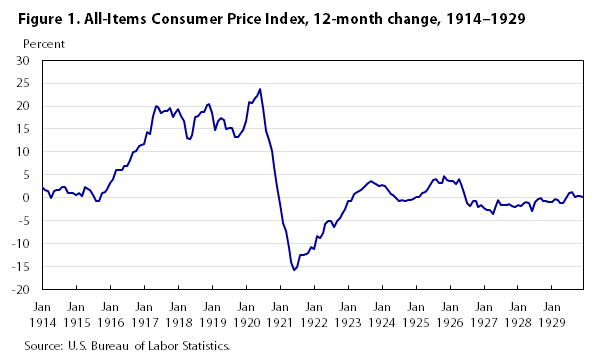
The All-Items CPI increased at a 3.5-percent annual rate from 1913 to 1929 (see figure 1), but that result was arrived at via a volatile path that featured both sharp inflation and deflation. Inflation was modest in 1914 and 1915, around 1 percent, but accelerated sharply in 1916 and was historically high through the World War I period and the immediate postwar era. Prices then fell sharply during the steep recession of the early 1920s. The years 1923 to 1929 were a much quieter time for price movements, with the CPI showing modest price changes throughout the period, although the slight deflation in 1927 and 1928 is perhaps surprising given the general perception of the middle and later 1920s as a time of economic boom.
Data suggest that, despite the frustrations of the Housewives League, inflation was slight from 1913 to 1915, although some caveats are likely in order in considering the data of that period. The year 1916, however, saw rapid acceleration in the inflation rate. The 12-month change in the CPI rose from 3.3 percent in January to double digits by October. The World War I era and its aftermath, 1917–1920, then produced sustained inflation unmatched in the nation anytime since. Prices rose at an 18.5-percent annualized rate from December 1916 to June 1920, increasing more than 80 percent during that period.
Even a cursory examination of CPI component indexes of the World War I era reveals the breadth of price increases during that period: virtually every series shows sharp increases. Even the series that increased more slowly, such as housing and fuel, were half again more expensive in 1920 than they were in 1915. The prices of most foods, clothing, and dry goods more than doubled.6
The CPI as such didn’t exist throughout most of the period, although there certainly were BLS data documenting the price increases, especially for food. Indeed, it is likely that, to some extent, the high inflation of that time helped lead to the formal creation of the CPI, because, clearly, the need for an accurate measure of the cost of living is greater when the cost of living is changing rapidly.
It is beyond the scope of this article to analyze in detail the World War I–era economy, but surely, the inflation of that time was a result of the war effort. The war’s needs dominated policy and planning, with massive effects on resource allocation. One-fifth of the nation’s resources were devoted to the war effort in 1918,7 and the nonfarm labor force expanded sharply. Government involvement in the economy increased dramatically. Price controls were used, although in a rather haphazard way, with numerous agencies empowered to regulate specific prices. Beginning in August 1917, the U.S. Food Administration and the Federal Fuel Administration had authority over many retail prices.8 There was some rationing, notably of sugar,9 but not the extensive rationing the nation was to see during the World War II era.
Monetary policy during the era was expansionary and surely contributed to the inflation of the time. Money supply measures roughly doubled from 1914 to 1919, with gross national product rising only by about a quarter.10 Fiscal policy featured both massive borrowing, much of it in the form of “Liberty Bonds,” and an extensive set of tax increases and surtaxes.11 Whatever the explanation, the late 1910s stand as the most inflationary period in U.S. history.
Price controls were allowed to lapse shortly after the November 1918 armistice, although there was considerable sentiment to continue them. The economy was contracting as the war ended, and many feared serious postwar deflation and recession without some coordinated plan.12 However, the economy expanded in 1919, and prices continued to rise at a rate similar to that of the war period. Businesses rushing to rebuild depleted inventories and wage earners demanding and receiving cost-of-living increases based on high wartime inflation each contributed upward pressure on prices.13 Various price control instruments were created, the most notable of which was the local “fair-price committees.” These committees could establish fair prices for commodities and receive complaints against sellers for exceeding those prices. A 1919 New York Times article tells of sugar merchants confessing to selling sugar for 13 cents per pound and promising to issue refunds and sell for 11 cents per pound in the future.14 Despite the efforts of these committees, prices continued to rise, and government efforts to curb inflation were widely viewed as a failure. The following tabulation shows the trend in price changes over three distinct periods from July 1916 to September 1922:
| Name | Period | Annualized percent change in All-Items CPI |
| War era | July 1916–November 1918 | 19.1 |
| Postwar expansion | November 1918–June 1920 | 17.3 |
| Recession | June 1920–September 1922 | -9.7 |
As it turned out, however, the feared postwar recession was only delayed, not avoided. Prices continued to rise sharply through June 1920, then abruptly started falling.
The recession of the early 1920s, while not remembered like the Great Depression of the next decade, was a severe one; indeed, it is sometimes termed a depression. Although it featured a significant drop in output and rise in unemployment, the recession is particularly striking for its extraordinary deflation: the CPI dropped more than 20 percent from June 1920 to September 1922, and wholesale price measures dropped even more sharply.
The 12-month increase in the CPI peaked at 23.7 percent in June 1920, just before prices turned downward. This rise exceeded the highs of both the post–World War II era and the early 1980s. The subsequent decline was sharp: the 15.8-percent drop from June 1920 to June 1921 represented a larger 12-month decrease than any registered during the Great Depression of the 1930s. So, it seems fair to say that the post–World War I era was the most volatile period of the last century for consumer prices.
After 1922, however, relative price stability reigned for the rest of the decade. Prices rose an average of 1.4 percent annually from 1922 to 1926, then fell an average of 1.1 percent annually from 1926 to 1929. The 12-month change in the CPI stayed between a rise of 4.1 percent and a decline of 2.8 percent for the entire period, a clear contrast to the double-digit increases and decreases seen from 1916 to 1922. Food prices showed a little more volatility, with a notable spike in 1925. The relative stability that held from 1922 to 1929 did not, however, mean that policymakers didn’t concern themselves with price changes: vigorous debates about prices and attempts at major regulation characterized the period. The agricultural sector did not recover as well as the rest of the economy did from the recession of the early 1920s. Foreshadowing later efforts, concern about inadequately low agricultural prices sparked attempts at regulation in the late 1920s. President Coolidge repeatedly vetoed the McNary–Haugen bill, which would have established agricultural price supports in an attempt to restore relative prices received by agricultural producers to their 1909–1914 average.
Although not enacted, the bill presaged future efforts to control prices not because they were rising too rapidly, but because it was perceived that they were rising insufficiently for producers. As the relative stability and prosperity of the late 1920s turned into the grinding depression of the early 1930s, these efforts would grow in scope and magnitude.
Largest 12-month increase: November 1940–November 1941, 10.0 percent
Largest 12-month decrease: September 1931–September 1932 and October 1931–October 1932, 10.8 percent each
Annualized increase of major components, 1929–1941:
Prices of selected items, 1934:15
After the relative stability of the 1920s, price change remerged as a major concern in the nation with the onset of what would become known as the Great Depression. This time, though, the concern was over prices falling. By the trough of the depression, prices of many goods were below their 1913 levels. As the economy faltered, falling prices became identified with the declining economy. A 1931 New York Times article speaks of retailers avoiding promotional discounts because they “remind consumers of the depression.”16
| Month and year | Percent change |
|---|---|
Jan 1929 | -1.2 |
Feb 1929 | .0 |
Mar 1929 | -.6 |
Apr 1929 | -1.2 |
May 1929 | -1.2 |
Jun 1929 | .0 |
Jul 1929 | 1.2 |
Aug 1929 | 1.2 |
Sep 1929 | .0 |
Oct 1929 | .6 |
Nov 1929 | .6 |
Dec 1929 | .6 |
Jan 1930 | .0 |
Feb 1930 | -.6 |
Mar 1930 | -.6 |
Apr 1930 | .6 |
May 1930 | -.6 |
Jun 1930 | -1.8 |
Jul 1930 | -4.0 |
Aug 1930 | -4.6 |
Sep 1930 | -4.0 |
Oct 1930 | -4.6 |
Nov 1930 | -5.2 |
Dec 1930 | -6.4 |
Jan 1931 | -7.0 |
Feb 1931 | -7.6 |
Mar 1931 | -7.7 |
Apr 1931 | -8.8 |
May 1931 | -9.5 |
Jun 1931 | -10.1 |
Jul 1931 | -9.0 |
Aug 1931 | -8.5 |
Sep 1931 | -9.6 |
Oct 1931 | -9.7 |
Nov 1931 | -10.4 |
Dec 1931 | -9.3 |
Jan 1932 | -10.1 |
Feb 1932 | -10.2 |
Mar 1932 | -10.3 |
Apr 1932 | -10.3 |
May 1932 | -10.5 |
Jun 1932 | -9.9 |
Jul 1932 | -9.9 |
Aug 1932 | -10.6 |
Sep 1932 | -10.7 |
Oct 1932 | -10.7 |
Nov 1932 | -10.2 |
Dec 1932 | -10.3 |
Jan 1933 | -9.8 |
Feb 1933 | -9.9 |
Mar 1933 | -10.0 |
Apr 1933 | -9.4 |
May 1933 | -8.0 |
Jun 1933 | -6.6 |
Jul 1933 | -3.7 |
Aug 1933 | -2.2 |
Sep 1933 | -1.5 |
Oct 1933 | -.8 |
Nov 1933 | .0 |
Dec 1933 | .8 |
Jan 1934 | 2.3 |
Feb 1934 | 4.7 |
Mar 1934 | 5.6 |
Apr 1934 | 5.6 |
May 1934 | 5.6 |
Jun 1934 | 5.5 |
Jul 1934 | 2.3 |
Aug 1934 | 1.5 |
Sep 1934 | 3.0 |
Oct 1934 | 2.3 |
Nov 1934 | 2.3 |
Dec 1934 | 1.5 |
Jan 1935 | 3.0 |
Feb 1935 | 3.0 |
Mar 1935 | 3.0 |
Apr 1935 | 3.8 |
May 1935 | 3.8 |
Jun 1935 | 2.2 |
Jul 1935 | 2.2 |
Aug 1935 | 2.2 |
Sep 1935 | .7 |
Oct 1935 | 1.5 |
Nov 1935 | 2.2 |
Dec 1935 | 3.0 |
Jan 1936 | 1.5 |
Feb 1936 | .7 |
Mar 1936 | .0 |
Apr 1936 | -.7 |
May 1936 | -.7 |
Jun 1936 | .7 |
Jul 1936 | 1.5 |
Aug 1936 | 2.2 |
Sep 1936 | 2.2 |
Oct 1936 | 2.2 |
Nov 1936 | 1.4 |
Dec 1936 | 1.4 |
Jan 1937 | 2.2 |
Feb 1937 | 2.2 |
Mar 1937 | 3.6 |
Apr 1937 | 4.4 |
May 1937 | 5.1 |
Jun 1937 | 4.3 |
Jul 1937 | 4.3 |
Aug 1937 | 3.6 |
Sep 1937 | 4.3 |
Oct 1937 | 4.3 |
Nov 1937 | 3.6 |
Dec 1937 | 2.9 |
Jan 1938 | .7 |
Feb 1938 | .0 |
Mar 1938 | -.7 |
Apr 1938 | -.7 |
May 1938 | -2.1 |
Jun 1938 | -2.1 |
Jul 1938 | -2.8 |
Aug 1938 | -2.8 |
Sep 1938 | -3.4 |
Oct 1938 | -4.1 |
Nov 1938 | -3.4 |
Dec 1938 | -2.8 |
Jan 1939 | -1.4 |
Feb 1939 | -1.4 |
Mar 1939 | -1.4 |
Apr 1939 | -2.8 |
May 1939 | -2.1 |
Jun 1939 | -2.1 |
Jul 1939 | -2.1 |
Aug 1939 | -2.1 |
Sep 1939 | .0 |
Oct 1939 | .0 |
Nov 1939 | .0 |
Dec 1939 | .0 |
Jan 1940 | -.7 |
Feb 1940 | .7 |
Mar 1940 | .7 |
Apr 1940 | 1.4 |
May 1940 | 1.4 |
Jun 1940 | 2.2 |
Jul 1940 | 1.4 |
Aug 1940 | 1.4 |
Sep 1940 | -.7 |
Oct 1940 | .0 |
Nov 1940 | .0 |
Dec 1940 | .7 |
Jan 1941 | 1.4 |
Feb 1941 | .7 |
Mar 1941 | 1.4 |
Apr 1941 | 2.1 |
May 1941 | 2.9 |
Jun 1941 | 4.3 |
Jul 1941 | 5.0 |
Aug 1941 | 6.4 |
Sep 1941 | 7.9 |
Oct 1941 | 9.3 |
Nov 1941 | 10.0 |
Dec 1941 | 9.9 |
Source: U.S. Bureau of Labor Statistics. | |
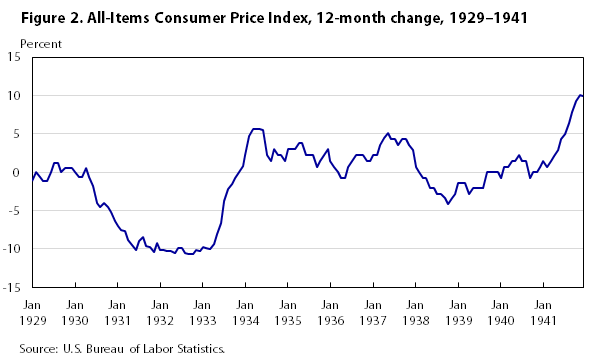
And prices were indeed falling in the early 1930s. From October 1929, the month of the famed crash, to the trough in April 1933, the All-Items CPI declined 27.4 percent. (See figure 2.) The deflation was deep and virtually across the board: essentially no categories of goods failed to show declines. All major CPI categories were lower in June 1933 than they were in June 1929. The following tabulation shows the percent changes in the major CPI components across three distinct subperiods from 1929 to 1941.
| Group | Subperiod, annualized percent change | ||
| December 1929–June 1933 | June 1933–September 1937 | September 1937–June 1941 | |
| All items | -8.3 | 3.3 | 0.1 |
| Food | -13.0 | 6.6 | -.5 |
| Clothing | -8.3 | 5.2 | -.5 |
| Rent | -9.1 | .5 | 1.0 |
| Fuel, electricity, and ice | -4.4 | .7 | .4 |
| Housefurnishings | -8.5 | 6.5 | -.4 |
| Miscellaneous | -2.0 | .9 | .4 |
Food still accounted for more than 30 percent of a household’s expenditures (and more than 30 percent of the weight of the CPI) and was more volatile than other groups. Food and clothing together accounted for nearly half of the weight of the index, compared with less than a fifth today. However, food was less dominant than in the World War I era, after which durable goods became a larger part of the lives of many consumers.
The following tabulation lists the relative importance, as a percentage of the market basket, of each major CPI group for the period 1935–1939, as reported at the time:
| Group | Relative importance, percent |
| All items | 100.0 |
| Food | 33.9 |
| Clothing | 10.5 |
| Rent | 18.1 |
| Fuel, electricity, and ice (including utilities) | 6.4 |
| Housefurnishings | 4.2 |
| Miscellaneous (including medical care and recreation) | 26.9 |
Translated into the current item structure of the CPI, the percentages look like this:
| Group | Relative importance, percent |
| All items | 100.0 |
| Food | 35.4 |
| Housing (including utilities) | 33.7 |
| Apparel | 11.0 |
| Transportation | 8.2 |
| Medical care | 4.0 |
| Recreation | 2.9 |
| Other goods and services | 5.3 |
Under the old structure, the housefurnishings group included not only furniture, tables, and blankets, but also radios and washing machines. The “miscellaneous” group included what currently are the major groups of transportation, medical care, recreation, and “other goods and services.” Household operations, now part of the housing group, also were included in the “miscellaneous” category, as were automobiles, which accounted for nearly 8 percent of the “miscellaneous” index (around 2 percent of the All-items index) by the late 1930s. Gasoline, in the “miscellaneous” group as well, accounted for almost as much.
Medical care specifics of the time depict the very different state of health care. Prescription drugs were divided into “nonnarcotic liquid,” “nonnarcotic capsules,” and “narcotic liquid.” Quinine, castor oil, and milk of magnesia were classified as nonprescription medications. Appendectomies, tonsillectomies, and house visits were among the medical care services listed.
Laundry service and telephone service were among the largest categories within household operations. Recreation was composed of newspapers, motion picture tickets, and tobacco. The “miscellaneous” group was less volatile than other groups, showing considerable stability through the whole decade.
Declining prices were seen by some as the fundamental problem afflicting the economy, the one that had to be solved to turn things around. There was great disagreement about the means of accomplishing that, however. At the same time, there were, on the one hand, fears of deflation and hoarding, and on the other, skepticism that measures to address these problems would prove inflationary. Even before President Roosevelt and the New Deal, the government’s measures generated disagreement. A February 1932 New York Times letter to the editor is typical:17
Much misunderstanding has resulted from the hurling back and forth of the words “inflation” and “deflation” by proponents and opponents of credit-relief proposals. The President [Hoover] and his advisers insist that their objective is merely to stop “deflation.” “No.” say both foreign and domestic critics; you are bringing about inflation.” Now, which is which?
In any case, the measures failed to stop deflation, and by 1933 and the onset of the Roosevelt administration, public opinion and political will shifted toward activist policies (although sharp disagreement persisted). As faith in market forces diminished, competition that put downward pressure on prices was seen as destructive. The National Industrial Recovery Act arose out of a perspective that such competition had to be controlled if the economy were to be stabilized. The act represented the idea that planning, rather than the market forces, which seemed to be failing, was needed to achieve economic stability. In signing the act, President Roosevelt remarked,18
Its goal is the assurance of a reasonable profit to industry and living wages for labor, with the elimination of the piratical methods and practices which have not only harassed honest business but also contributed to the ills of labor.
The National Industrial Recovery Act brought attempts at wage and price controls back into the economy on a large scale. Codes of “fair competition” were to be created to prevent what was termed “destructive competition.” The National Recovery Administration, the agency established to administer the act, had wide power to control prices. It was well known among those creating and enforcing the codes that the administration had sought to get prices moving upward.19 Price increases were seen as patriotic. In some cases, minimum prices were set, effectively stopping any price competition. In other cases, various restrictions were placed on pricing behavior.
The act would have a short and perhaps rather ineffectual life, however. Congressional opposition to its reauthorization mounted, and it was deemed unconstitutional by a unanimous Supreme Court in May 1935.
Both during and after the National Recovery Administration’s attempts at price control, prices did move upward, although they did not return to their precrash levels. The All-Items CPI rose 16.5 percent from April 1933 to September 1937, but remained 15.6 percent below its precrash peak. Nonetheless, the upward trend in prices did not coincide with great progress in alleviating the depression: unemployment averaged around 18 percent and gross national product was far below its long-term trend.20 Economists have posited different explanations for this persistent inflation during a time of very weak economic performance: the direct and indirect effects of the National Recovery Administration, monetary devaluation, and short-run increases in output.21 Whatever the explanation, serious deflation characterizes only the early part of the Great Depression.
Prices did turn downward again in 1937, although price change from 1937 until the World War II era was generally modest. The All-Items CPI started falling after its September 1937 peak, decreasing by more than 4 percent by August of 1940. The decline in the food index was steeper: the index fell by more than 13 percent by June of 1939, although it did start to recover after that. Some attribute the downturn to tighter monetary policy, as Treasury Secretary Henry Morgenthau and Federal Reserve Chairman Marriner Eccles came to fear the possibility of simultaneous high unemployment and high inflation. The irony of fearing inflation after years of seeking it was not lost on John Maynard Keynes, who famously remarked, “They profess to fear that for which they dare not hope.”22
So, 10 years after the October 1929 crash, prices were still well below precrash levels (and even farther below the 1920 peak). The 1939 food index was about half of the 1920 index. Prices were relatively flat in 1940, but started to accelerate in earnest in 1941 as the depression yielded to the World War II era. However, as table 1 shows, even by mid-1941, the All-Items index and all of its major components were still below their 1929 levels.
| Month and year | All items | Food | Clothing | Rent | Fuel, electricity, and ice | Housefurnishings | Miscellaneous |
|---|---|---|---|---|---|---|---|
| 1913 average | 70.7 | 79.9 | 69.3 | 92.2 | 61.9 | 59.1 | 50.9 |
| June 1920 | 149.4 | 185 | 209.7 | 119.1 | 104.8 | 169.7 | 100.7 |
| December 1929 | 122.8 | 133.8 | 114.7 | 139.9 | 113.6 | 111.3 | 104.9 |
| June 1933 | 90.8 | 82.2 | 84.8 | 100.1 | 97.2 | 81.5 | 97.8 |
| June 1941 | 104.6 | 105.9 | 103.3 | 105.8 | 101.4 | 105.3 | 103.3 |
| Note: Average of 1935–1939 = 100. Source: U.S. Bureau of Labor Statistics. | |||||||
Ever since World War II, inflation of a greater or lesser degree has been so common as to be taken for granted. Most living Americans have essentially known nothing but inflation. The 12-month change in the All-Items CPI went nearly 54 years without showing a decline. (the last decline prior to March 2009 was in August 1955.) However, before World War II the experience of price change was very different. Prices zigged and zagged rather than following a consistent upward course. In 1941, a middle-age American reflecting on price change over his or her lifetime would recall the sharp price increases of the World War I era, deflationary periods in the early twenties and during the depression, and the relative price stability of most of the 1920s. The annual All-Items CPI increased 18 times and declined 10 times from 1913 through 1941. The limited price data from the 19th century also show no pattern of consistent inflation; indeed, evidence suggests that there was net deflation over the course of that century, with prices lower at the end than the beginning.23
In addition, Americans of that time experienced multiple serious attempts by the government to control prices in different ways. Though not necessarily successful and perhaps haphazardly implemented, various price control measures were at least considered in response to virtually every crisis of the era: World War I, post–World War I inflation, the agricultural recession of the 1920s, and the deflation of the early 1930s.
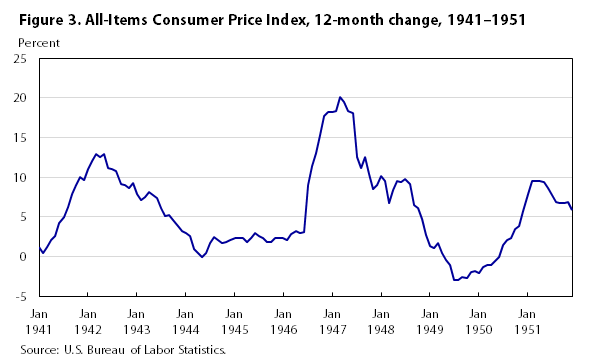
Largest 12-month increase: March 1946–March 1947, 20.1 percent
Largest 12-month decrease: July 1948–July 1949, 2.9 percent
Annualized increase of major components, 1941–1951:
Prices of selected food items, 1947:
| Month and year | Percent change |
|---|---|
Jan 1941 | 1.2 |
Feb 1941 | .5 |
Mar 1941 | 1.2 |
Apr 1941 | 2.1 |
May 1941 | 2.6 |
Jun 1941 | 4.3 |
Jul 1941 | 5.0 |
Aug 1941 | 6.2 |
Sep 1941 | 7.9 |
Oct 1941 | 9.0 |
Nov 1941 | 10.0 |
Dec 1941 | 9.7 |
Jan 1942 | 11.1 |
Feb 1942 | 12.1 |
Mar 1942 | 13.0 |
Apr 1942 | 12.6 |
May 1942 | 13.0 |
Jun 1942 | 11.2 |
Jul 1942 | 11.1 |
Aug 1942 | 10.8 |
Sep 1942 | 9.1 |
Oct 1942 | 9.0 |
Nov 1942 | 8.7 |
Dec 1942 | 9.3 |
Jan 1943 | 7.9 |
Feb 1943 | 7.2 |
Mar 1943 | 7.5 |
Apr 1943 | 8.1 |
May 1943 | 7.8 |
Jun 1943 | 7.4 |
Jul 1943 | 6.1 |
Aug 1943 | 5.1 |
Sep 1943 | 5.3 |
Oct 1943 | 4.6 |
Nov 1943 | 3.8 |
Dec 1943 | 3.2 |
Jan 1944 | 3.0 |
Feb 1944 | 2.6 |
Mar 1944 | 1.0 |
Apr 1944 | .4 |
May 1944 | .0 |
Jun 1944 | .4 |
Jul 1944 | 1.7 |
Aug 1944 | 2.5 |
Sep 1944 | 2.1 |
Oct 1944 | 1.7 |
Nov 1944 | 1.9 |
Dec 1944 | 2.1 |
Jan 1945 | 2.3 |
Feb 1945 | 2.3 |
Mar 1945 | 2.3 |
Apr 1945 | 1.9 |
May 1945 | 2.3 |
Jun 1945 | 3.0 |
Jul 1945 | 2.6 |
Aug 1945 | 2.3 |
Sep 1945 | 1.9 |
Oct 1945 | 1.9 |
Nov 1945 | 2.3 |
Dec 1945 | 2.3 |
Jan 1946 | 2.3 |
Feb 1946 | 2.1 |
Mar 1946 | 2.8 |
Apr 1946 | 3.2 |
May 1946 | 3.0 |
Jun 1946 | 3.1 |
Jul 1946 | 9.0 |
Aug 1946 | 11.4 |
Sep 1946 | 13.1 |
Oct 1946 | 15.3 |
Nov 1946 | 17.7 |
Dec 1946 | 18.2 |
Jan 1947 | 18.2 |
Feb 1947 | 18.4 |
Mar 1947 | 20.1 |
Apr 1947 | 19.5 |
May 1947 | 18.4 |
Jun 1947 | 18.1 |
Jul 1947 | 12.5 |
Aug 1947 | 11.2 |
Sep 1947 | 12.6 |
Oct 1947 | 10.4 |
Nov 1947 | 8.5 |
Dec 1947 | 9.0 |
Jan 1948 | 10.2 |
Feb 1948 | 9.5 |
Mar 1948 | 6.8 |
Apr 1948 | 8.4 |
May 1948 | 9.5 |
Jun 1948 | 9.4 |
Jul 1948 | 9.8 |
Aug 1948 | 9.1 |
Sep 1948 | 6.5 |
Oct 1948 | 6.1 |
Nov 1948 | 4.8 |
Dec 1948 | 2.7 |
Jan 1949 | 1.4 |
Feb 1949 | 1.1 |
Mar 1949 | 1.7 |
Apr 1949 | .4 |
May 1949 | -.4 |
Jun 1949 | -1.0 |
Jul 1949 | -2.9 |
Aug 1949 | -3.0 |
Sep 1949 | -2.6 |
Oct 1949 | -2.7 |
Nov 1949 | -1.9 |
Dec 1949 | -1.8 |
Jan 1950 | -2.1 |
Feb 1950 | -1.3 |
Mar 1950 | -1.1 |
Apr 1950 | -1.1 |
May 1950 | -.6 |
Jun 1950 | -.1 |
Jul 1950 | 1.5 |
Aug 1950 | 2.1 |
Sep 1950 | 2.4 |
Oct 1950 | 3.5 |
Nov 1950 | 3.8 |
Dec 1950 | 5.8 |
Jan 1951 | 7.9 |
Feb 1951 | 9.5 |
Mar 1951 | 9.5 |
Apr 1951 | 9.5 |
May 1951 | 9.4 |
Jun 1951 | 8.7 |
Jul 1951 | 7.8 |
Aug 1951 | 6.9 |
Sep 1951 | 6.8 |
Oct 1951 | 6.8 |
Nov 1951 | 6.9 |
Dec 1951 | 5.9 |
Source: U.S. Bureau of Labor Statistics. | |
A graph of the 12-month change in the All-Items CPI hints at the tumultuous wartime and postwar story of the index. (See figure 3.) Inflation rose sharply in the month before and after the onset of the war as the economy emerged from the Great Depression. The rapid rise in inflation was one factor that led to the price controls which reined inflation in during the rest of the war years. After the war, the suppressed inflation reemerged as controls were relaxed and pent-up demand was released. Prices then plunged back down as a postwar recession took hold. Prices then recovered, largely because of the outbreak of the Korean War. The 1941–1951 period divides neatly into five subperiods, shown in the following tabulation:
| Subperiod | Annualized percent change | |
| All items | Food | |
| January 1941–May 1943 | 9.8 | 18.0 |
| May 1943–February 1946 | 1.2 | -1.0 |
| February 1946–August 1948 | 12.8 | 19.3 |
| August 1948–February 1950 | -2.8 | -6.8 |
| February 1950–December 1951 | 6.8 | 10.0 |
Inflation was already accelerating by the time Pearl Harbor drew America into World War II. The All-Items CPI rose nearly 10 percent during 1941. Over the first 5 months of 1942, the index rose at almost a 13-percent annual rate, with food prices leading the way with a 20-percent yearly rise. Given that price controls had been used or considered repeatedly in response to various crises that had arisen over the previous few decades, it is hardly surprising that such controls would be viewed as the solution to wartime inflation.
Controls were administered and overseen by the Office of Price Administration (OPA), which became an independent agency in January 1942 and saw its powers extended and expanded in October of that year with the passage of the Emergency Stabilization Act.
An OPA training manual displays an example of the thinking of the time and lays out the case for price control:24
Business as usual is impossible under conditions of total war. People have more money, but there is less for them to buy. As this greater amount of money bids for smaller quantities of goods, prices rise. It is the duty, then, of the OPA to keep the cost of living down so that everyone can have enough to eat, to wear, and a place to live—through price control.
Although there had been a number of efforts at controlling prices during World War I and the depression, World War II price controls were far broader and more effectual than previous efforts. Price controls and rationing dominated resource allocation during the war period. One estimate suggests that the general price controls reduced the price level more than 30 percent below what it would have been without them.25 Price control on such a scale was truly a massive effort: in June 1943, the OPA established more than 200 Industry Advisory Committees to aid in the price control effort.
Of course, resource allocation in World War II was not only focused on controlling inflation; the overarching purpose was to direct resource allocation toward war needs. Consumer goods such as refrigerators and automobiles were banned from production. By 1943, the market basket of the typical consumer was dramatically different than it was before the war. Any durable goods purchased were likely used, rationing meant that less gasoline was being purchased, and many food staples were rationed or in short supply.
The interpretation of price behavior during such a time is conceptually difficult. Many prices were relatively low compared with prices that prevailed during other periods (e.g., the OPA proudly noted that egg prices were less than half of their 1920 levels),26 but consumers were not free to take advantage of the low prices because of scarcity or rationing. Numerous goods, particularly durable goods such as cars and appliances, were essentially unavailable (“essentially” because black markets certainly existed). CPI weights were adjusted during wartime to reflect the new reality. New automobiles and new tires, for instance, were dropped from the index and replaced with their used counterparts or, in some areas, dropped from the index altogether. The weight applied to gasoline was sharply reduced as rationing took hold. By 1943, many durable goods, such as refrigerators and radios, were also dropped from the index as their stocks were exhausted.27
Many goods that could be obtained were likely of diminished quality, as war demands constrained resources and materials. Whereas the modern CPI attempts to account for quality change, the prices measurements of the time did not attempt to account for the decreases in quality during the war years or the likely improvement in quality after the war ended. (One exception, however, is changes in packaging sizes. For example, an 8-ounce package of corn flakes was reduced to 6 ounces. Similarly to the way BLS current procedures treat the matter, the Bureau recorded this reduction in size as a price increase.) One estimate is that decreases in quality caused the CPI to understate inflation by a cumulative 5 percent during the war years.28
Most price controls were lifted in 1946. Prices started increasing in March and jumped 5.9 percent in July alone. (Food prices rose 13.8 percent in July after many food price controls expired June 30.) Prices increased more than 15 percent in the second half of 1946. The surge was not merely the story of price controls being lifted, however: strong inflation continued through 1947, driven by increases in demand as well as shortages and diminished crops.29 Food prices in particular rose dramatically during this period as the CPI food index increased by a third in the last 10 months of 1946 and by over 55 percent from February 1946 to its August 1948 peak. Prices for meats more than doubled over the period, and all the major CPI group indexes of the time increased, with only rent rising less than 20 percent.
The postwar inflationary boom ended abruptly in late 1948; prices that were rising sharply in the spring were falling by autumn. The abatement of pent-up demand from the war, bumper crops of several agricultural products, and tighter monetary policy were among the causes cited as contributing to the reversal.30 In any case, food prices started falling in summer, and the prices of apparel and other commodities soon followed by the fall. (Rent prices, however, continued to rise modestly.) The following tabulation shows the total percent change for six major CPI groups over two distinct subperiods falling within the period from 1946 to 1950:31
| Group | Subperiod, percent change | |
| February 1946–August 1948 | August 1948–February 1950 | |
| Food | 55.2 | -10.1 |
| Apparel | 32.7 | -7.5 |
| Rent | 8.7 | 4.3 |
| Fuel, electricity, and refrigeration | 23.8 | 2.6 |
| Housefurnishings | 30.7 | -5.6 |
| Miscellaneous | 21.3 | 1.8 |
The deflation seen in the tabulation was part of a broad recession that lasted from late 1948 through most of 1949; output fell and unemployment increased. Although history would come to regard this recession as a relatively mild one, it was worrisome at the time. With the memory of the Great Depression still fresh, the downturn in prices and output seemed all too familiar to many. The experience of the past few decades was one of periods of inflation followed by collapses in price and output. A return to normalcy after the war and the subsequent postwar surge in demand, might, it was feared, mean a return to the misery of the 1930s.32
The CPI market basket of 1950 was still one-third food and about 13 percent apparel. (Food and apparel made up about 46 percent of the weight of the index in 1950, compared with about 18 percent in 2013.) Streetcar and bus fares had a greater weight than gasoline (although gasoline did have more than twice the weight of bicycles, or velocipedes, as the tables of the time termed them.) Televisions appeared in the index, with 3 times the weight of radios.
The “miscellaneous” category, composed mostly of what would now be the transportation, medical care, recreation, and “other goods and services” groups, made up about a third of the index in 1950. Many services were included in the category. Services were becoming an increasingly large part of the CPI; including rent, they accounted for about a third of the index. It was observed at the time that the price movements of services seemed different from that of commodities (i.e., goods):33
The steady rise in prices which has characterized the service group for so long a time is in striking contrast to the major fluctuations in the upward price movement of commodities….[T]he relatively steady upward movement of service prices since 1940, and their apparent strong resistance to price declines reflects the continued increase in real wages and consumer income over the war and postwar years, and the ever-increasing demand for services that accompanied this improved economic position of consumers.
Notably, the importance of services in the CPI has continued to grow since 1950 (services made up slightly more than 60 percent of the index in 2013), and the pricing behavior of services has continued to rise moderately but steadily, showing much less volatility than commodity prices.
The deflation of the late 1940s proved short lived. The economy showed signs of turning around in late 1949, and prices followed in early 1950. By mid-1950, the Korean conflict returned the economy to a semblance of a wartime status. Demand surged as consumers, mindful of World War II shortages, bought while they still could. Food prices rose nearly 10 percent over the last 8 months of 1950, and the housefurnishings index rose at a similar rate. These increases led yet again to price controls: after voluntary measures proved unsatisfactory, the Office of Price Stabilization was created and compulsory controls returned. The General Ceiling Price Regulation went into effect in early 1951, affecting primarily food and durable goods. Constrained by these controls, inflation was relatively modest through most of 1951, with the All-Items CPI increasing about 3 percent over the last 11 months of that year.
In retrospect, the early 1950s mark a turning point in the American inflation experience. The decades leading up to the Korean war 34 era featured alternating periods of sharp inflation and genuine deflation, with the former generating active efforts to control prices and the latter generating fears of recession and, sometimes, active efforts to raise prices. Although severe inflation and even price controls would return, the post–Korean war era would look different from the 1941–1951 period, with less volatility and a near absence of deflation.
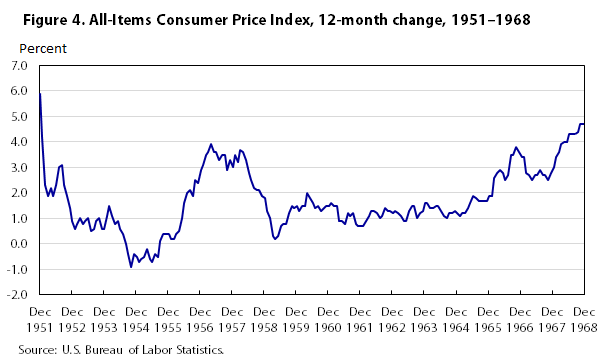
Largest 12-month increase (from 1952 onward): 12-month periods ending October, November, and December 1968, 4.7 percent each
Largest 12-month decrease: October 1953–October 1954, 0.9 percent
Annualized increase of selected major components and aggregates, 1951–1968:
Prices of selected food items, 1955:35
Average prices of selected nonfood items, December 1955 (arithmetic average of prices in selected large cities):36
| Month and year | Percent change |
|---|---|
Dec 1951 | 5.9 |
Jan 1952 | 4.2 |
Feb 1952 | 2.3 |
Mar 1952 | 1.9 |
Apr 1952 | 2.2 |
May 1952 | 1.9 |
Jun 1952 | 2.3 |
Jul 1952 | 3.0 |
Aug 1952 | 3.1 |
Sep 1952 | 2.3 |
Oct 1952 | 1.9 |
Nov 1952 | 1.4 |
Dec 1952 | .9 |
Jan 1953 | .6 |
Feb 1953 | .8 |
Mar 1953 | 1.0 |
Apr 1953 | .8 |
May 1953 | .9 |
Jun 1953 | 1.0 |
Jul 1953 | .5 |
Aug 1953 | .6 |
Sep 1953 | .9 |
Oct 1953 | 1.0 |
Nov 1953 | .6 |
Dec 1953 | .6 |
Jan 1954 | 1.1 |
Feb 1954 | 1.5 |
Mar 1954 | 1.1 |
Apr 1954 | .8 |
May 1954 | .9 |
Jun 1954 | .6 |
Jul 1954 | .4 |
Aug 1954 | .0 |
Sep 1954 | -.4 |
Oct 1954 | -.9 |
Nov 1954 | -.4 |
Dec 1954 | -.5 |
Jan 1955 | -.7 |
Feb 1955 | -.6 |
Mar 1955 | -.5 |
Apr 1955 | -.2 |
May 1955 | -.6 |
Jun 1955 | -.7 |
Jul 1955 | -.4 |
Aug 1955 | -.5 |
Sep 1955 | .1 |
Oct 1955 | .4 |
Nov 1955 | .4 |
Dec 1955 | .4 |
Jan 1956 | .2 |
Feb 1956 | .2 |
Mar 1956 | .4 |
Apr 1956 | .5 |
May 1956 | 1.0 |
Jun 1956 | 1.6 |
Jul 1956 | 2.0 |
Aug 1956 | 2.1 |
Sep 1956 | 1.9 |
Oct 1956 | 2.5 |
Nov 1956 | 2.4 |
Dec 1956 | 2.9 |
Jan 1957 | 3.1 |
Feb 1957 | 3.5 |
Mar 1957 | 3.6 |
Apr 1957 | 3.9 |
May 1957 | 3.6 |
Jun 1957 | 3.6 |
Jul 1957 | 3.3 |
Aug 1957 | 3.5 |
Sep 1957 | 3.5 |
Oct 1957 | 2.9 |
Nov 1957 | 3.3 |
Dec 1957 | 3.0 |
Jan 1958 | 3.5 |
Feb 1958 | 3.2 |
Mar 1958 | 3.7 |
Apr 1958 | 3.6 |
May 1958 | 3.3 |
Jun 1958 | 2.8 |
Jul 1958 | 2.5 |
Aug 1958 | 2.2 |
Sep 1958 | 2.1 |
Oct 1958 | 2.1 |
Nov 1958 | 1.9 |
Dec 1958 | 1.8 |
Jan 1959 | 1.3 |
Feb 1959 | 1.0 |
Mar 1959 | .3 |
Apr 1959 | .2 |
May 1959 | .3 |
Jun 1959 | .7 |
Jul 1959 | .8 |
Aug 1959 | .8 |
Sep 1959 | 1.2 |
Oct 1959 | 1.5 |
Nov 1959 | 1.4 |
Dec 1959 | 1.5 |
Jan 1960 | 1.3 |
Feb 1960 | 1.5 |
Mar 1960 | 1.5 |
Apr 1960 | 2.0 |
May 1960 | 1.8 |
Jun 1960 | 1.6 |
Jul 1960 | 1.4 |
Aug 1960 | 1.5 |
Sep 1960 | 1.3 |
Oct 1960 | 1.4 |
Nov 1960 | 1.5 |
Dec 1960 | 1.5 |
Jan 1961 | 1.6 |
Feb 1961 | 1.5 |
Mar 1961 | 1.5 |
Apr 1961 | .9 |
May 1961 | .9 |
Jun 1961 | .8 |
Jul 1961 | 1.2 |
Aug 1961 | 1.1 |
Sep 1961 | 1.2 |
Oct 1961 | .8 |
Nov 1961 | .7 |
Dec 1961 | .7 |
Jan 1962 | .7 |
Feb 1962 | .9 |
Mar 1962 | 1.1 |
Apr 1962 | 1.3 |
May 1962 | 1.3 |
Jun 1962 | 1.2 |
Jul 1962 | 1.0 |
Aug 1962 | 1.1 |
Sep 1962 | 1.4 |
Oct 1962 | 1.3 |
Nov 1962 | 1.3 |
Dec 1962 | 1.2 |
Jan 1963 | 1.3 |
Feb 1963 | 1.2 |
Mar 1963 | 1.1 |
Apr 1963 | .9 |
May 1963 | .9 |
Jun 1963 | 1.3 |
Jul 1963 | 1.5 |
Aug 1963 | 1.5 |
Sep 1963 | 1.0 |
Oct 1963 | 1.2 |
Nov 1963 | 1.3 |
Dec 1963 | 1.6 |
Jan 1964 | 1.6 |
Feb 1964 | 1.4 |
Mar 1964 | 1.4 |
Apr 1964 | 1.5 |
May 1964 | 1.5 |
Jun 1964 | 1.3 |
Jul 1964 | 1.1 |
Aug 1964 | 1.0 |
Sep 1964 | 1.2 |
Oct 1964 | 1.2 |
Nov 1964 | 1.3 |
Dec 1964 | 1.2 |
Jan 1965 | 1.1 |
Feb 1965 | 1.2 |
Mar 1965 | 1.2 |
Apr 1965 | 1.4 |
May 1965 | 1.6 |
Jun 1965 | 1.9 |
Jul 1965 | 1.8 |
Aug 1965 | 1.7 |
Sep 1965 | 1.7 |
Oct 1965 | 1.7 |
Nov 1965 | 1.7 |
Dec 1965 | 1.9 |
Jan 1966 | 1.9 |
Feb 1966 | 2.6 |
Mar 1966 | 2.8 |
Apr 1966 | 2.9 |
May 1966 | 2.8 |
Jun 1966 | 2.5 |
Jul 1966 | 2.7 |
Aug 1966 | 3.5 |
Sep 1966 | 3.5 |
Oct 1966 | 3.8 |
Nov 1966 | 3.6 |
Dec 1966 | 3.4 |
Jan 1967 | 3.4 |
Feb 1967 | 2.8 |
Mar 1967 | 2.7 |
Apr 1967 | 2.5 |
May 1967 | 2.7 |
Jun 1967 | 2.7 |
Jul 1967 | 2.9 |
Aug 1967 | 2.7 |
Sep 1967 | 2.7 |
Oct 1967 | 2.5 |
Nov 1967 | 2.8 |
Dec 1967 | 3.0 |
Jan 1968 | 3.4 |
Feb 1968 | 3.6 |
Mar 1968 | 3.9 |
Apr 1968 | 4.0 |
May 1968 | 4.0 |
Jun 1968 | 4.3 |
Jul 1968 | 4.3 |
Aug 1968 | 4.3 |
Sep 1968 | 4.4 |
Oct 1968 | 4.7 |
Nov 1968 | 4.7 |
Dec 1968 | 4.7 |
Source: U.S. Bureau of Labor Statistics. | |
The early 1950s mark the beginning of what could be called the modern era of inflation in the United States, with price changes that were nearly always positive, but usually relatively modest (see figure 4), at least in comparison to the peaks reached during each of the two World Wars. It is this experience that informs most American perceptions and expectations about inflation today.
As the decade of the 1950s opened, the market basket of the American consumer was beginning to resemble the modern one. Food expenditures became less dominant and durable goods increased in importance. This change reflected the postwar surge in demand for durable goods, as cars and televisions gained a foothold in American life. Food, which was about 40 percent of the market basket at the end of the 1940s, was less than 30 percent at the end of the 1950s and dropped to 22.7 percent by 1967. (By comparison, the percentage was about 14 percent in 2012.) New and used cars accounted for about 5 percent of the market basket in the 1950s, a percentage similar to current ones. The following tabulation shows the relative importance (i.e., the percentages) of selected items making up the market basket in December 1957:
| Group | Relative importance, percent |
| All items | 100.0 |
| Food | 28.6 |
| Housing | 32.9 |
| Shelter | 18.2 |
| Housefurnishings | 5.9 |
| Apparel | 9.0 |
| Transportation | 11.5 |
| New automobiles | 3.0 |
| Used automobiles | 1.6 |
| Energy | 5.8 |
| Gasoline | 2.4 |
The less-food-centered market basket is reflected in attitudes toward, and coverage of, price change over the period. Food prices were less dominant in the news, and price trends that persist today could be seen by the 1950s and 1960s. During that time, price change in services exceeded that of commodities and the rate of medical care inflation exceeded the overall rate; both of these trends have generally held true since.
The popular image of the 1950s is that the period was a time of stability and quiescence, and this perception seems valid enough when it comes to price change. In contrast to the experience after World War II, the end of Korean war–era price controls clearly did not unleash suppressed inflation: by 1953, the controls had lapsed but prices increased less than 1 percent during the year. From October 1952 through June 1956, the 12-month change in the All-items CPI remained below 2 percent. The early to mid–1950s are probably as close as the United States has come to price stability.
A mild recession lasted from late 1953 through much of 1954, with unemployment exceeding 6 percent in January 1954. It has been posited that President Eisenhower tolerated the recession in order to reduce postwar inflation.37 If so, the tactic appears to have been effective: prices increased only slightly in 1953 and declined in 1954, with the 12-month change in the All-Items CPI remaining negative into 1955. (It would not be negative again until 2009.) From July 1952 to April 1956, the All-Items CPI rose at a paltry 0.2-percent annualized rate.
Inflation reemerged, at least to a modest degree, in the spring of 1956, with the All-Items CPI rising 3.6 percent from April 1956 to April 1957. Another recession arrived, however, and by the spring of 1958 the growth in the price level slowed back to a crawl.
Food prices exhibited even sharper trends than the overall CPI did. The food index peaked in August 1952 and declined slowly, but fairly steadily, until March 1956. Food prices recovered after that and helped drive the increase in the All-Items CPI. The food index stood at about the same level in 1957 as it was in 1952. Food prices accelerated in 1957 and early 1958, with the 12-month change reaching a peak of 7.0 percent in April 1958. Prices then leveled off and turned downward later in the year.
As an aside, in current times consumers often note that the size of items they purchase frequently decreases, and they wonder if the shrinkage masks a price change. This perception, however, is apparently not a new issue: a contemporaneous BLS bulletin notes a 14.3-percent increase in chocolate bar prices, explaining that prices “for this item were relatively stable…but a general reduction on the size of bars resulted in a sharp increase in prices from April through June [of 1958].”38 Then, as now, BLS noted and adjusted for changes in the size of products.
One might imagine that the relative price stability of the 1950s meant that inflation had receded from public attention and was not at the forefront of politics. However, perhaps because postwar inflationary periods still loomed so large in people’s minds, inflation continued to generate fear and was a dominant issue in the U.S. political debate. “The threat of inflation looms again as a darkening shadow upon the horizon of the American economy,” proclaims an August 1956 editorial.39 A week later, a headline booms: “Threat of inflation shadows the economy.” The article goes on to explain, “Your dollar is looking slightly ill again. It’s losing some of its purchasing power, that is. Prices are on the rise…inflation is rearing its head.”40 Inflation at the time was around 2 percent.
Policymakers also seemed focused on inflation even as it existed only as a future possibility. In August 1959, with the All-Items CPI less than 1 percent, a New York Times article asserted, “Ever since the present session of Congress began, President Eisenhower’s overriding interest on the domestic front has been inflation and the means of dealing with it.” The same article proclaims that “A powerful school of opinion…has decided that it’s imperative that postwar inflation in the United States be stopped convincingly and once and for all.”41
The feared postwar inflation might not have been stopped for good, but it was held off for several years. Price change remained consistently modest through the end of the 1950s and into the mid-1960s. Indeed, the era is most notable for its lack of volatility. From November 1958 through January 1966, the 12-month change in the All-Items CPI stayed positive, but low, remaining in the range from 0.7 percent to 2.0 percent throughout the period. Food and energy, the traditional sources of volatility in the CPI, were unusually stable. From 1959 through 1965, the 12-month change in the food index never reached even 4 percent and the energy index (first published by the Bureau in 1957) never reached 5 percent. In fact, the 12-month energy increase exceeded 3 percent only for a single 3-month period (November 1959–January 1960).
And yet, the public and its leaders still were vexed. A 1964 New York Times piece discussing President Johnson’s appeals to business and labor to keep wages and prices from rising summarizes the existing state of affairs:42
The constant discussion of inflation in the United States is reminiscent of the family that calls off the picnic when the sun is shining because something in their bones tells them it’s going to rain. There is no inflation in this country and has not been for six years—certainly none to speak of by measure of the price indexes. While some prices have gone up others have gone down. Yet Americans are so used to associating good business with rising prices that they cannot believe the strengthening of the boom forecast for this year could possibly take place without a revival of inflation.
Perhaps the public’s worries were justified, however, as the much feared inflation did indeed finally arrive, albeit gradually, and it would be decades before sustained modest price change returned. Food prices started accelerating early at the end of 1965, and shelter costs followed in 1966. By October 1966, the 12-month change in the All-Items CPI reached 3.8 percent, its highest level since 1957. After decelerating briefly in 1967 as food prices receded for a short time, the index surged again in 1968, hitting 4.7 percent in October of that year. Interestingly, the inflation of the late 1960s was not at all fueled by energy prices. The tabulation that follows shows the annualized change for selected CPI components for the two periods December 1957–December 1965 and December 1965–December 1968; note that the energy index was modest and not especially volatile throughout the period:
| Group | Subperiod, annualized percent change | |
| December 1957–December 1965 | December 1965–December 1968 | |
| All items | 1.4 | 3.7 |
| Food | 1.5 | 3.2 |
| Energy | .8 | 1.7 |
| All items less food and energy | 1.5 | 4.1 |
| Shelter | 1.5 | 4.4 |
Why the return of inflation when it seemed to be guarded against and feared? One possibility is a change in the perspective of policymakers. Some have argued that inflation was tempered in the 1950s by a Federal Reserve that, believing that inflation would reduce unemployment in the short term but increase it in the long term, was willing to contract the economy to prevent inflation from growing. By the 1960s, however, the notion of the Phillips curve, a straightforward tradeoff between inflation and unemployment, ruled the day. Citing the curve, policymakers believed that unemployment could be permanently reduced by accepting higher inflation. This view led to expansionary monetary and fiscal policies that in turn led to booming growth, but also inflationary pressures.43 However much policymakers professed to fear inflation, the policies they pursued seemed to reflect other priorities. The federal government ran deficits throughout the 1960s, with steadily increasing deficits starting in 1966. Military spending increased with the Vietnam War, domestic spending increased, and taxes were cut.44 The inflation of the late 1960s might be seen as a classic case of demand outstripping capacity in a highly stimulated economy.
In any case, by 1968 serious inflation had returned, likely a symptom of a booming economy. The years ahead, however, would prove that serious inflation need not be accompanied by a boom.
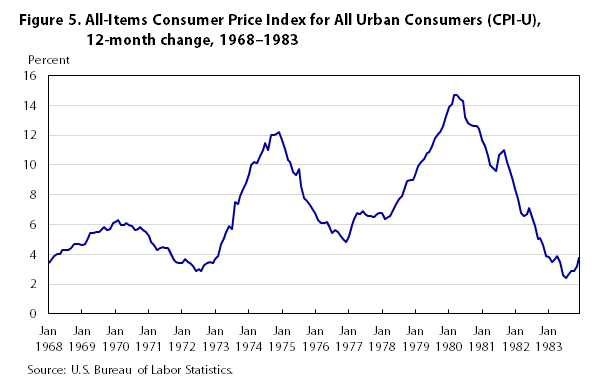
Largest 12-month increase: March 1979–March 1980, 14.8 percent
Smallest 12-month increase: July 1982–July 1983, 2.4 percent
Annualized increases in selected major components and aggregates, 1968-1983:
Prices of selected food items, 1975:
| Month and year | Percent change |
|---|---|
Jan 1968 | 3.4 |
Feb 1968 | 3.6 |
Mar 1968 | 3.9 |
Apr 1968 | 4.0 |
May 1968 | 4.0 |
Jun 1968 | 4.3 |
Jul 1968 | 4.3 |
Aug 1968 | 4.3 |
Sep 1968 | 4.4 |
Oct 1968 | 4.7 |
Nov 1968 | 4.7 |
Dec 1968 | 4.7 |
Jan 1969 | 4.6 |
Feb 1969 | 4.7 |
Mar 1969 | 5.1 |
Apr 1969 | 5.4 |
May 1969 | 5.4 |
Jun 1969 | 5.5 |
Jul 1969 | 5.5 |
Aug 1969 | 5.6 |
Sep 1969 | 5.8 |
Oct 1969 | 5.6 |
Nov 1969 | 5.7 |
Dec 1969 | 6.1 |
Jan 1970 | 6.2 |
Feb 1970 | 6.3 |
Mar 1970 | 6.0 |
Apr 1970 | 6.0 |
May 1970 | 6.1 |
Jun 1970 | 6.0 |
Jul 1970 | 5.9 |
Aug 1970 | 5.6 |
Sep 1970 | 5.7 |
Oct 1970 | 5.8 |
Nov 1970 | 5.6 |
Dec 1970 | 5.5 |
Jan 1971 | 5.2 |
Feb 1971 | 4.8 |
Mar 1971 | 4.6 |
Apr 1971 | 4.3 |
May 1971 | 4.4 |
Jun 1971 | 4.5 |
Jul 1971 | 4.4 |
Aug 1971 | 4.4 |
Sep 1971 | 4.0 |
Oct 1971 | 3.6 |
Nov 1971 | 3.5 |
Dec 1971 | 3.4 |
Jan 1972 | 3.4 |
Feb 1972 | 3.7 |
Mar 1972 | 3.5 |
Apr 1972 | 3.4 |
May 1972 | 3.2 |
Jun 1972 | 2.9 |
Jul 1972 | 3.0 |
Aug 1972 | 2.9 |
Sep 1972 | 3.3 |
Oct 1972 | 3.4 |
Nov 1972 | 3.5 |
Dec 1972 | 3.4 |
Jan 1973 | 3.7 |
Feb 1973 | 3.9 |
Mar 1973 | 4.7 |
Apr 1973 | 5.1 |
May 1973 | 5.5 |
Jun 1973 | 5.9 |
Jul 1973 | 5.7 |
Aug 1973 | 7.5 |
Sep 1973 | 7.4 |
Oct 1973 | 7.9 |
Nov 1973 | 8.4 |
Dec 1973 | 8.8 |
Jan 1974 | 9.4 |
Feb 1974 | 10.0 |
Mar 1974 | 10.2 |
Apr 1974 | 10.1 |
May 1974 | 10.6 |
Jun 1974 | 11.0 |
Jul 1974 | 11.5 |
Aug 1974 | 11.0 |
Sep 1974 | 12.0 |
Oct 1974 | 12.0 |
Nov 1974 | 12.1 |
Dec 1974 | 12.2 |
Jan 1975 | 11.7 |
Feb 1975 | 11.1 |
Mar 1975 | 10.3 |
Apr 1975 | 10.2 |
May 1975 | 9.5 |
Jun 1975 | 9.3 |
Jul 1975 | 9.7 |
Aug 1975 | 8.6 |
Sep 1975 | 7.8 |
Oct 1975 | 7.6 |
Nov 1975 | 7.3 |
Dec 1975 | 7.0 |
Jan 1976 | 6.8 |
Feb 1976 | 6.3 |
Mar 1976 | 6.1 |
Apr 1976 | 6.1 |
May 1976 | 6.2 |
Jun 1976 | 5.9 |
Jul 1976 | 5.4 |
Aug 1976 | 5.6 |
Sep 1976 | 5.5 |
Oct 1976 | 5.3 |
Nov 1976 | 5.0 |
Dec 1976 | 4.8 |
Jan 1977 | 5.2 |
Feb 1977 | 6.0 |
Mar 1977 | 6.4 |
Apr 1977 | 6.8 |
May 1977 | 6.7 |
Jun 1977 | 6.9 |
Jul 1977 | 6.7 |
Aug 1977 | 6.6 |
Sep 1977 | 6.6 |
Oct 1977 | 6.5 |
Nov 1977 | 6.7 |
Dec 1977 | 6.8 |
Jan 1978 | 6.8 |
Feb 1978 | 6.4 |
Mar 1978 | 6.5 |
Apr 1978 | 6.6 |
May 1978 | 7.0 |
Jun 1978 | 7.4 |
Jul 1978 | 7.7 |
Aug 1978 | 7.9 |
Sep 1978 | 8.3 |
Oct 1978 | 8.9 |
Nov 1978 | 9.0 |
Dec 1978 | 9.0 |
Jan 1979 | 9.3 |
Feb 1979 | 9.9 |
Mar 1979 | 10.2 |
Apr 1979 | 10.4 |
May 1979 | 10.8 |
Jun 1979 | 10.9 |
Jul 1979 | 11.3 |
Aug 1979 | 11.8 |
Sep 1979 | 12.1 |
Oct 1979 | 12.2 |
Nov 1979 | 12.6 |
Dec 1979 | 13.3 |
Jan 1980 | 13.9 |
Feb 1980 | 14.1 |
Mar 1980 | 14.7 |
Apr 1980 | 14.7 |
May 1980 | 14.4 |
Jun 1980 | 14.3 |
Jul 1980 | 13.2 |
Aug 1980 | 12.8 |
Sep 1980 | 12.7 |
Oct 1980 | 12.6 |
Nov 1980 | 12.6 |
Dec 1980 | 12.4 |
Jan 1981 | 11.7 |
Feb 1981 | 11.3 |
Mar 1981 | 10.6 |
Apr 1981 | 10.0 |
May 1981 | 9.8 |
Jun 1981 | 9.6 |
Jul 1981 | 10.7 |
Aug 1981 | 10.9 |
Sep 1981 | 11.0 |
Oct 1981 | 10.2 |
Nov 1981 | 9.6 |
Dec 1981 | 8.9 |
Jan 1982 | 8.4 |
Feb 1982 | 7.7 |
Mar 1982 | 6.8 |
Apr 1982 | 6.6 |
May 1982 | 6.7 |
Jun 1982 | 7.1 |
Jul 1982 | 6.5 |
Aug 1982 | 5.9 |
Sep 1982 | 5.0 |
Oct 1982 | 5.1 |
Nov 1982 | 4.6 |
Dec 1982 | 3.9 |
Jan 1983 | 3.8 |
Feb 1983 | 3.5 |
Mar 1983 | 3.6 |
Apr 1983 | 3.9 |
May 1983 | 3.5 |
Jun 1983 | 2.6 |
Jul 1983 | 2.4 |
Aug 1983 | 2.6 |
Sep 1983 | 2.9 |
Oct 1983 | 2.9 |
Nov 1983 | 3.2 |
Dec 1983 | 3.8 |
Source: U.S. Bureau of Labor Statistics. | |
As can be seen from the path of the change in the All-Items CPI, shown in figure 5, the period from 1968 to 1983 stands out as the definitive era of sustained inflation in the 20th-century United States. The period spanned the boom-time inflation of the late 1960s, the frustrating stagflation of much of the 1970s, and the double-digit inflation of the early 1980s. More than ever before, inflation was the most pressing economic concern of the public and policymakers, and it proved to be an issue that dominated elections.
By this period, the composition of the American market basket, and thus the composition of the market basket used to calculate the CPI, had become much closer to that of the current era. The relative importance of food in the index continued to decline: in 1968 it was over 22 percent, while by the early 1980s it was under 20 percent. Notably, in 1978 the CPI published a new measure, the Consumer Price Index for All Urban Consumers (CPI-U), based on the spending patterns of a broader subset of the population.
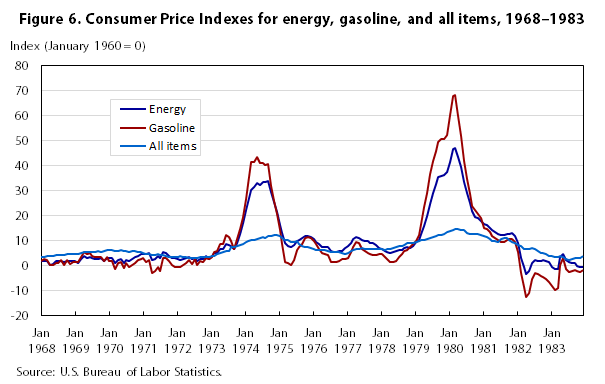
Moreover, many of the broad trends in relative price movements that are still in place today came into focus during the 1968–1983 period. Short-term movements in the index often were driven by energy, especially gasoline. Shelter and medical care price changes usually ran above overall inflation, while apparel price changes ran consistently below. Inflation for services outstripped inflation for commodities.
Inflation was accelerating in 1968, but was still below 5 percent. The inflation of the late 1960s seems relatively innocuous in hindsight, especially given what would follow in the 1970s and early 1980s. However, after nearly two decades of relative price stability (the All-Items CPI hadn’t been above 5 percent since 1951), rising prices were vexing to policymakers at the time and engendered an active response. It was the inflation of a booming economy. In 1969 high levels of business investment were pushing prices up, and policymakers responded by focusing on slowing the economy down; the Nixon administration sought, it said, to stop inflation without causing a recession.
Prices rose 6.1 percent in 1969 and 5.5 percent in 1970. By mid-1971, the growth in the All-Items CPI was less than 5 percent. However, the slowing of inflation was due at least partly to a recession, and the public was dissatisfied with inflation and with the economic situation as a whole. In this frustrating climate, President Nixon undertook dramatic steps. He issued an executive order taking the United States off the gold standard and instituted a freeze on wages and prices—price controls yet again, as had occurred during World War I, the 1930s, World War II, and the Korean war. Reflecting the public’s frustration, the policies were popular, at least at first. Inflation continued to moderate, with the All-Items CPI rising 3.4 percent in both 1971 and 1972. Following several phases of varying strictness, wage and price controls lapsed in 1973, after Nixon was reelected.
As frustrating as the inflation of 1968–1972 might have been, it was only a prelude to the difficult era that followed. In 1973 and 1974, surging energy prices propelled inflation and made a mockery of the notion that there was a simple tradeoff between higher inflation and lower unemployment. The inflation of 1968–1972 does not appear to have been energy driven: energy inflation generally lagged behind overall inflation until 1973. However, by late 1973, surging energy prices amid an oil crisis, and perhaps suppressed inflation from the price control period, ushered in a new era in American inflation. The CPI for energy rose by a third from mid-1973 to mid-1974, and the All-items CPI soared with it: the 12-month change in the all-items index reached 12 percent by September of 1974. The economy plunged into recession during this period, a more severe recession than the one that had taken hold in 1970. Output declined through 1974 and unemployment reached 9 percent by mid-1975.
| Month and year | Index | ||
|---|---|---|---|
| Energy | Gasoline | All items | |
Jan 1968 | 1.7 | 1.9 | 3.4 |
Feb 1968 | 1.7 | 2.7 | 3.6 |
Mar 1968 | 1.7 | 2.3 | 3.9 |
Apr 1968 | .4 | .4 | 4.0 |
May 1968 | .8 | .4 | 4.0 |
Jun 1968 | 1.7 | 1.1 | 4.3 |
Jul 1968 | 1.7 | 1.1 | 4.3 |
Aug 1968 | 1.7 | 2.3 | 4.3 |
Sep 1968 | 1.3 | .4 | 4.4 |
Oct 1968 | 1.7 | 2.3 | 4.7 |
Nov 1968 | 1.7 | .7 | 4.7 |
Dec 1968 | 1.7 | 1.5 | 4.7 |
Jan 1969 | 1.7 | 1.5 | 4.6 |
Feb 1969 | 1.2 | 1.5 | 4.7 |
Mar 1969 | 2.5 | 3.4 | 5.1 |
Apr 1969 | 3.8 | 5.3 | 5.4 |
May 1969 | 2.9 | 4.5 | 5.4 |
Jun 1969 | 3.3 | 4.9 | 5.5 |
Jul 1969 | 2.9 | 3.7 | 5.5 |
Aug 1969 | 2.5 | 3.3 | 5.6 |
Sep 1969 | 2.5 | 3.3 | 5.8 |
Oct 1969 | 2.9 | 3.3 | 5.6 |
Nov 1969 | 2.0 | 1.9 | 5.7 |
Dec 1969 | 2.9 | 3.4 | 6.1 |
Jan 1970 | 2.9 | 1.8 | 6.2 |
Feb 1970 | 2.9 | 1.8 | 6.3 |
Mar 1970 | 1.2 | -1.4 | 6.0 |
Apr 1970 | 2.4 | 1.1 | 6.0 |
May 1970 | 2.8 | 1.4 | 6.1 |
Jun 1970 | 1.2 | -1.1 | 6.0 |
Jul 1970 | 2.4 | 1.1 | 5.9 |
Aug 1970 | 2.0 | -.7 | 5.6 |
Sep 1970 | 2.8 | .4 | 5.7 |
Oct 1970 | 3.6 | 1.1 | 5.8 |
Nov 1970 | 4.0 | 2.2 | 5.6 |
Dec 1970 | 4.8 | 2.5 | 5.5 |
Jan 1971 | 4.8 | 2.9 | 5.2 |
Feb 1971 | 4.8 | 1.4 | 4.8 |
Mar 1971 | 5.2 | 2.2 | 4.6 |
Apr 1971 | 2.4 | -2.8 | 4.3 |
May 1971 | 2.7 | -2.1 | 4.4 |
Jun 1971 | 4.0 | -.4 | 4.5 |
Jul 1971 | 3.1 | -2.1 | 4.4 |
Aug 1971 | 5.5 | 2.9 | 4.4 |
Sep 1971 | 5.1 | 2.9 | 4.0 |
Oct 1971 | 3.9 | 1.8 | 3.6 |
Nov 1971 | 3.1 | .4 | 3.5 |
Dec 1971 | 3.1 | -.4 | 3.4 |
Jan 1972 | 2.7 | -.7 | 3.4 |
Feb 1972 | 2.3 | -.4 | 3.7 |
Mar 1972 | 2.7 | .4 | 3.5 |
Apr 1972 | 3.1 | 1.1 | 3.4 |
May 1972 | 3.4 | 2.2 | 3.2 |
Jun 1972 | 2.7 | .7 | 2.9 |
Jul 1972 | 3.0 | 2.5 | 3.0 |
Aug 1972 | 1.9 | .4 | 2.9 |
Sep 1972 | 2.6 | 1.7 | 3.3 |
Oct 1972 | 2.6 | 1.4 | 3.4 |
Nov 1972 | 3.7 | 3.2 | 3.5 |
Dec 1972 | 2.6 | 2.8 | 3.4 |
Jan 1973 | 3.7 | 3.5 | 3.7 |
Feb 1973 | 5.2 | 5.4 | 3.9 |
Mar 1973 | 5.2 | 5.7 | 4.7 |
Apr 1973 | 6.7 | 8.7 | 5.1 |
May 1973 | 6.6 | 8.5 | 5.5 |
Jun 1973 | 8.5 | 12.2 | 5.9 |
Jul 1973 | 8.1 | 11.3 | 5.7 |
Aug 1973 | 7.7 | 9.8 | 7.5 |
Sep 1973 | 6.5 | 6.5 | 7.4 |
Oct 1973 | 9.1 | 10.7 | 7.9 |
Nov 1973 | 12.6 | 14.8 | 8.4 |
Dec 1973 | 17.0 | 19.6 | 8.8 |
Jan 1974 | 22.1 | 26.7 | 9.4 |
Feb 1974 | 25.4 | 32.7 | 10.0 |
Mar 1974 | 30.3 | 41.6 | 10.2 |
Apr 1974 | 31.4 | 41.5 | 10.1 |
May 1974 | 32.9 | 43.3 | 10.6 |
Jun 1974 | 32.1 | 40.9 | 11.0 |
Jul 1974 | 33.4 | 41.1 | 11.5 |
Aug 1974 | 33.3 | 40.1 | 11.0 |
Sep 1974 | 33.7 | 40.5 | 12.0 |
Oct 1974 | 29.6 | 32.0 | 12.0 |
Nov 1974 | 25.3 | 25.7 | 12.1 |
Dec 1974 | 21.6 | 20.7 | 12.2 |
Jan 1975 | 16.4 | 14.3 | 11.7 |
Feb 1975 | 13.2 | 8.7 | 11.1 |
Mar 1975 | 8.9 | 1.4 | 10.3 |
Apr 1975 | 8.0 | .9 | 10.2 |
May 1975 | 7.3 | .2 | 9.5 |
Jun 1975 | 8.3 | 2.3 | 9.3 |
Jul 1975 | 9.7 | 6.1 | 9.7 |
Aug 1975 | 10.2 | 7.5 | 8.6 |
Sep 1975 | 10.9 | 8.5 | 7.8 |
Oct 1975 | 11.8 | 11.1 | 7.6 |
Nov 1975 | 12.0 | 11.4 | 7.3 |
Dec 1975 | 11.4 | 11.0 | 7.0 |
Jan 1976 | 10.6 | 9.9 | 6.8 |
Feb 1976 | 9.5 | 8.5 | 6.3 |
Mar 1976 | 8.7 | 6.8 | 6.1 |
Apr 1976 | 7.6 | 5.1 | 6.1 |
May 1976 | 7.5 | 4.8 | 6.2 |
Jun 1976 | 7.4 | 4.4 | 5.9 |
Jul 1976 | 5.8 | 1.5 | 5.4 |
Aug 1976 | 5.6 | 1.5 | 5.6 |
Sep 1976 | 5.3 | 1.5 | 5.5 |
Oct 1976 | 5.7 | 1.9 | 5.3 |
Nov 1976 | 5.9 | 2.6 | 5.0 |
Dec 1976 | 7.1 | 2.8 | 4.8 |
Jan 1977 | 7.7 | 3.0 | 5.2 |
Feb 1977 | 9.1 | 5.4 | 6.0 |
Mar 1977 | 10.7 | 7.5 | 6.4 |
Apr 1977 | 11.6 | 9.3 | 6.8 |
May 1977 | 11.1 | 8.9 | 6.7 |
Jun 1977 | 10.2 | 6.8 | 6.9 |
Jul 1977 | 9.9 | 5.7 | 6.7 |
Aug 1977 | 9.9 | 5.0 | 6.6 |
Sep 1977 | 9.2 | 4.6 | 6.6 |
Oct 1977 | 9.1 | 4.4 | 6.5 |
Nov 1977 | 8.4 | 4.4 | 6.7 |
Dec 1977 | 7.2 | 4.8 | 6.8 |
Jan 1978 | 6.5 | 4.8 | 6.8 |
Feb 1978 | 5.8 | 3.3 | 6.4 |
Mar 1978 | 5.4 | 2.5 | 6.5 |
Apr 1978 | 5.1 | 1.6 | 6.6 |
May 1978 | 5.5 | 1.4 | 7.0 |
Jun 1978 | 6.0 | 2.0 | 7.4 |
Jul 1978 | 6.2 | 3.4 | 7.7 |
Aug 1978 | 6.4 | 4.8 | 7.9 |
Sep 1978 | 7.0 | 5.8 | 8.3 |
Oct 1978 | 7.4 | 6.2 | 8.9 |
Nov 1978 | 7.0 | 7.4 | 9.0 |
Dec 1978 | 7.9 | 8.6 | 9.0 |
Jan 1979 | 9.3 | 10.0 | 9.3 |
Feb 1979 | 10.2 | 12.4 | 9.9 |
Mar 1979 | 12.5 | 16.6 | 10.2 |
Apr 1979 | 16.0 | 23.5 | 10.4 |
May 1979 | 19.7 | 29.0 | 10.8 |
Jun 1979 | 24.7 | 36.5 | 10.9 |
Jul 1979 | 29.1 | 42.0 | 11.3 |
Aug 1979 | 32.5 | 46.0 | 11.8 |
Sep 1979 | 35.3 | 49.4 | 12.1 |
Oct 1979 | 35.7 | 50.5 | 12.2 |
Nov 1979 | 36.2 | 50.7 | 12.6 |
Dec 1979 | 37.5 | 52.1 | 13.3 |
Jan 1980 | 41.5 | 60.1 | 13.9 |
Feb 1980 | 46.6 | 67.9 | 14.1 |
Mar 1980 | 47.1 | 68.1 | 14.7 |
Apr 1980 | 43.5 | 59.7 | 14.7 |
May 1980 | 39.3 | 51.7 | 14.4 |
Jun 1980 | 33.5 | 42.0 | 14.3 |
Jul 1980 | 29.1 | 34.5 | 13.2 |
Aug 1980 | 25.1 | 28.8 | 12.8 |
Sep 1980 | 21.7 | 23.9 | 12.7 |
Oct 1980 | 19.6 | 22.1 | 12.6 |
Nov 1980 | 19.0 | 20.7 | 12.6 |
Dec 1980 | 18.0 | 18.9 | 12.4 |
Jan 1981 | 16.5 | 15.0 | 11.7 |
Feb 1981 | 16.4 | 14.8 | 11.3 |
Mar 1981 | 15.2 | 13.4 | 10.6 |
Apr 1981 | 14.3 | 11.9 | 10.0 |
May 1981 | 13.3 | 10.9 | 9.8 |
Jun 1981 | 12.7 | 10.2 | 9.6 |
Jul 1981 | 12.2 | 9.6 | 10.7 |
Aug 1981 | 12.3 | 9.5 | 10.9 |
Sep 1981 | 12.7 | 10.3 | 11.0 |
Oct 1981 | 12.8 | 10.6 | 10.2 |
Nov 1981 | 13.2 | 10.5 | 9.6 |
Dec 1981 | 11.9 | 9.4 | 8.9 |
Jan 1982 | 9.0 | 5.4 | 8.4 |
Feb 1982 | 2.9 | -2.9 | 7.7 |
Mar 1982 | -.7 | -8.7 | 6.8 |
Apr 1982 | -3.5 | -12.5 | 6.6 |
May 1982 | -2.2 | -11.1 | 6.7 |
Jun 1982 | 1.0 | -5.4 | 7.1 |
Jul 1982 | 2.1 | -3.1 | 6.5 |
Aug 1982 | 2.0 | -3.2 | 5.9 |
Sep 1982 | 1.7 | -4.1 | 5.0 |
Oct 1982 | 2.4 | -4.7 | 5.1 |
Nov 1982 | 2.0 | -5.3 | 4.6 |
Dec 1982 | 1.3 | -6.7 | 3.9 |
Jan 1983 | -.4 | -8.4 | 3.8 |
Feb 1983 | -1.5 | -10.0 | 3.5 |
Mar 1983 | -1.5 | -9.2 | 3.6 |
Apr 1983 | 3.6 | .2 | 3.9 |
May 1983 | 4.8 | 2.9 | 3.5 |
Jun 1983 | 2.1 | -1.5 | 2.6 |
Jul 1983 | 1.3 | -2.7 | 2.4 |
Aug 1983 | 1.2 | -2.2 | 2.6 |
Sep 1983 | 1.2 | -1.8 | 2.9 |
Oct 1983 | .0 | -2.1 | 2.9 |
Nov 1983 | -.6 | -2.5 | 3.2 |
Dec 1983 | -.5 | -1.6 | 3.8 |
Source: U.S. Bureau of Labor Statistics. | |||
The difficult inflation of the 1970s often is associated with the energy supply shocks of the era. Energy prices were indeed exceptionally volatile during the period. Surges in gasoline prices created two towering peaks in the CPI-U that explain much of the overall inflation of the era. As figure 6 shows, superimposing the energy and gasoline movements reveals their extraordinary volatility and their powerful influence on overall inflation.
Energy inflation was fairly modest until the first big shock in 1973.The scale of figure 6 obscures the fact that energy prices were increasing sharply even between the peaks, rising about 8 percent annually from 1975 to 1978. The second shock, in 1979–1980, reached an even higher peak than the first, before the index became negative in 1982, the year when the high-inflation era ended. Gasoline prices increased roughly fourfold from 1968 to their 1981 peak of around $1.39 per gallon.
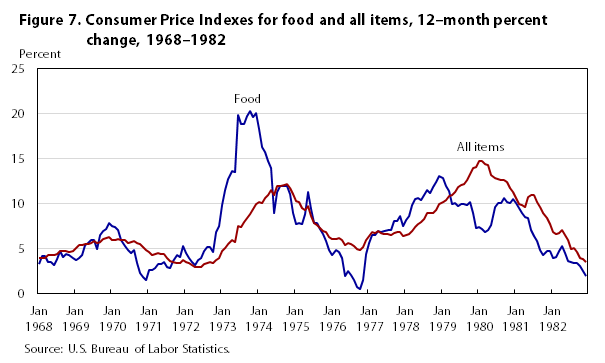
| Month and year | Index | |
|---|---|---|
| Food | All items | |
Jan 1968 | 2.1 | 3.4 |
Feb 1968 | 2.7 | 3.6 |
Mar 1968 | 3.3 | 3.9 |
Apr 1968 | 4.2 | 4.0 |
May 1968 | 4.2 | 4.0 |
Jun 1968 | 3.5 | 4.3 |
Jul 1968 | 3.5 | 4.3 |
Aug 1968 | 3.2 | 4.3 |
Sep 1968 | 3.8 | 4.4 |
Oct 1968 | 4.7 | 4.7 |
Nov 1968 | 4.1 | 4.7 |
Dec 1968 | 4.4 | 4.7 |
Jan 1969 | 4.3 | 4.6 |
Feb 1969 | 4.0 | 4.7 |
Mar 1969 | 3.7 | 5.1 |
Apr 1969 | 4.0 | 5.4 |
May 1969 | 4.3 | 5.4 |
Jun 1969 | 5.4 | 5.5 |
Jul 1969 | 5.6 | 5.5 |
Aug 1969 | 5.9 | 5.6 |
Sep 1969 | 5.9 | 5.8 |
Oct 1969 | 5.0 | 5.6 |
Nov 1969 | 6.5 | 5.7 |
Dec 1969 | 7.0 | 6.1 |
Jan 1970 | 7.2 | 6.2 |
Feb 1970 | 7.8 | 6.3 |
Mar 1970 | 7.5 | 6.0 |
Apr 1970 | 7.4 | 6.0 |
May 1970 | 7.1 | 6.1 |
Jun 1970 | 5.9 | 6.0 |
Jul 1970 | 5.3 | 5.9 |
Aug 1970 | 4.8 | 5.6 |
Sep 1970 | 4.5 | 5.7 |
Oct 1970 | 4.8 | 5.8 |
Nov 1970 | 3.4 | 5.6 |
Dec 1970 | 2.3 | 5.5 |
Jan 1971 | 1.8 | 5.2 |
Feb 1971 | 1.5 | 4.8 |
Mar 1971 | 2.6 | 4.6 |
Apr 1971 | 2.6 | 4.3 |
May 1971 | 2.8 | 4.4 |
Jun 1971 | 3.3 | 4.5 |
Jul 1971 | 3.3 | 4.4 |
Aug 1971 | 3.5 | 4.4 |
Sep 1971 | 3.0 | 4.0 |
Oct 1971 | 2.8 | 3.6 |
Nov 1971 | 3.6 | 3.5 |
Dec 1971 | 4.3 | 3.4 |
Jan 1972 | 4.1 | 3.4 |
Feb 1972 | 5.3 | 3.7 |
Mar 1972 | 4.5 | 3.5 |
Apr 1972 | 4.0 | 3.4 |
May 1972 | 3.5 | 3.2 |
Jun 1972 | 3.2 | 2.9 |
Jul 1972 | 3.7 | 3.0 |
Aug 1972 | 3.9 | 2.9 |
Sep 1972 | 4.7 | 3.3 |
Oct 1972 | 5.2 | 3.4 |
Nov 1972 | 5.2 | 3.5 |
Dec 1972 | 4.6 | 3.4 |
Jan 1973 | 6.8 | 3.7 |
Feb 1973 | 7.5 | 3.9 |
Mar 1973 | 9.8 | 4.7 |
Apr 1973 | 11.5 | 5.1 |
May 1973 | 12.7 | 5.5 |
Jun 1973 | 13.6 | 5.9 |
Jul 1973 | 13.5 | 5.7 |
Aug 1973 | 19.8 | 7.5 |
Sep 1973 | 18.8 | 7.4 |
Oct 1973 | 18.8 | 7.9 |
Nov 1973 | 19.7 | 8.4 |
Dec 1973 | 20.3 | 8.8 |
Jan 1974 | 19.6 | 9.4 |
Feb 1974 | 20.1 | 10.0 |
Mar 1974 | 18.3 | 10.2 |
Apr 1974 | 16.3 | 10.1 |
May 1974 | 15.7 | 10.6 |
Jun 1974 | 14.7 | 11.0 |
Jul 1974 | 14.0 | 11.5 |
Aug 1974 | 9.0 | 11.0 |
Sep 1974 | 11.3 | 12.0 |
Oct 1974 | 11.9 | 12.0 |
Nov 1974 | 11.9 | 12.1 |
Dec 1974 | 12.0 | 12.2 |
Jan 1975 | 11.1 | 11.7 |
Feb 1975 | 8.9 | 11.1 |
Mar 1975 | 7.7 | 10.3 |
Apr 1975 | 7.8 | 10.2 |
May 1975 | 7.7 | 9.5 |
Jun 1975 | 8.8 | 9.3 |
Jul 1975 | 11.3 | 9.7 |
Aug 1975 | 9.4 | 8.6 |
Sep 1975 | 7.8 | 7.8 |
Oct 1975 | 7.8 | 7.6 |
Nov 1975 | 7.2 | 7.3 |
Dec 1975 | 6.6 | 7.0 |
Jan 1976 | 5.8 | 6.8 |
Feb 1976 | 4.8 | 6.3 |
Mar 1976 | 4.3 | 6.1 |
Apr 1976 | 4.8 | 6.1 |
May 1976 | 4.6 | 6.2 |
Jun 1976 | 3.9 | 5.9 |
Jul 1976 | 2.0 | 5.4 |
Aug 1976 | 2.5 | 5.6 |
Sep 1976 | 2.1 | 5.5 |
Oct 1976 | 1.5 | 5.3 |
Nov 1976 | 0.7 | 5.0 |
Dec 1976 | 0.5 | 4.8 |
Jan 1977 | 1.5 | 5.2 |
Feb 1977 | 4.4 | 6.0 |
Mar 1977 | 5.6 | 6.4 |
Apr 1977 | 6.5 | 6.8 |
May 1977 | 6.5 | 6.7 |
Jun 1977 | 7.0 | 6.9 |
Jul 1977 | 6.8 | 6.7 |
Aug 1977 | 6.9 | 6.6 |
Sep 1977 | 7.1 | 6.6 |
Oct 1977 | 7.1 | 6.5 |
Nov 1977 | 8.1 | 6.7 |
Dec 1977 | 8.1 | 6.8 |
Jan 1978 | 8.6 | 6.8 |
Feb 1978 | 7.5 | 6.4 |
Mar 1978 | 8.2 | 6.5 |
Apr 1978 | 8.6 | 6.6 |
May 1978 | 9.8 | 7.0 |
Jun 1978 | 10.5 | 7.4 |
Jul 1978 | 10.6 | 7.7 |
Aug 1978 | 10.4 | 7.9 |
Sep 1978 | 10.9 | 8.3 |
Oct 1978 | 11.5 | 8.9 |
Nov 1978 | 11.2 | 9.0 |
Dec 1978 | 11.8 | 9.0 |
Jan 1979 | 12.4 | 9.3 |
Feb 1979 | 13.1 | 9.9 |
Mar 1979 | 12.8 | 10.2 |
Apr 1979 | 12.0 | 10.4 |
May 1979 | 11.4 | 10.8 |
Jun 1979 | 10.0 | 10.9 |
Jul 1979 | 10.1 | 11.3 |
Aug 1979 | 9.7 | 11.8 |
Sep 1979 | 9.9 | 12.1 |
Oct 1979 | 9.9 | 12.2 |
Nov 1979 | 9.8 | 12.6 |
Dec 1979 | 10.2 | 13.3 |
Jan 1980 | 8.9 | 13.9 |
Feb 1980 | 7.3 | 14.1 |
Mar 1980 | 7.4 | 14.7 |
Apr 1980 | 7.2 | 14.7 |
May 1980 | 6.8 | 14.4 |
Jun 1980 | 7.1 | 14.3 |
Jul 1980 | 7.6 | 13.2 |
Aug 1980 | 9.6 | 12.8 |
Sep 1980 | 10.1 | 12.7 |
Oct 1980 | 10.1 | 12.6 |
Nov 1980 | 10.6 | 12.6 |
Dec 1980 | 10.2 | 12.4 |
Jan 1981 | 10.1 | 11.7 |
Feb 1981 | 10.5 | 11.3 |
Mar 1981 | 10.1 | 10.6 |
Apr 1981 | 9.5 | 10.0 |
May 1981 | 8.9 | 9.8 |
Jun 1981 | 8.5 | 9.6 |
Jul 1981 | 8.4 | 10.7 |
Aug 1981 | 7.1 | 10.9 |
Sep 1981 | 6.4 | 11.0 |
Oct 1981 | 5.8 | 10.2 |
Nov 1981 | 4.8 | 9.6 |
Dec 1981 | 4.3 | 8.9 |
Jan 1982 | 4.7 | 8.4 |
Feb 1982 | 4.7 | 7.7 |
Mar 1982 | 3.9 | 6.8 |
Apr 1982 | 4.1 | 6.6 |
May 1982 | 4.7 | 6.7 |
Jun 1982 | 5.3 | 7.1 |
Jul 1982 | 4.5 | 6.5 |
Aug 1982 | 3.6 | 5.9 |
Sep 1982 | 3.5 | 5.0 |
Oct 1982 | 3.4 | 5.1 |
Nov 1982 | 3.4 | 4.6 |
Dec 1982 | 3.1 | 3.9 |
Source: U.S. Bureau of Labor Statistics. | ||
Though not rising to the same heights as gasoline inflation, food inflation also was an important story in this era. (See figure 7.)
Showing some volatility, but relatively restrained in the early part of the period, food inflation accelerated sharply, peaking at more than 20 percent at the end of 1973. Subsequently, a sharp decline pulled the overall rate of food inflation down to more modest levels in 1975 and 1976. Notably, food prices did not decline over any 12-month subperiod during the 1968–1983 period.
In 1974, the Nixon administration, which in 1969 had faced the problem of taming inflation of around 5 or 6 percent without causing a recession, faced an economy with inflation twice that high and that was already in a deep recession. A New York Times editorial assessed the grim situation:45
The problem of how to deal with the recession is greatly complicated by the persistence of the worst inflation the nation has experienced since the Civil War—and the worst ever in its peacetime history.
Nixon, of course, had other problems in 1974, and President Ford inherited the difficult inflation situation. In late 1974, he declared inflation to be “public enemy number one.” He solicited inflation-fighting ideas from the public, and his signature “Whip Inflation Now” (WIN) campaign was started. Citizens could receive their WIN button by signing this pledge:
I enlist as an Inflation Fighter and Energy Saver for the duration. I will do the very best I can for America.
An October 1974 newspaper reprints the form containing the pledge. Tellingly, the story next to the form asserts that relief from food prices was unlikely before 1976, while another account details the administration’s efforts to advance price-fixing legislation.46 Buttons were hardly the only WIN product: there were WIN duffel bags (as shown below), WIN earrings, and even a WIN football. The following tabulation shows annualized inflation rates for major categories for three subperiods between 1968 and 1976:
| Period | Annualized percent increase | |||
| All items | All items less food and energy | Food | Energy | |
| December 1968–December 1972 | 4.6 | 4.7 | 4.6 | 3.3 |
| December 1972–December 1974 | 10.5 | 7.9 | 16.1 | 19.3 |
| December 1974–December 1976 | 5.9 | 6.4 | 3.5 | 9.2 |

Despite the WIN earrings and football, total victory over inflation was not achieved. However, inflation did decline somewhat after the worst of the energy crisis passed. Following an increase of more than 12 percent in 1974, prices rose 7 percent in 1975 and just under 5 percent in 1976, with food prices nearly flat. The 1975 and 1976 levels were as modest as inflation got in the 1970s: energy prices surged again in late 1976 and early 1977, and the All-Items CPI would not drop below 5 percent again until 1982.
Inflation steadily worsened during the Carter era: prices rose nearly 7 percent in 1977 and 9 percent in 1978. By this time, inflation seemed to have momentum, and it was recognized that inflationary expectations could generate inflation. As President Carter put it,47
In the last 10 years, in our attempts to protect ourselves from inflation, we’ve developed attitudes and habits that actually keep inflation going once it has begun. Most companies raise their prices because they expect costs to rise. Unions call for large wage settlements because they expect it to happen, and once it’s started, wages and prices chase each other up and up. It’s like a crowd standing at a football stadium. No one can see any better than when everyone is sitting down, but no one is willing to be the first to sit down.
The Carter administration steadfastly sought to reverse the acceleration. Though not resorting to Nixon-style mandatory wage and price controls, President Carter advocated (1) voluntary controls backed by various government sanctions and incentives, (2) reducing the inflationary effects of fiscal policy through deficit reduction, and (3) deregulation to increase competition and limit price increases.48 Any success these measures had, however, was extinguished by a fresh burst of energy inflation in 1979, pushing the 12-month increase in the All-Items CPI over 13 percent by the end of 1979.
As the decade closed, inflation surpassed that of the peak of the energy crisis earlier in the decade and was the highest it had been since the post–World War II spike in 1947. The inflation of the late 1970s accompanied relatively dismal economic conditions. During the boom-time inflation of the late 1960s, unemployment had been under 4 percent. The unemployment of the late 1970s, though declining, was much higher than it was in the 1960s, and economic growth was sluggish. In 1979, President Carter gave a speech detailing some of the nation’s problems. Speaking of a “crisis of confidence,” he said,49
It is a crisis that strikes at the very heart and soul and spirit of our national will. We can see this crisis in the growing doubt about the meaning of our own lives and in the loss of a unity of purpose for our nation.
Although the President never actually used the word, the speech came to be known as the “malaise” speech, and the word is now associated with the era.50
Although energy shocks (and, to a lesser extent, food shocks) are often cited as a major cause of the inflation of the 1970s, inflation excluding food and energy remained high throughout the era. (Energy inflation can, of course, put upward pressure on other prices.) The CPI for all items less food and energy exceeded 5 percent from February 1974 through November 1982. Also, shelter costs increased sharply in the late 1970s, with the rent index rising 7.1 percent annually from 1975 through 1981. With interest rates high, homeownership costs rose even more sharply;51 the CPI shelter index rose at a 10.5-percent annual rate from 1975 through 1981, peaking at 20.9 percent in June 1980. (See figure 8.)
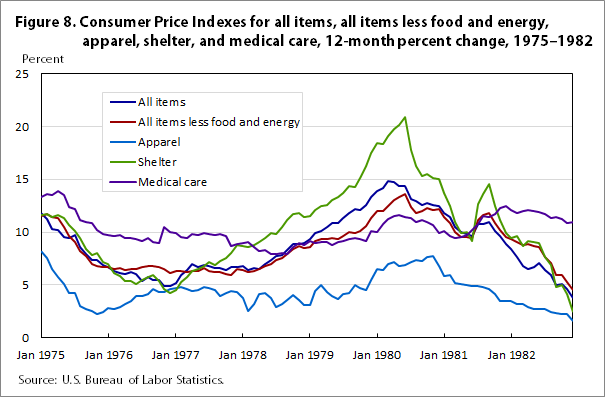
| Month and year | Index, percent change | ||||
|---|---|---|---|---|---|
| All items | All items less food and energy | Apparel | Shelter | Medical care | |
Jan 1975 | 11.8 | 11.5 | 8.2 | 11.6 | 13.3 |
Feb 1975 | 11.2 | 11.7 | 7.5 | 11.7 | 13.6 |
Mar 1975 | 10.3 | 11.4 | 6.5 | 11.4 | 13.5 |
Apr 1975 | 10.2 | 11.3 | 5.7 | 11.6 | 13.9 |
May 1975 | 9.5 | 10.5 | 5.1 | 11.3 | 13.5 |
Jun 1975 | 9.4 | 9.6 | 4.2 | 10.7 | 12.4 |
Jul 1975 | 9.7 | 9.1 | 4.2 | 10.1 | 12.2 |
Aug 1975 | 8.6 | 8.2 | 3.0 | 9.4 | 11.1 |
Sep 1975 | 7.9 | 7.7 | 2.7 | 8.4 | 11.0 |
Oct 1975 | 7.4 | 7.0 | 2.5 | 7.8 | 10.9 |
Nov 1975 | 7.4 | 6.8 | 2.2 | 8.0 | 10.2 |
Dec 1975 | 6.9 | 6.7 | 2.4 | 7.2 | 9.8 |
Jan 1976 | 6.7 | 6.7 | 2.8 | 7.0 | 9.7 |
Feb 1976 | 6.3 | 6.5 | 2.7 | 6.1 | 9.6 |
Mar 1976 | 6.1 | 6.6 | 2.9 | 5.8 | 9.7 |
Apr 1976 | 6.0 | 6.4 | 3.2 | 5.4 | 9.4 |
May 1976 | 6.2 | 6.5 | 3.5 | 5.4 | 9.4 |
Jun 1976 | 6.0 | 6.5 | 3.9 | 5.1 | 9.3 |
Jul 1976 | 5.4 | 6.7 | 3.9 | 5.5 | 9.2 |
Aug 1976 | 5.7 | 6.8 | 4.1 | 5.7 | 9.4 |
Sep 1976 | 5.5 | 6.8 | 4.6 | 5.9 | 9.1 |
Oct 1976 | 5.5 | 6.7 | 4.3 | 5.4 | 9.0 |
Nov 1976 | 4.9 | 6.5 | 4.3 | 4.6 | 10.5 |
Dec 1976 | 4.9 | 6.1 | 4.6 | 4.2 | 10.0 |
Jan 1977 | 5.2 | 6.3 | 4.7 | 4.5 | 9.9 |
Feb 1977 | 5.9 | 6.3 | 4.8 | 5.3 | 9.5 |
Mar 1977 | 6.4 | 6.2 | 4.6 | 5.7 | 9.4 |
Apr 1977 | 7.0 | 6.3 | 4.4 | 6.3 | 9.8 |
May 1977 | 6.7 | 6.3 | 4.5 | 6.5 | 9.7 |
Jun 1977 | 6.9 | 6.6 | 4.8 | 6.8 | 9.9 |
Jul 1977 | 6.8 | 6.3 | 4.7 | 7.2 | 9.8 |
Aug 1977 | 6.6 | 6.2 | 4.5 | 6.9 | 9.7 |
Sep 1977 | 6.6 | 6.2 | 3.9 | 7.3 | 9.8 |
Oct 1977 | 6.4 | 6.0 | 4.2 | 7.5 | 9.6 |
Nov 1977 | 6.7 | 5.9 | 4.4 | 8.0 | 8.7 |
Dec 1977 | 6.7 | 6.5 | 4.3 | 8.8 | 8.9 |
Jan 1978 | 6.8 | 6.4 | 3.8 | 8.7 | 9.0 |
Feb 1978 | 6.4 | 6.2 | 2.5 | 8.6 | 9.1 |
Mar 1978 | 6.6 | 6.3 | 3.2 | 8.8 | 8.6 |
Apr 1978 | 6.5 | 6.5 | 4.1 | 9.1 | 8.2 |
May 1978 | 7.0 | 6.8 | 4.2 | 9.4 | 8.3 |
Jun 1978 | 7.4 | 7.0 | 3.8 | 9.9 | 7.9 |
Jul 1978 | 7.7 | 7.4 | 2.9 | 9.8 | 7.9 |
Aug 1978 | 7.8 | 7.5 | 3.2 | 10.5 | 8.0 |
Sep 1978 | 8.3 | 7.9 | 3.6 | 11.1 | 7.9 |
Oct 1978 | 8.9 | 8.4 | 4.0 | 11.7 | 8.6 |
Nov 1978 | 8.9 | 8.7 | 3.6 | 11.8 | 9.0 |
Dec 1978 | 9.0 | 8.5 | 3.1 | 11.4 | 8.8 |
Jan 1979 | 9.3 | 8.6 | 3.1 | 11.5 | 9.2 |
Feb 1979 | 9.9 | 9.2 | 4.4 | 12.1 | 9.0 |
Mar 1979 | 10.1 | 9.3 | 5.0 | 12.5 | 9.1 |
Apr 1979 | 10.5 | 9.3 | 4.3 | 12.6 | 9.1 |
May 1979 | 10.9 | 9.4 | 3.9 | 13.0 | 8.8 |
Jun 1979 | 10.9 | 9.3 | 3.7 | 13.3 | 9.1 |
Jul 1979 | 11.3 | 9.6 | 4.1 | 13.7 | 9.2 |
Aug 1979 | 11.8 | 10.0 | 4.2 | 14.4 | 9.3 |
Sep 1979 | 12.2 | 9.9 | 5.0 | 14.3 | 9.4 |
Oct 1979 | 12.1 | 10.1 | 4.7 | 15.1 | 9.3 |
Nov 1979 | 12.6 | 10.6 | 4.5 | 16.3 | 9.2 |
Dec 1979 | 13.3 | 11.3 | 5.5 | 17.5 | 10.1 |
Jan 1980 | 13.9 | 12.0 | 6.5 | 18.4 | 10.0 |
Feb 1980 | 14.2 | 12.0 | 6.4 | 18.3 | 10.8 |
Mar 1980 | 14.8 | 12.5 | 7.0 | 19.1 | 11.2 |
Apr 1980 | 14.7 | 13.0 | 7.2 | 19.8 | 11.5 |
May 1980 | 14.4 | 13.3 | 6.8 | 20.1 | 11.6 |
Jun 1980 | 14.4 | 13.6 | 6.9 | 20.9 | 11.4 |
Jul 1980 | 13.1 | 12.4 | 7.2 | 17.8 | 11.3 |
Aug 1980 | 12.9 | 11.8 | 7.4 | 16.3 | 11.0 |
Sep 1980 | 12.6 | 12.0 | 7.3 | 15.3 | 11.1 |
Oct 1980 | 12.8 | 12.3 | 7.6 | 15.5 | 11.0 |
Nov 1980 | 12.6 | 12.1 | 7.7 | 15.1 | 10.7 |
Dec 1980 | 12.5 | 12.2 | 6.8 | 15.0 | 9.9 |
Jan 1981 | 11.8 | 11.4 | 5.8 | 13.7 | 10.1 |
Feb 1981 | 11.4 | 10.9 | 5.9 | 12.5 | 9.6 |
Mar 1981 | 10.5 | 10.0 | 5.2 | 11.0 | 9.4 |
Apr 1981 | 10.0 | 9.5 | 5.1 | 9.9 | 9.5 |
May 1981 | 9.8 | 9.5 | 5.0 | 10.0 | 9.7 |
Jun 1981 | 9.6 | 9.4 | 4.9 | 9.2 | 10.2 |
Jul 1981 | 10.8 | 11.1 | 4.9 | 12.7 | 10.8 |
Aug 1981 | 10.8 | 11.6 | 4.8 | 13.6 | 11.5 |
Sep 1981 | 11.0 | 11.8 | 4.6 | 14.6 | 11.4 |
Oct 1981 | 10.1 | 10.9 | 4.1 | 12.5 | 11.7 |
Nov 1981 | 9.6 | 10.2 | 3.5 | 11.1 | 12.3 |
Dec 1981 | 8.9 | 9.5 | 3.5 | 9.9 | 12.5 |
Jan 1982 | 8.4 | 9.3 | 3.5 | 9.4 | 12.1 |
Feb 1982 | 7.6 | 9.1 | 3.2 | 9.6 | 11.8 |
Mar 1982 | 6.8 | 8.8 | 3.2 | 8.7 | 12.0 |
Apr 1982 | 6.5 | 8.9 | 2.9 | 9.2 | 12.1 |
May 1982 | 6.7 | 8.7 | 2.7 | 9.1 | 12.0 |
Jun 1982 | 7.1 | 8.6 | 2.7 | 9.0 | 11.9 |
Jul 1982 | 6.4 | 7.6 | 2.7 | 7.6 | 11.7 |
Aug 1982 | 5.9 | 7.1 | 2.4 | 6.9 | 11.3 |
Sep 1982 | 5.0 | 5.9 | 2.3 | 4.8 | 11.4 |
Oct 1982 | 5.1 | 5.9 | 2.2 | 5.0 | 11.2 |
Nov 1982 | 4.6 | 5.3 | 2.2 | 4.1 | 10.9 |
Dec 1982 | 3.8 | 4.5 | 1.6 | 2.4 | 11.0 |
Source: U.S. Bureau of Labor Statistics. | |||||
As figure 8 shows, apparel costs increased more slowly than overall inflation during the late 1970s, and the trend has continued ever since. Also, medical care inflation ran high from 1975 to 1982, usually exceeding overall inflation; this trend has continued in recent decades.
With low productivity growth and an oil embargo on Iran, 1980 was a challenging time in the United States. Perhaps foremost among the problems, though, was inflation that had continued to accelerate since the late 1970s. “Inflation at 13.3 percent? What is this rapacious thing?” was a question posed in a New York Times piece that depicted inflation as an enormous dragon.52 Inflation peaked in March and April 1980, with the all-items index registering a 14.7-percent 12-month increase.
Inflation finally started to abate in 1981 and fell sharply in 1982. The reverberations of the energy supply shock quieted, and a Federal Reserve Board determined to rein inflation in pursued a tighter monetary policy. The result was a plunging CPI but a soaring unemployment rate; the era of high inflation ended, but left in its wake a bitter recession. Fortunately, the economy would recover, and 1983 would mark the end of a frustrating era that combined high inflation with substantial unemployment and sluggish growth. Better times lay ahead, with the coming years eventually witnessing the retreat of inflation, as well as the fear of inflation, as a dominant feature of the American economic landscape.
Largest 12-month increase: October 1989–October 1990 and November 1989–November 1990, 6.3 percent each
Largest 12-month decrease: July 2008–July 2009, 2.1 percent
Annualized increase of selected major components and aggregates, 1983–2013:
Prices of selected items, 1987:
By 1983, the typical American was surely weary of inflation. Prices had roughly doubled in just the previous 9 years, and inflation had been over 3 percent annually—usually far over 3 percent—for 15 consecutive years. A combination of relentless inflation and a sluggish economy had confounded policymakers and exasperated the public. Substantial inflation was more a fact of life than a possibility.
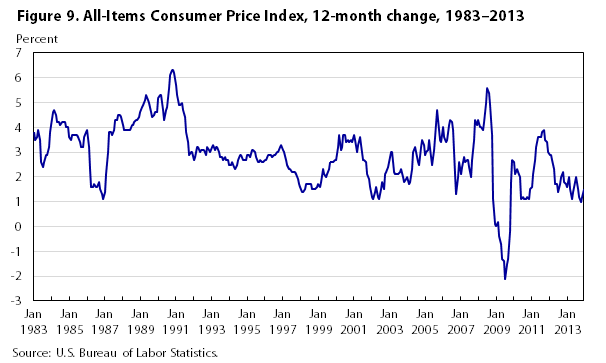
| Month and year | Percent change |
|---|---|
Jan 1982 | 8.4 |
Feb 1982 | 7.7 |
Mar 1982 | 6.8 |
Apr 1982 | 6.6 |
May 1982 | 6.7 |
Jun 1982 | 7.1 |
Jul 1982 | 6.5 |
Aug 1982 | 5.9 |
Sep 1982 | 5.0 |
Oct 1982 | 5.1 |
Nov 1982 | 4.6 |
Dec 1982 | 3.9 |
Jan 1983 | 3.8 |
Feb 1983 | 3.5 |
Mar 1983 | 3.6 |
Apr 1983 | 3.9 |
May 1983 | 3.5 |
Jun 1983 | 2.6 |
Jul 1983 | 2.4 |
Aug 1983 | 2.6 |
Sep 1983 | 2.9 |
Oct 1983 | 2.9 |
Nov 1983 | 3.2 |
Dec 1983 | 3.8 |
Jan 1984 | 4.1 |
Feb 1984 | 4.6 |
Mar 1984 | 4.7 |
Apr 1984 | 4.5 |
May 1984 | 4.2 |
Jun 1984 | 4.2 |
Jul 1984 | 4.1 |
Aug 1984 | 4.2 |
Sep 1984 | 4.2 |
Oct 1984 | 4.2 |
Nov 1984 | 4.0 |
Dec 1984 | 4.0 |
Jan 1985 | 3.6 |
Feb 1985 | 3.5 |
Mar 1985 | 3.7 |
Apr 1985 | 3.7 |
May 1985 | 3.7 |
Jun 1985 | 3.7 |
Jul 1985 | 3.6 |
Aug 1985 | 3.4 |
Sep 1985 | 3.2 |
Oct 1985 | 3.2 |
Nov 1985 | 3.6 |
Dec 1985 | 3.8 |
Jan 1986 | 3.9 |
Feb 1986 | 3.2 |
Mar 1986 | 2.3 |
Apr 1986 | 1.6 |
May 1986 | 1.6 |
Jun 1986 | 1.7 |
Jul 1986 | 1.6 |
Aug 1986 | 1.6 |
Sep 1986 | 1.8 |
Oct 1986 | 1.5 |
Nov 1986 | 1.3 |
Dec 1986 | 1.1 |
Jan 1987 | 1.4 |
Feb 1987 | 2.1 |
Mar 1987 | 3.0 |
Apr 1987 | 3.8 |
May 1987 | 3.8 |
Jun 1987 | 3.7 |
Jul 1987 | 3.9 |
Aug 1987 | 4.3 |
Sep 1987 | 4.3 |
Oct 1987 | 4.5 |
Nov 1987 | 4.5 |
Dec 1987 | 4.4 |
Jan 1988 | 4.1 |
Feb 1988 | 3.9 |
Mar 1988 | 3.9 |
Apr 1988 | 3.9 |
May 1988 | 3.9 |
Jun 1988 | 3.9 |
Jul 1988 | 4.1 |
Aug 1988 | 4.1 |
Sep 1988 | 4.2 |
Oct 1988 | 4.3 |
Nov 1988 | 4.3 |
Dec 1988 | 4.4 |
Jan 1989 | 4.6 |
Feb 1989 | 4.8 |
Mar 1989 | 4.9 |
Apr 1989 | 5.1 |
May 1989 | 5.3 |
Jun 1989 | 5.1 |
Jul 1989 | 5.0 |
Aug 1989 | 4.6 |
Sep 1989 | 4.4 |
Oct 1989 | 4.5 |
Nov 1989 | 4.6 |
Dec 1989 | 4.6 |
Jan 1990 | 5.2 |
Feb 1990 | 5.3 |
Mar 1990 | 5.3 |
Apr 1990 | 4.7 |
May 1990 | 4.3 |
Jun 1990 | 4.7 |
Jul 1990 | 4.8 |
Aug 1990 | 5.6 |
Sep 1990 | 6.1 |
Oct 1990 | 6.3 |
Nov 1990 | 6.3 |
Dec 1990 | 6.2 |
Jan 1991 | 5.7 |
Feb 1991 | 5.3 |
Mar 1991 | 4.9 |
Apr 1991 | 4.9 |
May 1991 | 5.0 |
Jun 1991 | 4.7 |
Jul 1991 | 4.4 |
Aug 1991 | 3.8 |
Sep 1991 | 3.4 |
Oct 1991 | 2.9 |
Nov 1991 | 3.0 |
Dec 1991 | 3.0 |
Jan 1992 | 2.7 |
Feb 1992 | 2.8 |
Mar 1992 | 3.2 |
Apr 1992 | 3.2 |
May 1992 | 3.0 |
Jun 1992 | 3.1 |
Jul 1992 | 3.1 |
Aug 1992 | 3.1 |
Sep 1992 | 2.9 |
Oct 1992 | 3.2 |
Nov 1992 | 3.1 |
Dec 1992 | 3.0 |
Jan 1993 | 3.2 |
Feb 1993 | 3.3 |
Mar 1993 | 3.1 |
Apr 1993 | 3.2 |
May 1993 | 3.2 |
Jun 1993 | 3.0 |
Jul 1993 | 2.8 |
Aug 1993 | 2.8 |
Sep 1993 | 2.7 |
Oct 1993 | 2.8 |
Nov 1993 | 2.7 |
Dec 1993 | 2.7 |
Jan 1994 | 2.5 |
Feb 1994 | 2.5 |
Mar 1994 | 2.6 |
Apr 1994 | 2.4 |
May 1994 | 2.3 |
Jun 1994 | 2.5 |
Jul 1994 | 2.7 |
Aug 1994 | 2.9 |
Sep 1994 | 2.9 |
Oct 1994 | 2.7 |
Nov 1994 | 2.7 |
Dec 1994 | 2.7 |
Jan 1995 | 2.9 |
Feb 1995 | 2.9 |
Mar 1995 | 2.8 |
Apr 1995 | 3.1 |
May 1995 | 3.1 |
Jun 1995 | 3.0 |
Jul 1995 | 2.8 |
Aug 1995 | 2.6 |
Sep 1995 | 2.6 |
Oct 1995 | 2.7 |
Nov 1995 | 2.6 |
Dec 1995 | 2.6 |
Jan 1996 | 2.7 |
Feb 1996 | 2.7 |
Mar 1996 | 2.9 |
Apr 1996 | 2.9 |
May 1996 | 2.9 |
Jun 1996 | 2.8 |
Jul 1996 | 2.9 |
Aug 1996 | 2.9 |
Sep 1996 | 3.0 |
Oct 1996 | 3.0 |
Nov 1996 | 3.2 |
Dec 1996 | 3.3 |
Jan 1997 | 3.1 |
Feb 1997 | 3.0 |
Mar 1997 | 2.7 |
Apr 1997 | 2.5 |
May 1997 | 2.3 |
Jun 1997 | 2.3 |
Jul 1997 | 2.2 |
Aug 1997 | 2.2 |
Sep 1997 | 2.2 |
Oct 1997 | 2.1 |
Nov 1997 | 1.9 |
Dec 1997 | 1.7 |
Jan 1998 | 1.6 |
Feb 1998 | 1.4 |
Mar 1998 | 1.4 |
Apr 1998 | 1.5 |
May 1998 | 1.7 |
Jun 1998 | 1.7 |
Jul 1998 | 1.7 |
Aug 1998 | 1.7 |
Sep 1998 | 1.5 |
Oct 1998 | 1.5 |
Nov 1998 | 1.5 |
Dec 1998 | 1.6 |
Jan 1999 | 1.7 |
Feb 1999 | 1.6 |
Mar 1999 | 1.8 |
Apr 1999 | 2.3 |
May 1999 | 2.1 |
Jun 1999 | 2.0 |
Jul 1999 | 2.1 |
Aug 1999 | 2.3 |
Sep 1999 | 2.6 |
Oct 1999 | 2.6 |
Nov 1999 | 2.6 |
Dec 1999 | 2.7 |
Jan 2000 | 2.7 |
Feb 2000 | 3.2 |
Mar 2000 | 3.7 |
Apr 2000 | 3.1 |
May 2000 | 3.2 |
Jun 2000 | 3.7 |
Jul 2000 | 3.7 |
Aug 2000 | 3.4 |
Sep 2000 | 3.5 |
Oct 2000 | 3.4 |
Nov 2000 | 3.5 |
Dec 2000 | 3.4 |
Jan 2001 | 3.7 |
Feb 2001 | 3.5 |
Mar 2001 | 3.0 |
Apr 2001 | 3.3 |
May 2001 | 3.6 |
Jun 2001 | 3.3 |
Jul 2001 | 2.7 |
Aug 2001 | 2.7 |
Sep 2001 | 2.6 |
Oct 2001 | 2.1 |
Nov 2001 | 1.9 |
Dec 2001 | 1.6 |
Jan 2002 | 1.2 |
Feb 2002 | 1.1 |
Mar 2002 | 1.4 |
Apr 2002 | 1.6 |
May 2002 | 1.2 |
Jun 2002 | 1.1 |
Jul 2002 | 1.5 |
Aug 2002 | 1.8 |
Sep 2002 | 1.5 |
Oct 2002 | 2.1 |
Nov 2002 | 2.2 |
Dec 2002 | 2.4 |
Jan 2003 | 2.6 |
Feb 2003 | 3.0 |
Mar 2003 | 3.0 |
Apr 2003 | 2.2 |
May 2003 | 2.1 |
Jun 2003 | 2.1 |
Jul 2003 | 2.1 |
Aug 2003 | 2.2 |
Sep 2003 | 2.3 |
Oct 2003 | 2.0 |
Nov 2003 | 1.8 |
Dec 2003 | 1.9 |
Jan 2004 | 2.0 |
Feb 2004 | 1.7 |
Mar 2004 | 1.8 |
Apr 2004 | 2.3 |
May 2004 | 3.0 |
Jun 2004 | 3.2 |
Jul 2004 | 3.0 |
Aug 2004 | 2.6 |
Sep 2004 | 2.5 |
Oct 2004 | 3.2 |
Nov 2004 | 3.5 |
Dec 2004 | 3.3 |
Jan 2005 | 2.9 |
Feb 2005 | 3.0 |
Mar 2005 | 3.1 |
Apr 2005 | 3.5 |
May 2005 | 2.8 |
Jun 2005 | 2.5 |
Jul 2005 | 3.1 |
Aug 2005 | 3.6 |
Sep 2005 | 4.7 |
Oct 2005 | 4.3 |
Nov 2005 | 3.5 |
Dec 2005 | 3.4 |
Jan 2006 | 4.0 |
Feb 2006 | 3.6 |
Mar 2006 | 3.4 |
Apr 2006 | 3.5 |
May 2006 | 4.1 |
Jun 2006 | 4.3 |
Jul 2006 | 4.2 |
Aug 2006 | 3.9 |
Sep 2006 | 2.1 |
Oct 2006 | 1.3 |
Nov 2006 | 2.0 |
Dec 2006 | 2.6 |
Jan 2007 | 2.1 |
Feb 2007 | 2.4 |
Mar 2007 | 2.8 |
Apr 2007 | 2.6 |
May 2007 | 2.7 |
Jun 2007 | 2.7 |
Jul 2007 | 2.4 |
Aug 2007 | 2.0 |
Sep 2007 | 2.7 |
Oct 2007 | 3.5 |
Nov 2007 | 4.3 |
Dec 2007 | 4.1 |
Jan 2008 | 4.3 |
Feb 2008 | 4.0 |
Mar 2008 | 4.0 |
Apr 2008 | 3.9 |
May 2008 | 4.2 |
Jun 2008 | 5.0 |
Jul 2008 | 5.6 |
Aug 2008 | 5.4 |
Sep 2008 | 4.9 |
Oct 2008 | 3.7 |
Nov 2008 | 1.1 |
Dec 2008 | .1 |
Jan 2009 | .0 |
Feb 2009 | .2 |
Mar 2009 | -.4 |
Apr 2009 | -.7 |
May 2009 | -1.3 |
Jun 2009 | -1.4 |
Jul 2009 | -2.1 |
Aug 2009 | -1.5 |
Sep 2009 | -1.3 |
Oct 2009 | -.2 |
Nov 2009 | 1.8 |
Dec 2009 | 2.7 |
Jan 2010 | 2.6 |
Feb 2010 | 2.1 |
Mar 2010 | 2.3 |
Apr 2010 | 2.2 |
May 2010 | 2.0 |
Jun 2010 | 1.1 |
Jul 2010 | 1.2 |
Aug 2010 | 1.1 |
Sep 2010 | 1.1 |
Oct 2010 | 1.2 |
Nov 2010 | 1.1 |
Dec 2010 | 1.5 |
Jan 2011 | 1.6 |
Feb 2011 | 2.1 |
Mar 2011 | 2.7 |
Apr 2011 | 3.2 |
May 2011 | 3.6 |
Jun 2011 | 3.6 |
Jul 2011 | 3.6 |
Aug 2011 | 3.8 |
Sep 2011 | 3.9 |
Oct 2011 | 3.5 |
Nov 2011 | 3.4 |
Dec 2011 | 3.0 |
Jan 2012 | 2.9 |
Feb 2012 | 2.9 |
Mar 2012 | 2.7 |
Apr 2012 | 2.3 |
May 2012 | 1.7 |
Jun 2012 | 1.7 |
Jul 2012 | 1.4 |
Aug 2012 | 1.7 |
Sep 2012 | 2.0 |
Oct 2012 | 2.2 |
Nov 2012 | 1.8 |
Dec 2012 | 1.7 |
Jan 2013 | 1.6 |
Feb 2013 | 2.0 |
Mar 2013 | 1.5 |
Apr 2013 | 1.1 |
May 2013 | 1.4 |
Jun 2013 | 1.8 |
Jul 2013 | 2.0 |
Aug 2013 | 1.5 |
Sep 2013 | 1.2 |
Oct 2013 | 1.0 |
Nov 2013 | 1.2 |
Dec 2013 | 1.5 |
Source: U.S. Bureau of Labor Statistics. | |
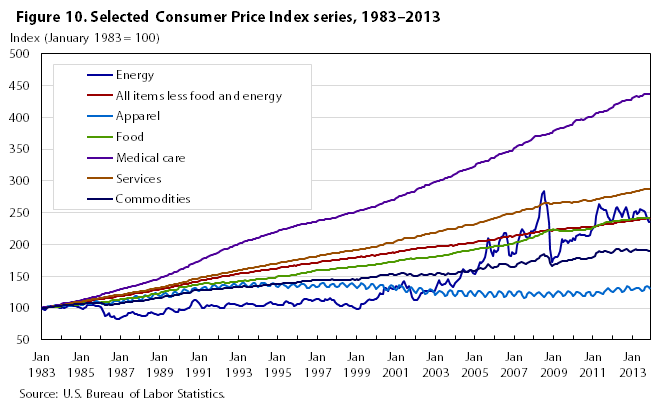
| Month and year | Index | ||||||
|---|---|---|---|---|---|---|---|
| Energy | All items less food and energy | Apparel | Food | Medical care | Services | Commodities | |
Jan 1983 | 100.0 | 100.0 | 100.0 | 100.0 | 100.0 | 100.0 | 100.0 |
Feb 1983 | 98.1 | 100.3 | 100.5 | 100.3 | 101.0 | 100.3 | 99.9 |
Mar 1983 | 96.5 | 100.5 | 101.8 | 100.8 | 101.3 | 100.4 | 99.9 |
Apr 1983 | 98.9 | 101.0 | 102.4 | 101.3 | 101.6 | 100.9 | 100.8 |
May 1983 | 101.6 | 101.2 | 102.7 | 101.5 | 101.8 | 101.3 | 101.4 |
Jun 1983 | 103.0 | 101.5 | 102.4 | 101.3 | 102.2 | 101.7 | 101.7 |
Jul 1983 | 103.7 | 102.0 | 102.1 | 101.3 | 102.9 | 102.3 | 102.0 |
Aug 1983 | 103.6 | 102.5 | 103.3 | 101.4 | 103.6 | 102.6 | 102.3 |
Sep 1983 | 103.5 | 103.2 | 104.9 | 101.5 | 103.9 | 103.3 | 102.7 |
Oct 1983 | 102.5 | 103.8 | 105.0 | 101.6 | 104.4 | 103.6 | 103.0 |
Nov 1983 | 101.3 | 104.3 | 105.0 | 101.5 | 104.9 | 103.8 | 103.1 |
Dec 1983 | 100.8 | 104.4 | 104.3 | 102.0 | 105.3 | 104.0 | 103.2 |
Jan 1984 | 100.5 | 104.8 | 102.8 | 103.9 | 106.2 | 104.7 | 103.7 |
Feb 1984 | 101.3 | 105.1 | 102.7 | 104.9 | 107.4 | 105.1 | 104.2 |
Mar 1984 | 100.8 | 105.5 | 104.0 | 104.9 | 107.7 | 105.4 | 104.4 |
Apr 1984 | 101.6 | 106.0 | 104.3 | 104.9 | 108.1 | 106.0 | 104.9 |
May 1984 | 102.7 | 106.5 | 104.1 | 104.6 | 108.4 | 106.5 | 105.0 |
Jun 1984 | 103.3 | 106.8 | 103.3 | 104.8 | 108.7 | 107.1 | 105.1 |
Jul 1984 | 103.3 | 107.2 | 102.9 | 105.2 | 109.4 | 107.8 | 105.1 |
Aug 1984 | 103.0 | 107.7 | 104.7 | 105.8 | 109.8 | 108.4 | 105.4 |
Sep 1984 | 103.4 | 108.4 | 106.9 | 105.6 | 110.2 | 109.1 | 105.7 |
Oct 1984 | 102.9 | 108.9 | 107.7 | 105.6 | 110.8 | 109.3 | 106.0 |
Nov 1984 | 101.7 | 109.1 | 107.4 | 105.5 | 111.4 | 109.4 | 105.9 |
Dec 1984 | 101.0 | 109.3 | 106.4 | 105.9 | 111.7 | 109.7 | 105.9 |
Jan 1985 | 100.0 | 109.5 | 104.6 | 106.6 | 112.5 | 110.1 | 105.8 |
Feb 1985 | 99.2 | 110.0 | 105.6 | 107.4 | 113.3 | 110.5 | 106.3 |
Mar 1985 | 100.5 | 110.6 | 107.5 | 107.4 | 114.0 | 111.0 | 106.8 |
Apr 1985 | 102.3 | 110.9 | 107.8 | 107.4 | 114.5 | 111.3 | 107.3 |
May 1985 | 104.1 | 111.3 | 107.5 | 107.2 | 114.9 | 112.1 | 107.4 |
Jun 1985 | 105.4 | 111.5 | 107.1 | 107.3 | 115.5 | 112.8 | 107.4 |
Jul 1985 | 105.5 | 111.7 | 106.2 | 107.4 | 116.1 | 113.3 | 107.2 |
Aug 1985 | 104.7 | 112.1 | 107.5 | 107.4 | 117.0 | 113.9 | 107.2 |
Sep 1985 | 104.4 | 112.7 | 109.8 | 107.5 | 117.5 | 114.4 | 107.5 |
Oct 1985 | 103.0 | 113.4 | 110.5 | 107.5 | 118.1 | 114.7 | 107.7 |
Nov 1985 | 102.5 | 113.9 | 110.6 | 107.9 | 118.8 | 115.0 | 108.2 |
Dec 1985 | 102.8 | 114.0 | 109.3 | 108.7 | 119.3 | 115.2 | 108.6 |
Jan 1986 | 102.4 | 114.3 | 107.3 | 109.6 | 120.2 | 115.9 | 108.7 |
Feb 1986 | 98.6 | 114.7 | 106.9 | 109.5 | 121.5 | 116.3 | 107.6 |
Mar 1986 | 92.0 | 115.1 | 108.0 | 109.5 | 122.5 | 116.8 | 106.2 |
Apr 1986 | 87.2 | 115.5 | 108.5 | 109.7 | 123.1 | 117.4 | 105.3 |
May 1986 | 88.7 | 115.7 | 108.0 | 110.0 | 123.6 | 117.8 | 105.6 |
Jun 1986 | 91.8 | 115.9 | 107.1 | 110.1 | 124.2 | 118.6 | 105.9 |
Jul 1986 | 88.4 | 116.3 | 106.4 | 111.1 | 125.0 | 119.0 | 105.5 |
Aug 1986 | 86.5 | 116.6 | 108.3 | 112.0 | 125.8 | 119.4 | 105.5 |
Sep 1986 | 86.9 | 117.3 | 111.0 | 112.1 | 126.5 | 119.9 | 106.1 |
Oct 1986 | 84.1 | 117.9 | 111.6 | 112.3 | 127.2 | 120.1 | 106.2 |
Nov 1986 | 82.4 | 118.2 | 111.5 | 112.6 | 127.9 | 120.1 | 106.3 |
Dec 1986 | 82.6 | 118.3 | 110.4 | 112.8 | 128.5 | 120.3 | 106.4 |
Jan 1987 | 84.9 | 118.6 | 108.4 | 114.2 | 129.3 | 120.8 | 107.2 |
Feb 1987 | 86.6 | 119.0 | 109.0 | 114.6 | 130.1 | 121.3 | 107.7 |
Mar 1987 | 86.8 | 119.7 | 112.6 | 114.6 | 130.8 | 121.7 | 108.4 |
Apr 1987 | 87.4 | 120.3 | 114.5 | 114.9 | 131.5 | 122.1 | 109.2 |
May 1987 | 88.5 | 120.5 | 114.1 | 115.4 | 132.0 | 122.5 | 109.5 |
Jun 1987 | 91.8 | 120.6 | 112.2 | 115.9 | 132.7 | 123.3 | 109.7 |
Jul 1987 | 92.2 | 120.9 | 110.2 | 115.8 | 133.5 | 123.7 | 109.6 |
Aug 1987 | 93.8 | 121.5 | 112.3 | 115.9 | 134.0 | 124.4 | 110.2 |
Sep 1987 | 93.4 | 122.3 | 116.3 | 116.2 | 134.5 | 124.9 | 110.9 |
Oct 1987 | 90.9 | 123.1 | 118.5 | 116.4 | 135.1 | 125.2 | 111.3 |
Nov 1987 | 90.1 | 123.5 | 118.5 | 116.3 | 135.6 | 125.3 | 111.5 |
Dec 1987 | 89.4 | 123.4 | 115.7 | 116.8 | 136.0 | 125.5 | 111.3 |
Jan 1988 | 88.5 | 123.8 | 113.3 | 117.8 | 137.3 | 126.2 | 111.2 |
Feb 1988 | 88.1 | 124.1 | 113.1 | 117.8 | 138.4 | 126.7 | 111.1 |
Mar 1988 | 87.6 | 124.9 | 117.4 | 118.0 | 139.2 | 127.1 | 111.8 |
Apr 1988 | 88.4 | 125.4 | 120.1 | 118.7 | 139.8 | 127.4 | 112.7 |
May 1988 | 89.8 | 125.7 | 119.4 | 119.1 | 140.4 | 127.9 | 113.1 |
Jun 1988 | 92.1 | 126.0 | 117.7 | 119.8 | 141.2 | 128.9 | 113.1 |
Jul 1988 | 92.5 | 126.3 | 115.7 | 121.0 | 142.3 | 129.5 | 113.5 |
Aug 1988 | 93.4 | 126.8 | 115.6 | 121.6 | 142.9 | 130.1 | 114.0 |
Sep 1988 | 93.0 | 127.8 | 120.9 | 122.4 | 143.4 | 130.7 | 115.1 |
Oct 1988 | 91.0 | 128.6 | 123.9 | 122.5 | 144.2 | 131.0 | 115.6 |
Nov 1988 | 90.0 | 128.9 | 123.1 | 122.4 | 144.8 | 131.2 | 115.6 |
Dec 1988 | 89.8 | 129.1 | 121.1 | 122.9 | 145.4 | 131.5 | 115.6 |
Jan 1989 | 90.1 | 129.5 | 118.4 | 124.4 | 146.9 | 132.3 | 116.0 |
Feb 1989 | 90.4 | 130.0 | 118.4 | 125.2 | 148.3 | 132.9 | 116.4 |
Mar 1989 | 90.9 | 130.7 | 122.5 | 125.8 | 149.2 | 133.5 | 117.3 |
Apr 1989 | 96.1 | 131.1 | 124.1 | 126.5 | 149.9 | 133.7 | 118.8 |
May 1989 | 98.6 | 131.5 | 123.6 | 127.2 | 150.7 | 134.3 | 119.7 |
Jun 1989 | 100.2 | 131.7 | 120.9 | 127.3 | 151.7 | 135.1 | 119.3 |
Jul 1989 | 99.7 | 132.2 | 118.1 | 127.8 | 152.9 | 136.0 | 119.1 |
Aug 1989 | 98.2 | 132.5 | 118.1 | 128.1 | 153.9 | 136.7 | 118.8 |
Sep 1989 | 97.1 | 133.2 | 123.2 | 128.4 | 155.0 | 137.0 | 119.5 |
Oct 1989 | 95.7 | 134.1 | 126.0 | 128.8 | 156.0 | 137.3 | 120.3 |
Nov 1989 | 94.3 | 134.5 | 125.4 | 129.2 | 157.2 | 137.7 | 120.5 |
Dec 1989 | 94.3 | 134.7 | 122.4 | 129.7 | 157.7 | 138.2 | 120.4 |
Jan 1990 | 98.8 | 135.2 | 119.8 | 132.8 | 159.2 | 139.0 | 122.1 |
Feb 1990 | 97.6 | 136.1 | 123.6 | 133.7 | 160.9 | 139.6 | 122.8 |
Mar 1990 | 96.7 | 137.2 | 128.7 | 133.9 | 162.1 | 140.6 | 123.3 |
Apr 1990 | 96.9 | 137.5 | 130.1 | 133.7 | 163.2 | 140.8 | 123.6 |
May 1990 | 97.9 | 137.7 | 128.9 | 133.7 | 164.2 | 141.3 | 123.6 |
Jun 1990 | 100.7 | 138.1 | 126.6 | 134.4 | 165.4 | 142.5 | 123.8 |
Jul 1990 | 100.1 | 138.8 | 124.0 | 135.1 | 167.0 | 143.6 | 123.8 |
Aug 1990 | 104.9 | 139.8 | 125.5 | 135.3 | 168.5 | 144.7 | 125.1 |
Sep 1990 | 110.1 | 140.6 | 130.2 | 135.6 | 169.4 | 145.2 | 126.9 |
Oct 1990 | 112.8 | 141.2 | 131.8 | 136.0 | 170.7 | 145.5 | 128.4 |
Nov 1990 | 112.2 | 141.6 | 130.9 | 136.5 | 172.0 | 145.8 | 128.6 |
Dec 1990 | 111.4 | 141.7 | 128.6 | 136.7 | 172.8 | 146.1 | 128.3 |
Jan 1991 | 108.4 | 142.8 | 127.1 | 138.3 | 174.7 | 147.6 | 128.3 |
Feb 1991 | 104.0 | 143.8 | 129.6 | 138.0 | 176.2 | 148.4 | 128.0 |
Mar 1991 | 100.9 | 144.4 | 132.2 | 138.3 | 177.4 | 148.7 | 128.0 |
Apr 1991 | 100.7 | 144.6 | 133.6 | 139.2 | 178.1 | 148.6 | 128.7 |
May 1991 | 103.3 | 144.8 | 132.9 | 139.3 | 179.0 | 148.9 | 129.1 |
Jun 1991 | 104.8 | 145.0 | 130.3 | 139.7 | 180.0 | 149.7 | 129.0 |
Jul 1991 | 103.9 | 145.5 | 128.5 | 139.0 | 181.3 | 150.7 | 128.5 |
Aug 1991 | 104.1 | 146.2 | 131.0 | 138.5 | 182.7 | 151.2 | 128.7 |
Sep 1991 | 104.9 | 146.9 | 134.8 | 138.5 | 183.6 | 151.8 | 129.4 |
Oct 1991 | 103.0 | 147.4 | 136.2 | 138.3 | 184.6 | 152.1 | 129.5 |
Nov 1991 | 103.0 | 148.0 | 136.4 | 138.7 | 185.7 | 152.3 | 130.1 |
Dec 1991 | 103.1 | 148.0 | 133.1 | 139.2 | 186.5 | 152.8 | 129.8 |
Jan 1992 | 101.3 | 148.5 | 131.3 | 139.7 | 188.3 | 153.6 | 129.5 |
Feb 1992 | 100.2 | 149.2 | 133.7 | 140.0 | 190.2 | 154.1 | 129.9 |
Mar 1992 | 100.1 | 150.0 | 137.0 | 140.6 | 191.3 | 154.7 | 130.8 |
Apr 1992 | 100.7 | 150.2 | 136.9 | 140.6 | 192.1 | 154.8 | 131.2 |
May 1992 | 103.6 | 150.3 | 136.7 | 139.9 | 192.7 | 154.9 | 131.5 |
Jun 1992 | 107.2 | 150.5 | 134.5 | 139.9 | 193.5 | 155.7 | 131.6 |
Jul 1992 | 107.3 | 150.9 | 132.6 | 139.7 | 194.8 | 156.6 | 131.4 |
Aug 1992 | 106.7 | 151.3 | 133.7 | 140.5 | 195.6 | 157.1 | 131.7 |
Sep 1992 | 107.2 | 151.7 | 136.9 | 141.0 | 196.4 | 157.3 | 132.3 |
Oct 1992 | 105.8 | 152.7 | 138.6 | 140.8 | 197.4 | 157.8 | 132.7 |
Nov 1992 | 105.8 | 153.0 | 138.1 | 140.8 | 198.5 | 158.1 | 132.9 |
Dec 1992 | 105.2 | 152.9 | 134.9 | 141.2 | 198.9 | 158.3 | 132.5 |
Jan 1993 | 104.7 | 153.6 | 133.2 | 142.4 | 200.6 | 159.3 | 132.8 |
Feb 1993 | 103.4 | 154.5 | 137.0 | 142.5 | 202.2 | 160.0 | 133.3 |
Mar 1993 | 103.7 | 155.1 | 139.8 | 142.7 | 202.9 | 160.4 | 133.8 |
Apr 1993 | 104.4 | 155.4 | 140.6 | 143.2 | 203.7 | 160.7 | 134.3 |
May 1993 | 105.7 | 155.4 | 138.6 | 143.7 | 204.8 | 161.1 | 134.4 |
Jun 1993 | 107.8 | 155.5 | 135.4 | 143.0 | 205.4 | 162.0 | 133.8 |
Jul 1993 | 107.1 | 155.7 | 132.9 | 142.9 | 206.5 | 162.6 | 133.3 |
Aug 1993 | 106.5 | 156.4 | 135.4 | 143.4 | 207.3 | 163.2 | 133.5 |
Sep 1993 | 106.5 | 156.7 | 138.2 | 143.7 | 207.7 | 163.6 | 133.7 |
Oct 1993 | 106.7 | 157.3 | 139.7 | 144.2 | 208.8 | 163.8 | 134.7 |
Nov 1993 | 105.0 | 157.7 | 139.8 | 144.5 | 209.3 | 163.9 | 134.9 |
Dec 1993 | 103.6 | 157.7 | 136.1 | 145.3 | 209.6 | 164.3 | 134.4 |
Jan 1994 | 102.5 | 158.1 | 133.9 | 146.3 | 210.8 | 165.0 | 134.4 |
Feb 1994 | 103.2 | 158.8 | 135.9 | 145.5 | 212.2 | 165.8 | 134.6 |
Mar 1994 | 103.1 | 159.6 | 139.7 | 145.8 | 212.8 | 166.4 | 135.2 |
Apr 1994 | 103.2 | 159.7 | 140.0 | 146.0 | 213.7 | 166.3 | 135.5 |
May 1994 | 104.1 | 159.8 | 139.2 | 146.1 | 214.2 | 166.3 | 135.8 |
Jun 1994 | 107.0 | 160.0 | 137.4 | 146.1 | 214.9 | 167.1 | 135.9 |
Jul 1994 | 108.1 | 160.2 | 134.4 | 146.8 | 216.0 | 167.8 | 136.2 |
Aug 1994 | 109.8 | 160.9 | 134.6 | 147.5 | 216.8 | 168.6 | 136.8 |
Sep 1994 | 109.5 | 161.4 | 137.8 | 147.7 | 217.4 | 168.8 | 137.3 |
Oct 1994 | 107.1 | 161.9 | 138.8 | 147.7 | 218.6 | 169.0 | 137.4 |
Nov 1994 | 107.0 | 162.1 | 137.8 | 148.0 | 219.3 | 169.1 | 137.7 |
Dec 1994 | 106.0 | 161.8 | 134.0 | 149.5 | 219.9 | 169.1 | 137.6 |
Jan 1995 | 105.5 | 162.6 | 132.9 | 150.2 | 221.2 | 170.3 | 137.6 |
Feb 1995 | 105.0 | 163.5 | 134.6 | 150.1 | 222.6 | 171.1 | 137.9 |
Mar 1995 | 104.5 | 164.3 | 138.0 | 150.1 | 223.1 | 171.8 | 138.4 |
Apr 1995 | 105.2 | 164.7 | 138.4 | 151.1 | 223.6 | 172.0 | 139.1 |
May 1995 | 107.6 | 164.8 | 137.0 | 151.0 | 224.0 | 172.2 | 139.4 |
Jun 1995 | 110.6 | 164.9 | 134.0 | 150.6 | 224.5 | 173.1 | 139.1 |
Jul 1995 | 109.4 | 165.1 | 131.7 | 150.8 | 225.5 | 173.7 | 138.7 |
Aug 1995 | 108.7 | 165.6 | 133.6 | 151.1 | 226.4 | 174.3 | 138.8 |
Sep 1995 | 107.5 | 166.1 | 136.2 | 151.6 | 226.9 | 174.5 | 139.3 |
Oct 1995 | 105.8 | 166.8 | 138.1 | 152.1 | 227.7 | 174.9 | 139.7 |
Nov 1995 | 104.0 | 167.0 | 137.3 | 152.1 | 228.3 | 174.8 | 139.7 |
Dec 1995 | 104.6 | 166.7 | 134.1 | 152.6 | 228.6 | 174.9 | 139.5 |
Jan 1996 | 106.3 | 167.4 | 133.5 | 153.8 | 230.0 | 175.9 | 140.3 |
Feb 1996 | 106.2 | 168.2 | 134.7 | 153.6 | 231.1 | 176.8 | 140.5 |
Mar 1996 | 107.4 | 169.0 | 138.4 | 154.4 | 231.5 | 177.2 | 141.8 |
Apr 1996 | 111.3 | 169.1 | 138.5 | 155.1 | 231.9 | 177.3 | 142.8 |
May 1996 | 114.3 | 169.2 | 137.3 | 154.8 | 232.3 | 177.7 | 143.0 |
Jun 1996 | 114.5 | 169.3 | 134.3 | 155.4 | 232.7 | 178.5 | 142.5 |
Jul 1996 | 113.9 | 169.6 | 131.7 | 156.0 | 233.6 | 179.5 | 142.1 |
Aug 1996 | 113.0 | 169.9 | 131.5 | 156.5 | 234.1 | 180.0 | 142.1 |
Sep 1996 | 113.1 | 170.5 | 135.0 | 157.4 | 234.3 | 180.3 | 142.9 |
Oct 1996 | 111.8 | 171.1 | 137.0 | 158.2 | 235.0 | 180.5 | 143.6 |
Nov 1996 | 112.4 | 171.3 | 137.0 | 158.8 | 235.4 | 180.6 | 144.1 |
Dec 1996 | 113.6 | 171.1 | 133.8 | 159.2 | 235.5 | 180.8 | 144.0 |
Jan 1997 | 114.7 | 171.6 | 133.1 | 159.4 | 236.8 | 181.7 | 144.1 |
Feb 1997 | 114.5 | 172.4 | 135.4 | 159.4 | 237.7 | 182.4 | 144.4 |
Mar 1997 | 112.6 | 173.2 | 138.1 | 159.5 | 238.4 | 183.0 | 144.6 |
Apr 1997 | 111.3 | 173.6 | 139.7 | 159.5 | 238.8 | 183.1 | 144.9 |
May 1997 | 111.2 | 173.5 | 138.9 | 159.5 | 239.2 | 183.2 | 144.7 |
Jun 1997 | 113.7 | 173.4 | 135.9 | 159.5 | 239.4 | 184.1 | 144.1 |
Jul 1997 | 112.8 | 173.7 | 133.7 | 159.9 | 239.8 | 184.9 | 143.6 |
Aug 1997 | 113.9 | 173.8 | 133.5 | 160.5 | 240.2 | 185.1 | 144.0 |
Sep 1997 | 115.3 | 174.2 | 136.6 | 160.8 | 240.4 | 185.4 | 144.7 |
Oct 1997 | 112.9 | 175.0 | 138.5 | 161.1 | 240.9 | 185.8 | 145.0 |
Nov 1997 | 112.0 | 175.0 | 138.3 | 161.4 | 241.5 | 185.8 | 144.9 |
Dec 1997 | 109.7 | 174.9 | 135.1 | 161.6 | 242.2 | 185.8 | 144.3 |
Jan 1998 | 107.2 | 175.4 | 133.3 | 162.8 | 243.2 | 186.7 | 144.2 |
Feb 1998 | 104.5 | 176.3 | 135.4 | 162.3 | 244.4 | 187.3 | 144.1 |
Mar 1998 | 102.8 | 176.8 | 138.5 | 162.6 | 244.9 | 187.8 | 144.1 |
Apr 1998 | 103.1 | 177.3 | 139.4 | 162.7 | 245.9 | 188.1 | 144.6 |
May 1998 | 105.1 | 177.4 | 138.9 | 163.2 | 246.6 | 188.3 | 144.9 |
Jun 1998 | 107.0 | 177.3 | 136.0 | 163.0 | 247.2 | 189.1 | 144.4 |
Jul 1998 | 106.5 | 177.6 | 133.1 | 163.4 | 247.9 | 189.8 | 144.2 |
Aug 1998 | 105.1 | 178.1 | 135.1 | 164.0 | 248.7 | 190.2 | 144.3 |
Sep 1998 | 103.9 | 178.5 | 137.2 | 164.1 | 249.1 | 190.5 | 144.4 |
Oct 1998 | 102.5 | 179.0 | 139.2 | 165.0 | 249.5 | 190.5 | 145.2 |
Nov 1998 | 101.7 | 179.1 | 138.6 | 165.1 | 249.9 | 190.6 | 145.1 |
Dec 1998 | 100.1 | 179.1 | 134.2 | 165.3 | 250.5 | 190.7 | 144.8 |
Jan 1999 | 99.3 | 179.6 | 131.3 | 166.6 | 251.9 | 191.3 | 145.1 |
Feb 1999 | 98.5 | 180.0 | 133.2 | 166.3 | 253.0 | 191.9 | 144.8 |
Mar 1999 | 99.6 | 180.5 | 136.2 | 166.3 | 253.6 | 192.6 | 145.2 |
Apr 1999 | 106.3 | 181.1 | 138.8 | 166.4 | 254.4 | 192.8 | 147.3 |
May 1999 | 106.9 | 180.9 | 137.8 | 166.7 | 254.9 | 192.9 | 147.1 |
Jun 1999 | 108.1 | 180.9 | 134.4 | 166.6 | 255.6 | 193.6 | 146.5 |
Jul 1999 | 110.0 | 181.3 | 130.7 | 166.8 | 256.5 | 194.6 | 146.5 |
Aug 1999 | 112.7 | 181.5 | 130.9 | 167.2 | 257.3 | 195.0 | 147.1 |
Sep 1999 | 114.6 | 182.1 | 135.3 | 167.6 | 257.7 | 195.2 | 148.5 |
Oct 1999 | 113.0 | 182.7 | 138.2 | 168.1 | 258.2 | 195.3 | 149.1 |
Nov 1999 | 112.6 | 182.8 | 137.2 | 168.2 | 258.7 | 195.6 | 148.9 |
Dec 1999 | 113.6 | 182.6 | 133.6 | 168.4 | 259.7 | 195.6 | 148.8 |
Jan 2000 | 113.9 | 183.2 | 130.2 | 169.1 | 261.0 | 196.7 | 148.9 |
Feb 2000 | 118.1 | 183.9 | 132.6 | 169.3 | 262.5 | 197.5 | 150.1 |
Mar 2000 | 123.7 | 184.9 | 136.0 | 169.6 | 263.6 | 198.5 | 151.9 |
Apr 2000 | 122.2 | 185.3 | 136.9 | 169.7 | 264.4 | 198.7 | 152.0 |
May 2000 | 122.5 | 185.3 | 135.7 | 170.4 | 265.0 | 199.0 | 151.9 |
Jun 2000 | 131.2 | 185.5 | 131.7 | 170.4 | 266.1 | 200.5 | 152.4 |
Jul 2000 | 131.3 | 185.8 | 127.8 | 171.2 | 267.0 | 201.5 | 152.0 |
Aug 2000 | 127.4 | 186.2 | 128.6 | 171.8 | 268.2 | 202.3 | 151.3 |
Sep 2000 | 132.2 | 186.8 | 133.9 | 172.0 | 268.7 | 202.5 | 153.1 |
Oct 2000 | 130.9 | 187.3 | 136.3 | 172.2 | 269.4 | 202.9 | 153.2 |
Nov 2000 | 130.6 | 187.5 | 135.3 | 172.0 | 269.8 | 202.9 | 153.4 |
Dec 2000 | 129.7 | 187.3 | 131.2 | 173.1 | 270.5 | 203.3 | 152.7 |
Jan 2001 | 134.1 | 188.0 | 128.7 | 174.0 | 272.8 | 205.5 | 152.7 |
Feb 2001 | 133.6 | 188.9 | 131.8 | 174.4 | 274.7 | 206.4 | 153.4 |
Mar 2001 | 131.1 | 189.9 | 135.7 | 174.8 | 275.8 | 207.2 | 153.5 |
Apr 2001 | 134.7 | 190.2 | 135.4 | 175.1 | 276.6 | 207.3 | 154.7 |
May 2001 | 141.8 | 190.1 | 133.3 | 175.7 | 277.2 | 207.9 | 155.7 |
Jun 2001 | 142.2 | 190.5 | 129.7 | 176.2 | 278.3 | 209.4 | 154.9 |
Jul 2001 | 134.0 | 190.8 | 125.9 | 176.7 | 279.0 | 210.0 | 153.2 |
Aug 2001 | 131.0 | 191.2 | 125.9 | 177.1 | 280.3 | 210.7 | 152.5 |
Sep 2001 | 134.1 | 191.7 | 130.2 | 177.3 | 280.9 | 210.4 | 154.3 |
Oct 2001 | 123.6 | 192.2 | 133.0 | 178.1 | 281.8 | 210.2 | 153.3 |
Nov 2001 | 117.4 | 192.7 | 131.4 | 177.8 | 282.6 | 210.6 | 152.2 |
Dec 2001 | 112.8 | 192.4 | 127.0 | 177.9 | 283.2 | 210.8 | 150.6 |
Jan 2002 | 113.1 | 192.8 | 123.6 | 179.0 | 285.6 | 211.8 | 150.5 |
Feb 2002 | 112.3 | 193.9 | 126.8 | 179.1 | 287.0 | 212.8 | 150.8 |
Mar 2002 | 117.0 | 194.5 | 131.6 | 179.3 | 288.0 | 213.6 | 152.1 |
Apr 2002 | 123.7 | 195.0 | 132.2 | 179.4 | 289.3 | 214.0 | 153.8 |
May 2002 | 124.4 | 194.9 | 130.5 | 179.0 | 290.2 | 214.4 | 153.3 |
Jun 2002 | 126.4 | 194.8 | 126.0 | 179.0 | 290.8 | 215.4 | 152.5 |
Jul 2002 | 127.0 | 195.0 | 121.9 | 179.2 | 292.7 | 216.3 | 152.0 |
Aug 2002 | 127.3 | 195.7 | 123.7 | 179.2 | 293.5 | 217.1 | 152.3 |
Sep 2002 | 127.6 | 196.0 | 127.9 | 179.6 | 293.9 | 217.1 | 153.0 |
Oct 2002 | 127.3 | 196.5 | 130.2 | 179.7 | 295.4 | 217.4 | 153.5 |
Nov 2002 | 126.8 | 196.5 | 128.9 | 180.0 | 296.7 | 217.5 | 153.4 |
Dec 2002 | 124.8 | 196.1 | 124.7 | 180.5 | 297.5 | 217.6 | 152.4 |
Jan 2003 | 129.0 | 196.5 | 121.3 | 180.8 | 298.9 | 218.8 | 152.7 |
Feb 2003 | 137.0 | 197.2 | 123.8 | 181.6 | 300.0 | 219.7 | 154.8 |
Mar 2003 | 144.3 | 197.7 | 126.9 | 181.9 | 300.5 | 220.8 | 155.9 |
Apr 2003 | 139.8 | 197.8 | 127.2 | 181.7 | 300.9 | 220.8 | 155.0 |
May 2003 | 135.6 | 198.0 | 125.8 | 182.1 | 301.8 | 221.7 | 153.7 |
Jun 2003 | 138.2 | 197.7 | 122.7 | 182.9 | 302.7 | 222.6 | 153.2 |
Jul 2003 | 138.5 | 198.0 | 119.3 | 183.0 | 304.0 | 223.4 | 152.7 |
Aug 2003 | 142.3 | 198.3 | 120.3 | 183.7 | 304.8 | 223.8 | 153.7 |
Sep 2003 | 146.4 | 198.4 | 125.3 | 184.0 | 305.6 | 223.9 | 154.8 |
Oct 2003 | 138.6 | 199.1 | 128.1 | 185.0 | 306.3 | 224.2 | 154.2 |
Nov 2003 | 134.7 | 198.7 | 126.4 | 185.7 | 307.3 | 223.7 | 153.7 |
Dec 2003 | 133.4 | 198.4 | 122.2 | 187.0 | 308.6 | 223.7 | 153.2 |
Jan 2004 | 139.1 | 198.8 | 118.9 | 187.2 | 310.1 | 224.9 | 153.9 |
Feb 2004 | 142.3 | 199.7 | 121.8 | 187.5 | 312.6 | 225.8 | 155.1 |
Mar 2004 | 144.8 | 200.9 | 126.8 | 187.8 | 314.1 | 226.9 | 156.5 |
Apr 2004 | 147.7 | 201.3 | 127.6 | 187.9 | 314.9 | 227.4 | 157.1 |
May 2004 | 156.0 | 201.3 | 126.7 | 189.5 | 315.6 | 227.8 | 158.9 |
Jun 2004 | 161.6 | 201.4 | 123.3 | 189.7 | 316.6 | 229.3 | 158.7 |
Jul 2004 | 158.2 | 201.4 | 119.0 | 190.2 | 317.7 | 230.1 | 157.3 |
Aug 2004 | 157.2 | 201.6 | 119.6 | 190.2 | 318.3 | 230.5 | 157.0 |
Sep 2004 | 156.2 | 202.3 | 124.4 | 190.1 | 319.0 | 230.5 | 157.7 |
Oct 2004 | 159.6 | 203.1 | 127.4 | 191.3 | 320.0 | 230.5 | 160.0 |
Nov 2004 | 160.5 | 203.0 | 126.3 | 191.6 | 320.8 | 230.6 | 160.1 |
Dec 2004 | 155.6 | 202.7 | 122.0 | 192.0 | 321.7 | 230.6 | 158.7 |
Jan 2005 | 153.7 | 203.3 | 119.2 | 192.6 | 323.6 | 231.6 | 158.2 |
Feb 2005 | 157.1 | 204.4 | 121.9 | 192.3 | 326.1 | 232.9 | 159.4 |
Mar 2005 | 162.8 | 205.6 | 126.8 | 192.6 | 327.6 | 234.1 | 161.1 |
Apr 2005 | 173.0 | 205.8 | 127.0 | 193.7 | 328.4 | 234.7 | 163.2 |
May 2005 | 171.5 | 205.7 | 125.7 | 194.1 | 329.1 | 234.9 | 162.7 |
Jun 2005 | 173.5 | 205.5 | 121.5 | 193.9 | 329.8 | 235.9 | 161.8 |
Jul 2005 | 180.7 | 205.7 | 116.8 | 194.3 | 331.1 | 237.1 | 162.4 |
Aug 2005 | 188.9 | 205.9 | 118.9 | 194.4 | 330.8 | 237.5 | 164.1 |
Sep 2005 | 210.5 | 206.3 | 123.7 | 194.9 | 331.6 | 237.9 | 168.6 |
Oct 2005 | 206.8 | 207.3 | 126.0 | 195.6 | 333.2 | 239.2 | 168.1 |
Nov 2005 | 189.9 | 207.3 | 124.7 | 195.9 | 335.1 | 239.7 | 164.5 |
Dec 2005 | 182.2 | 207.1 | 120.6 | 196.4 | 335.4 | 239.4 | 162.9 |
Jan 2006 | 191.8 | 207.6 | 118.0 | 197.7 | 336.6 | 241.2 | 164.3 |
Feb 2006 | 188.7 | 208.6 | 119.7 | 197.6 | 339.2 | 242.0 | 164.4 |
Mar 2006 | 190.9 | 209.9 | 125.3 | 197.6 | 341.0 | 242.9 | 165.8 |
Apr 2006 | 203.8 | 210.6 | 126.7 | 197.3 | 341.9 | 243.4 | 168.5 |
May 2006 | 211.8 | 210.8 | 125.7 | 197.8 | 342.8 | 244.0 | 170.0 |
Jun 2006 | 213.9 | 211.0 | 122.1 | 198.1 | 343.2 | 245.6 | 169.3 |
Jul 2006 | 217.7 | 211.3 | 116.8 | 198.6 | 344.2 | 246.6 | 169.5 |
Aug 2006 | 217.3 | 211.8 | 119.2 | 199.1 | 344.9 | 247.3 | 169.7 |
Sep 2006 | 201.5 | 212.3 | 124.9 | 199.8 | 345.6 | 247.5 | 167.4 |
Oct 2006 | 183.5 | 212.9 | 126.6 | 200.7 | 346.6 | 247.3 | 165.5 |
Nov 2006 | 182.6 | 212.7 | 124.9 | 200.4 | 347.4 | 247.3 | 164.8 |
Dec 2006 | 187.4 | 212.4 | 121.8 | 200.6 | 347.4 | 247.6 | 165.1 |
Jan 2007 | 185.8 | 213.1 | 119.1 | 202.5 | 350.9 | 249.0 | 164.9 |
Feb 2007 | 186.7 | 214.3 | 122.2 | 203.7 | 353.9 | 250.3 | 165.9 |
Mar 2007 | 199.3 | 215.1 | 125.9 | 204.1 | 354.6 | 251.2 | 168.7 |
Apr 2007 | 209.8 | 215.5 | 126.2 | 204.5 | 355.7 | 251.8 | 170.9 |
May 2007 | 221.7 | 215.5 | 124.7 | 205.5 | 356.6 | 252.4 | 172.9 |
Jun 2007 | 223.8 | 215.6 | 120.4 | 206.2 | 357.0 | 254.1 | 172.0 |
Jul 2007 | 219.9 | 215.9 | 116.5 | 206.8 | 359.2 | 255.0 | 171.0 |
Aug 2007 | 211.8 | 216.3 | 117.5 | 207.6 | 360.5 | 255.2 | 170.0 |
Sep 2007 | 212.2 | 216.8 | 122.7 | 208.7 | 361.3 | 255.3 | 171.0 |
Oct 2007 | 210.1 | 217.5 | 125.1 | 209.6 | 363.3 | 255.5 | 171.8 |
Nov 2007 | 221.7 | 217.7 | 124.4 | 210.1 | 364.7 | 255.6 | 174.2 |
Dec 2007 | 220.1 | 217.6 | 121.4 | 210.5 | 365.3 | 255.9 | 173.6 |
Jan 2008 | 222.1 | 218.4 | 118.9 | 212.4 | 368.2 | 257.3 | 174.3 |
Feb 2008 | 222.0 | 219.1 | 121.0 | 213.0 | 369.9 | 258.2 | 174.7 |
Mar 2008 | 233.3 | 220.1 | 124.1 | 213.2 | 370.8 | 259.6 | 177.1 |
Apr 2008 | 243.1 | 220.3 | 125.4 | 215.0 | 371.0 | 260.2 | 179.1 |
May 2008 | 260.2 | 220.5 | 124.0 | 215.9 | 371.2 | 261.3 | 181.6 |
Jun 2008 | 279.0 | 220.9 | 120.1 | 217.2 | 371.4 | 263.5 | 183.8 |
Jul 2008 | 284.2 | 221.4 | 117.4 | 219.2 | 371.8 | 265.3 | 184.4 |
Aug 2008 | 269.5 | 221.8 | 119.5 | 220.4 | 372.3 | 265.5 | 182.4 |
Sep 2008 | 261.2 | 222.2 | 124.4 | 221.7 | 372.9 | 264.9 | 182.4 |
Oct 2008 | 234.4 | 222.4 | 125.5 | 222.7 | 373.6 | 264.4 | 178.5 |
Nov 2008 | 192.2 | 222.0 | 124.5 | 222.8 | 374.5 | 263.8 | 170.7 |
Dec 2008 | 173.2 | 221.4 | 120.2 | 222.8 | 375.0 | 263.6 | 166.6 |
Jan 2009 | 176.7 | 222.0 | 117.8 | 223.7 | 377.8 | 264.7 | 167.4 |
Feb 2009 | 180.9 | 223.0 | 122.0 | 223.2 | 380.4 | 265.2 | 168.9 |
Mar 2009 | 179.6 | 224.0 | 125.8 | 222.6 | 381.2 | 265.5 | 169.7 |
Apr 2009 | 181.9 | 224.5 | 126.5 | 222.2 | 382.2 | 265.4 | 170.9 |
May 2009 | 189.2 | 224.5 | 125.0 | 221.8 | 383.1 | 265.3 | 172.2 |
Jun 2009 | 207.9 | 224.7 | 122.0 | 221.7 | 383.1 | 266.5 | 174.7 |
Jul 2009 | 204.4 | 224.7 | 118.7 | 221.2 | 383.8 | 266.9 | 173.6 |
Aug 2009 | 207.5 | 225.0 | 120.3 | 221.3 | 384.6 | 267.3 | 174.2 |
Sep 2009 | 204.7 | 225.6 | 125.7 | 221.2 | 385.8 | 267.1 | 174.7 |
Oct 2009 | 201.6 | 226.2 | 127.3 | 221.5 | 386.7 | 266.8 | 175.4 |
Nov 2009 | 206.5 | 225.8 | 125.7 | 221.2 | 387.7 | 266.2 | 176.2 |
Dec 2009 | 204.8 | 225.4 | 122.5 | 221.6 | 387.7 | 266.0 | 175.7 |
Jan 2010 | 210.6 | 225.5 | 119.8 | 222.9 | 390.9 | 266.4 | 176.8 |
Feb 2010 | 206.9 | 226.0 | 122.0 | 222.8 | 394.2 | 266.7 | 176.6 |
Mar 2010 | 212.5 | 226.5 | 125.3 | 223.0 | 395.4 | 267.1 | 178.0 |
Apr 2010 | 215.6 | 226.6 | 125.4 | 223.2 | 396.0 | 267.4 | 178.5 |
May 2010 | 217.0 | 226.6 | 124.2 | 223.4 | 396.1 | 267.7 | 178.5 |
Jun 2010 | 214.2 | 226.7 | 121.5 | 223.2 | 396.5 | 268.7 | 177.1 |
Jul 2010 | 215.0 | 226.7 | 118.3 | 223.1 | 396.2 | 269.2 | 176.7 |
Aug 2010 | 215.2 | 227.0 | 119.8 | 223.5 | 396.8 | 269.4 | 177.1 |
Sep 2010 | 212.6 | 227.4 | 124.2 | 224.3 | 399.0 | 269.3 | 177.5 |
Oct 2010 | 213.5 | 227.5 | 125.7 | 224.7 | 399.6 | 268.9 | 178.4 |
Nov 2010 | 214.5 | 227.5 | 124.7 | 224.7 | 400.1 | 268.9 | 178.6 |
Dec 2010 | 220.6 | 227.2 | 121.2 | 225.0 | 400.4 | 269.1 | 179.2 |
Jan 2011 | 226.0 | 227.6 | 119.8 | 227.0 | 402.3 | 269.7 | 180.7 |
Feb 2011 | 229.6 | 228.5 | 121.5 | 227.9 | 405.6 | 270.5 | 182.2 |
Mar 2011 | 245.5 | 229.2 | 124.5 | 229.5 | 406.3 | 271.0 | 186.1 |
Apr 2011 | 256.6 | 229.6 | 125.5 | 230.3 | 407.4 | 271.3 | 188.7 |
May 2011 | 263.5 | 230.1 | 125.5 | 231.1 | 407.9 | 272.0 | 190.2 |
Jun 2011 | 257.3 | 230.4 | 123.8 | 231.5 | 408.1 | 273.0 | 188.7 |
Jul 2011 | 255.7 | 230.7 | 121.9 | 232.5 | 408.9 | 273.8 | 188.3 |
Aug 2011 | 254.8 | 231.4 | 124.8 | 233.8 | 409.5 | 274.4 | 189.0 |
Sep 2011 | 253.5 | 231.9 | 128.6 | 234.8 | 410.2 | 274.7 | 189.4 |
Oct 2011 | 243.8 | 232.3 | 131.0 | 235.3 | 412.1 | 274.5 | 188.6 |
Nov 2011 | 241.1 | 232.4 | 130.7 | 235.0 | 413.5 | 274.6 | 188.2 |
Dec 2011 | 235.1 | 232.3 | 126.8 | 235.5 | 414.3 | 274.9 | 186.7 |
Jan 2012 | 239.8 | 232.8 | 125.4 | 236.9 | 416.8 | 275.6 | 188.0 |
Feb 2012 | 245.6 | 233.5 | 126.6 | 236.7 | 419.3 | 276.0 | 189.7 |
Mar 2012 | 256.7 | 234.4 | 130.7 | 237.1 | 420.3 | 276.6 | 192.7 |
Apr 2012 | 258.8 | 234.9 | 131.9 | 237.5 | 421.3 | 277.1 | 193.6 |
May 2012 | 253.3 | 235.2 | 131.1 | 237.6 | 422.5 | 277.7 | 192.4 |
Jun 2012 | 247.1 | 235.5 | 128.6 | 237.8 | 424.3 | 279.0 | 190.4 |
Jul 2012 | 242.9 | 235.5 | 125.6 | 237.9 | 425.7 | 279.3 | 189.3 |
Aug 2012 | 253.3 | 235.9 | 126.9 | 238.4 | 426.1 | 279.8 | 191.4 |
Sep 2012 | 259.4 | 236.5 | 132.1 | 238.6 | 427.0 | 280.3 | 193.0 |
Oct 2012 | 253.6 | 237.0 | 134.9 | 239.2 | 427.3 | 280.4 | 192.8 |
Nov 2012 | 241.8 | 236.9 | 133.0 | 239.2 | 427.6 | 280.6 | 190.3 |
Dec 2012 | 236.3 | 236.7 | 129.0 | 239.7 | 427.6 | 281.0 | 188.6 |
Jan 2013 | 237.5 | 237.3 | 128.0 | 240.7 | 429.7 | 282.0 | 189.0 |
Feb 2013 | 251.2 | 238.1 | 129.7 | 240.6 | 432.3 | 282.9 | 192.0 |
Mar 2013 | 252.6 | 238.8 | 131.7 | 240.7 | 433.3 | 283.4 | 192.8 |
Apr 2013 | 247.7 | 239.0 | 132.3 | 241.2 | 432.9 | 283.6 | 192.0 |
May 2013 | 250.8 | 239.2 | 131.4 | 240.9 | 431.9 | 284.6 | 191.9 |
Jun 2013 | 255.0 | 239.4 | 129.6 | 241.1 | 433.4 | 285.7 | 191.9 |
Jul 2013 | 254.4 | 239.5 | 127.5 | 241.3 | 433.9 | 286.3 | 191.5 |
Aug 2013 | 253.0 | 240.0 | 129.1 | 241.8 | 436.0 | 286.7 | 191.7 |
Sep 2013 | 251.5 | 240.6 | 133.2 | 241.9 | 437.2 | 287.2 | 191.7 |
Oct 2013 | 241.4 | 240.9 | 134.6 | 242.2 | 437.3 | 287.0 | 190.6 |
Nov 2013 | 236.0 | 241.0 | 132.9 | 242.0 | 436.9 | 287.3 | 189.3 |
Dec 2013 | 237.4 | 240.8 | 129.8 | 242.2 | 436.3 | 287.6 | 189.0 |
Source: U.S. Bureau of Labor Statistics. | |||||||
Fortunately, the dramatic energy inflation that was a strong contributor to the difficulties of the 1970s did not continue. From 1983 to 2013, energy inflation was 3 percent annually, barely higher than the 2.9-percent annual increase in the All-Items CPI. (See figures 9 and 10.) Indeed, the prices of food, energy, and all items less food and energy have increased at virtually the same rate over the past three decades, although, of course, energy prices have been more volatile. Other trends that had started earlier persisted: services continued to rise more rapidly in price than commodities, medical care inflation outpaced overall inflation, and apparel prices grew very slowly. (See figure 10.) Both the magnitude of inflation and its volatility were dramatically less than in the 1970s.
The market basket of the CPI in the 1980s was not all that different from the one of today, especially after a major CPI revision introduced new weights in 1986. With that revision, services (including rent) surpassed commodities in the marketplace; services now account for more than 60 percent of the weight of the CPI. The contribution of food to the market basket dropped to around 16 percent in 1986 and is about 14 percent today.
The economy performed better after recovering from the 1982 recession, with the 1980s generally recalled as a prosperous decade. From 1983 to 1985, inflation stayed around the neighborhood of 4 percent. This behavior was an improvement from the 1970s, but still fairly high by historical standards. In 1986, energy prices dropped sharply, falling nearly 20 percent as gasoline prices declined by more than 30 percent. (In December 1986, gasoline prices were about 83 cents per gallon.) The large decrease in gasoline prices temporarily pushed overall inflation down near 1 percent, but when energy prices recovered, inflation returned to about 4 percent per year and then edged a little higher from 1988 to 1990. With the experience of double-digit inflation still fresh, the situation was enough to create tension. “The CPI on the surface looked terrible. When you went into detail, it looked worse,” said one economist in April 1990.53
By late 1990, inflation, as measured by the All-Items CPI, had climbed to 6.3 percent, its highest level since July 1982. An energy spike in the midst of the Gulf War was part of the story, but even excluding food and energy, inflation stood at 5.5 percent. After the end of the Gulf War, a reversal of the rising energy prices contributed to slowing inflation. Another factor was a substantial recession that extended from July 1990 to March 1991. Whatever the reasons, by the beginning of 1992 the All-Items CPI was below 3 percent and the CPI for all items excluding food and energy was below 4 percent. Neither measure has reached its 1990 peak in the more than 20 years since. Inflation, if not “whipped,” as President Ford had sought nearly two decades earlier, seemed to have at least finally been more successfully contained.
The 1990s would prove to be an exceptionally quiet decade. Inflation not only remained modest compared with its behavior in the previous two decades, but was much less volatile.54 The All-Items CPI stayed within the range from 1.4 percent to 3.3 percent from 1992 until 2000 and did not exceed 3.7 percent until 2005.
What might be termed the modern experience of inflation in the United States dates essentially to 1992. Since that time, prices have increased about 2 percent to 3 percent per year (2.4 percent is the average annualized increase), with modest volatility that can be traced mostly to energy price fluctuations. Despite the tumultuous conditions related to the terrorist attacks of September 11, 2001, and to subsequent wars, price change in the first years of the new millennium was very much a continuation of what was happening at the end of the old one. The following tabulation showing the annualized change, taken from annual averages, in selected CPI categories is indicative of just how little prices changed between the last years of the 20th century and the first years of the 21st:
| Group | Subperiod, annualized percent change | |
| 1992–2000 | 2000–2007 | |
| All items | 2.59 | 2.69 |
| Food | 2.48 | 2.75 |
| Food at home | 2.59 | 2.62 |
| Energy | 2.41 | 7.57 |
| Gasoline | 3.32 | 9.19 |
| All items less food and energy | 2.64 | 2.16 |
| Shelter | 3.12 | 3.17 |
| Apparel | -.22 | -1.21 |
| Medical care | 4.03 | 4.34 |
| New vehicles | 1.26 | .67 |
| Commodities | 1.83 | 1.67 |
| Services | 3.18 | 3.4 |
As the tabulation indicates, the all-items index increased at nearly the same rate in the new millennium as the old, with food prices rising at a similar steady pace. The energy index accelerated, led by gasoline prices, but the index for all items less food and energy decelerated modestly as apparel prices fell more quickly and new-vehicle prices rose more sharply. Throughout the entire era, medical care and shelter prices rose more quickly than the overall price level. Inflation in services outpaced that of commodities, with prices of durable goods remaining nearly flat over the whole timespan. Education and tobacco prices also rose sharply during the entire period.
Although a full analysis of monetary policy is beyond the scope of this article, it must be noted that explanations for the reduced inflation since the early 1980s have concentrated on the leadership of the Federal Reserve Board and its monetary policy. Some analysts have argued that, under Paul Volcker and Alan Greenspan, the central banking system focused more strongly on its role in promoting price stability than it had under previous chairmen. The Fed, it is believed, fought inflation with tighter monetary policies and showed a greater willingness to endure recession in order to squeeze inflation out of the economy.
By the late 1980s, economists had formed a new conception about the relationship between inflation and unemployment. Rather than viewing the situation as a tradeoff between inflation and unemployment, a notion that had been discredited by the experience of the 1970s, analysts posited that there was some lowest rate of unemployment which could be achieved that would not cause inflation to accelerate. This rate was the “nonaccelerating inflation rate of unemployment,” or NAIRU.55 There was, of course, some debate over what percentage the NAIRU was, but in the early 1990s estimates centered around 6 percent.56
The late 1990s proved to be the opposite of the 1970s: inflation was modest, even as the economy boomed and unemployment plummeted. Estimates of the NAIRU proved to be too pessimistic (or perhaps the NAIRU changed over time), and the economy demonstrated that it was able to sustain low unemployment without generating inflationary pressure. The unemployment rate sank below 5 percent by 1997 and even below 4 percent by 2000, with inflation excluding food and energy remaining comfortably under 3 percent. This trend continued in the new millennium: a mild recession in the early 2000s pushed the unemployment rate back up, but by the end of 2005 it was again under 5 percent, seemingly without generating inflationary momentum.
Then the Great Recession struck in 2008. As the economy contracted and the unemployment rate soared, gasoline prices took off, reaching an all-time high in July 2008, 37.9 percent higher than a year earlier. This increase helped pull the All-items CPI 12-month change over 5 percent for the first time since 1991. However, gas prices then receded, dropping from $4.14 per gallon in July 2008 to $1.74 per gallon by December, the lowest price since 2004. Together with a weak economy, the falling gasoline prices led the All-Items CPI 12-month change into negative territory in March 2009; it was the first 12-month decrease in the index since 1955. So, the recession was accompanied by price volatility that had not been seen in decades. Social Security recipients, whose cost-of-living adjustments were based on the increase in the CPI, received their largest percent increase in decades in 2009 but then no increase at all in 2010 or 2011.
As the housing sector of the economy weakened, the shelter index, which tended to be stable and for many years had been running above overall inflation, gradually decelerated and eventually declined. The shelter index composed nearly a third of the weight of the All-Items CPI toward the end of the first decade of the 21st century, so the shift was important. The 12-month change in the CPI for all items excluding food and energy fell below 1 percent in 2010, the slowest increase in the index in its entire history, which dates to 1957. The shelter index recovered somewhat as the economy began to emerge from the recession, but it is still increasing more slowly than it did before the recession. Figure 11 shows the 12-month change in both indexes.
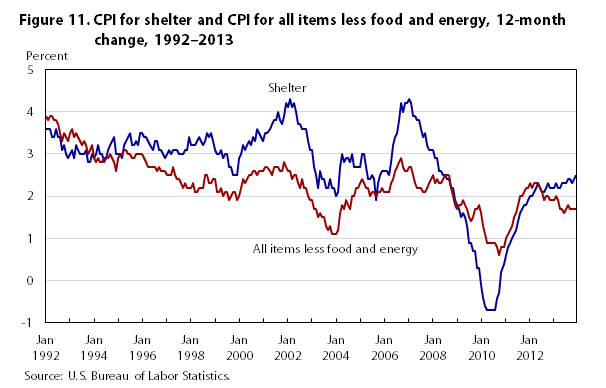
| Month and year | Index | |
|---|---|---|
| Shelter | All items less food and energy | |
Jan 1992 | 3.6 | 3.9 |
Feb 1992 | 3.6 | 3.8 |
Mar 1992 | 3.6 | 3.9 |
Apr 1992 | 3.4 | 3.9 |
May 1992 | 3.4 | 3.8 |
Jun 1992 | 3.6 | 3.8 |
Jul 1992 | 3.4 | 3.7 |
Aug 1992 | 3.4 | 3.5 |
Sep 1992 | 3.1 | 3.3 |
Oct 1992 | 3.2 | 3.5 |
Nov 1992 | 3.0 | 3.4 |
Dec 1992 | 2.9 | 3.3 |
Jan 1993 | 3.0 | 3.5 |
Feb 1993 | 3.1 | 3.6 |
Mar 1993 | 2.9 | 3.4 |
Apr 1993 | 3.2 | 3.5 |
May 1993 | 3.1 | 3.4 |
Jun 1993 | 3.0 | 3.3 |
Jul 1993 | 3.0 | 3.2 |
Aug 1993 | 3.0 | 3.3 |
Sep 1993 | 3.1 | 3.2 |
Oct 1993 | 2.8 | 3.0 |
Nov 1993 | 2.8 | 3.1 |
Dec 1993 | 3.0 | 3.2 |
Jan 1994 | 2.9 | 2.9 |
Feb 1994 | 3.0 | 2.8 |
Mar 1994 | 3.2 | 2.9 |
Apr 1994 | 3.0 | 2.8 |
May 1994 | 3.0 | 2.8 |
Jun 1994 | 2.8 | 2.9 |
Jul 1994 | 2.9 | 2.9 |
Aug 1994 | 3.1 | 2.9 |
Sep 1994 | 3.2 | 3.0 |
Oct 1994 | 3.3 | 2.9 |
Nov 1994 | 3.4 | 2.8 |
Dec 1994 | 3.0 | 2.6 |
Jan 1995 | 3.0 | 2.9 |
Feb 1995 | 3.0 | 3.0 |
Mar 1995 | 2.9 | 3.0 |
Apr 1995 | 3.2 | 3.1 |
May 1995 | 3.3 | 3.1 |
Jun 1995 | 3.4 | 3.0 |
Jul 1995 | 3.5 | 3.0 |
Aug 1995 | 3.2 | 2.9 |
Sep 1995 | 3.2 | 2.9 |
Oct 1995 | 3.3 | 3.0 |
Nov 1995 | 3.2 | 3.0 |
Dec 1995 | 3.5 | 3.0 |
Jan 1996 | 3.5 | 3.0 |
Feb 1996 | 3.4 | 2.9 |
Mar 1996 | 3.4 | 2.8 |
Apr 1996 | 3.3 | 2.7 |
May 1996 | 3.2 | 2.7 |
Jun 1996 | 3.1 | 2.7 |
Jul 1996 | 3.3 | 2.7 |
Aug 1996 | 3.3 | 2.6 |
Sep 1996 | 3.1 | 2.7 |
Oct 1996 | 3.1 | 2.6 |
Nov 1996 | 3.0 | 2.6 |
Dec 1996 | 2.9 | 2.6 |
Jan 1997 | 3.0 | 2.5 |
Feb 1997 | 3.1 | 2.5 |
Mar 1997 | 3.0 | 2.5 |
Apr 1997 | 3.1 | 2.7 |
May 1997 | 3.1 | 2.5 |
Jun 1997 | 3.1 | 2.4 |
Jul 1997 | 3.0 | 2.4 |
Aug 1997 | 3.0 | 2.3 |
Sep 1997 | 3.0 | 2.2 |
Oct 1997 | 3.1 | 2.3 |
Nov 1997 | 3.1 | 2.2 |
Dec 1997 | 3.4 | 2.2 |
Jan 1998 | 3.2 | 2.2 |
Feb 1998 | 3.2 | 2.3 |
Mar 1998 | 3.2 | 2.1 |
Apr 1998 | 3.3 | 2.1 |
May 1998 | 3.4 | 2.2 |
Jun 1998 | 3.3 | 2.2 |
Jul 1998 | 3.2 | 2.2 |
Aug 1998 | 3.3 | 2.5 |
Sep 1998 | 3.5 | 2.5 |
Oct 1998 | 3.4 | 2.3 |
Nov 1998 | 3.5 | 2.3 |
Dec 1998 | 3.3 | 2.4 |
Jan 1999 | 3.1 | 2.4 |
Feb 1999 | 3.0 | 2.1 |
Mar 1999 | 3.0 | 2.1 |
Apr 1999 | 3.1 | 2.2 |
May 1999 | 2.9 | 2.0 |
Jun 1999 | 3.0 | 2.1 |
Jul 1999 | 3.0 | 2.1 |
Aug 1999 | 2.7 | 1.9 |
Sep 1999 | 2.7 | 2.0 |
Oct 1999 | 2.5 | 2.1 |
Nov 1999 | 2.5 | 2.1 |
Dec 1999 | 2.5 | 1.9 |
Jan 2000 | 2.9 | 2.0 |
Feb 2000 | 3.0 | 2.2 |
Mar 2000 | 3.2 | 2.4 |
Apr 2000 | 3.1 | 2.3 |
May 2000 | 3.2 | 2.4 |
Jun 2000 | 3.3 | 2.5 |
Jul 2000 | 3.2 | 2.5 |
Aug 2000 | 3.4 | 2.6 |
Sep 2000 | 3.3 | 2.6 |
Oct 2000 | 3.6 | 2.5 |
Nov 2000 | 3.5 | 2.6 |
Dec 2000 | 3.4 | 2.6 |
Jan 2001 | 3.3 | 2.6 |
Feb 2001 | 3.5 | 2.7 |
Mar 2001 | 3.5 | 2.7 |
Apr 2001 | 3.6 | 2.6 |
May 2001 | 3.7 | 2.5 |
Jun 2001 | 3.8 | 2.7 |
Jul 2001 | 3.8 | 2.7 |
Aug 2001 | 4.0 | 2.7 |
Sep 2001 | 3.8 | 2.6 |
Oct 2001 | 3.7 | 2.6 |
Nov 2001 | 3.9 | 2.8 |
Dec 2001 | 4.2 | 2.7 |
Jan 2002 | 4.1 | 2.6 |
Feb 2002 | 4.3 | 2.6 |
Mar 2002 | 4.1 | 2.4 |
Apr 2002 | 4.2 | 2.5 |
May 2002 | 4.0 | 2.5 |
Jun 2002 | 3.7 | 2.3 |
Jul 2002 | 3.7 | 2.2 |
Aug 2002 | 3.6 | 2.4 |
Sep 2002 | 3.6 | 2.2 |
Oct 2002 | 3.6 | 2.2 |
Nov 2002 | 3.3 | 2.0 |
Dec 2002 | 3.1 | 1.9 |
Jan 2003 | 3.1 | 1.9 |
Feb 2003 | 2.7 | 1.7 |
Mar 2003 | 2.5 | 1.7 |
Apr 2003 | 2.2 | 1.5 |
May 2003 | 2.6 | 1.6 |
Jun 2003 | 2.4 | 1.5 |
Jul 2003 | 2.4 | 1.5 |
Aug 2003 | 2.2 | 1.3 |
Sep 2003 | 2.2 | 1.2 |
Oct 2003 | 2.4 | 1.3 |
Nov 2003 | 2.2 | 1.1 |
Dec 2003 | 2.2 | 1.1 |
Jan 2004 | 2.0 | 1.1 |
Feb 2004 | 2.1 | 1.2 |
Mar 2004 | 2.7 | 1.6 |
Apr 2004 | 3.0 | 1.8 |
May 2004 | 2.8 | 1.7 |
Jun 2004 | 2.9 | 1.9 |
Jul 2004 | 2.9 | 1.8 |
Aug 2004 | 2.8 | 1.7 |
Sep 2004 | 3.0 | 2.0 |
Oct 2004 | 2.7 | 2.0 |
Nov 2004 | 2.7 | 2.2 |
Dec 2004 | 2.7 | 2.2 |
Jan 2005 | 2.7 | 2.3 |
Feb 2005 | 3.0 | 2.4 |
Mar 2005 | 3.0 | 2.3 |
Apr 2005 | 2.7 | 2.2 |
May 2005 | 2.4 | 2.2 |
Jun 2005 | 2.4 | 2.0 |
Jul 2005 | 2.5 | 2.1 |
Aug 2005 | 2.4 | 2.1 |
Sep 2005 | 1.9 | 2.0 |
Oct 2005 | 2.3 | 2.1 |
Nov 2005 | 2.5 | 2.1 |
Dec 2005 | 2.6 | 2.2 |
Jan 2006 | 2.6 | 2.1 |
Feb 2006 | 2.6 | 2.1 |
Mar 2006 | 2.5 | 2.1 |
Apr 2006 | 2.8 | 2.3 |
May 2006 | 3.2 | 2.4 |
Jun 2006 | 3.4 | 2.6 |
Jul 2006 | 3.5 | 2.7 |
Aug 2006 | 3.8 | 2.8 |
Sep 2006 | 4.2 | 2.9 |
Oct 2006 | 4.0 | 2.7 |
Nov 2006 | 4.2 | 2.6 |
Dec 2006 | 4.2 | 2.6 |
Jan 2007 | 4.3 | 2.7 |
Feb 2007 | 4.2 | 2.7 |
Mar 2007 | 3.9 | 2.5 |
Apr 2007 | 3.9 | 2.3 |
May 2007 | 3.8 | 2.2 |
Jun 2007 | 3.8 | 2.2 |
Jul 2007 | 3.6 | 2.2 |
Aug 2007 | 3.4 | 2.1 |
Sep 2007 | 3.5 | 2.1 |
Oct 2007 | 3.2 | 2.2 |
Nov 2007 | 3.1 | 2.3 |
Dec 2007 | 3.1 | 2.4 |
Jan 2008 | 3.1 | 2.5 |
Feb 2008 | 2.9 | 2.3 |
Mar 2008 | 2.9 | 2.4 |
Apr 2008 | 2.6 | 2.3 |
May 2008 | 2.6 | 2.3 |
Jun 2008 | 2.5 | 2.4 |
Jul 2008 | 2.5 | 2.5 |
Aug 2008 | 2.4 | 2.5 |
Sep 2008 | 2.4 | 2.5 |
Oct 2008 | 2.2 | 2.2 |
Nov 2008 | 2.2 | 2.0 |
Dec 2008 | 1.9 | 1.8 |
Jan 2009 | 1.8 | 1.7 |
Feb 2009 | 1.7 | 1.8 |
Mar 2009 | 1.5 | 1.8 |
Apr 2009 | 1.6 | 1.9 |
May 2009 | 1.5 | 1.8 |
Jun 2009 | 1.3 | 1.7 |
Jul 2009 | .9 | 1.5 |
Aug 2009 | .9 | 1.4 |
Sep 2009 | .7 | 1.5 |
Oct 2009 | .7 | 1.7 |
Nov 2009 | .3 | 1.7 |
Dec 2009 | .3 | 1.8 |
Jan 2010 | -.1 | 1.6 |
Feb 2010 | -.4 | 1.3 |
Mar 2010 | -.6 | 1.1 |
Apr 2010 | -.7 | .9 |
May 2010 | -.7 | .9 |
Jun 2010 | -.7 | .9 |
Jul 2010 | -.7 | .9 |
Aug 2010 | -.7 | .9 |
Sep 2010 | -.4 | .8 |
Oct 2010 | -.3 | .6 |
Nov 2010 | .2 | .8 |
Dec 2010 | .4 | .8 |
Jan 2011 | .6 | 1.0 |
Feb 2011 | .8 | 1.1 |
Mar 2011 | .9 | 1.2 |
Apr 2011 | 1.0 | 1.3 |
May 2011 | 1.1 | 1.5 |
Jun 2011 | 1.2 | 1.6 |
Jul 2011 | 1.4 | 1.8 |
Aug 2011 | 1.6 | 2.0 |
Sep 2011 | 1.7 | 2.0 |
Oct 2011 | 1.8 | 2.1 |
Nov 2011 | 1.8 | 2.2 |
Dec 2011 | 1.9 | 2.2 |
Jan 2012 | 2.0 | 2.3 |
Feb 2012 | 2.0 | 2.2 |
Mar 2012 | 2.1 | 2.3 |
Apr 2012 | 2.2 | 2.3 |
May 2012 | 2.3 | 2.3 |
Jun 2012 | 2.2 | 2.2 |
Jul 2012 | 2.1 | 2.1 |
Aug 2012 | 2.1 | 1.9 |
Sep 2012 | 2.2 | 2.0 |
Oct 2012 | 2.3 | 2.0 |
Nov 2012 | 2.2 | 1.9 |
Dec 2012 | 2.2 | 1.9 |
Jan 2013 | 2.2 | 1.9 |
Feb 2013 | 2.3 | 2.0 |
Mar 2013 | 2.2 | 1.9 |
Apr 2013 | 2.2 | 1.7 |
May 2013 | 2.3 | 1.7 |
Jun 2013 | 2.3 | 1.6 |
Jul 2013 | 2.3 | 1.7 |
Aug 2013 | 2.4 | 1.8 |
Sep 2013 | 2.4 | 1.7 |
Oct 2013 | 2.3 | 1.7 |
Nov 2013 | 2.4 | 1.7 |
Dec 2013 | 2.5 | 1.7 |
Source: U.S. Bureau of Labor Statistics. | ||
During the recession, much of the attention of the public and policymakers was focused on jobs but prices also generated fears: fears of a return to the depression-era deflation, fears that the United States might go down the same path it had gone down in the 1930s, and fears that the nation might experience a “lost decade,” as was believed that Japan had recently suffered amid persistent deflation. Peter Goodman summarized the issues in a typical story in October 2008:57
The end of inflation may be the beginning of something malevolent: a long, slow retrenchment in which consumers and businesses worldwide lose the wherewithal to buy, sending prices down for many goods. Though still considered unlikely, that would prompt businesses to slow production and accelerate layoffs, taking more paychecks out of the economy and further weakening demand.
As things turned out, the All-items CPI would become negative several months later, but the downturn was due mostly to energy prices plummeting from the new highs they had reached. Excluding energy, the All-Items CPI never fell below 0.7 percent.
In contrast, as stimulative fiscal and monetary policies were applied to the recession-plagued economy, fears arose that these policies would eventually lead to a return of dangerous inflation. “Gold Hits Record Highs as Dollar Sinks and Inflation Fears Revive” was a typical headline of the time.58 Debates raged between those who saw inflation as an inevitable outcome of the policies and those who thought such fears overblown. The anticipated inflation has not emerged—at least, not yet: the All-Items CPI remained under 2 percent in 2012 and 2013.
One thing that has been absent in the modern era of U.S. inflation is the application of broad price controls. The reason may be simply that inflation generally is lower and less volatile, or it may be that such policies have lost favor on the basis of their dubious reputation in economics or perhaps in part because they were perceived as unsuccessful during the Nixon era. In any case, this long absence of controls has been the exception in the nation’s inflation experience, not the rule.
Some durable goods trends have emerged in the recent U.S. inflation experience: slow price growth of apparel and durable goods, and faster growth of services in medical care. Also, despite their greater volatility, food and energy prices appear to increase at about the same rate as other prices in the long run.
What is the takeaway, then, from the U.S. inflation experience of the past 100 years? Certain truths seem constant over almost the whole timespan: energy prices are the most volatile of all prices of commodities and services, both policymakers and the public alternately fret over inflation (most of the time) and deflation, and activist policies aimed at directly controlling prices were a regular feature of the nation’s economy until the last few decades.
As the CPI enters its second century, inflation, along with unemployment, remains one of the two economic indicators that receive the most attention from the public and, perhaps as a result, from policymakers. Still, despite the nearly omnipresent fears of both deflation and renewed inflation, the behavior of prices in the United States since the early 1990s has been dramatically closer to what policymakers proclaim as their goal than at any other time in the 100 years examined in this article. Whether this is simply a fortunate era or whether there has been some permanent improvement in the ability of the economy and its policymakers to achieve greater price stability will perhaps remain an unanswerable question.
Stephen B. Reed, "One hundred years of price change: the Consumer Price Index and the American inflation experience," Monthly Labor Review, U.S. Bureau of Labor Statistics, April 2014, https://doi.org/10.21916/mlr.2014.14
1 “Raise meat animals, housewives advise,” The New York Times, March 15, 1913.
2 “Four food staples decline in price,” The New York Times, June 22, 1913.
3 “Wilson’s figures wrong, he’s told,” The New York Times, March 2, 1914.
4 The Consumer Price Index: history and techniques, Bulletin No. 1517 (U.S. Bureau of Labor Statistics, 1966), p. 2.
5 Lawrence H. Officer, “What was the Consumer Price Index then? A data study,” see especially p. 21, http://www.measuringworth.com/docs/cpistudyrev.pdf.
6 Retail prices: 1913 to December, 1921, Bulletin No. 315 (U.S. Bureau of Labor Statistics, 1923), http://fraser.stlouisfed.org/docs/publications/bls/192301_bls_315.pdf. (See also Robert A. Sayre, Consumers’ prices, 1914–1948 (New York: National Industrial Conference Board, 1948).
7 Hugh Rockoff, “Until it’s over, over there: the U.S. economy in World War I,” Working Paper No. 10580 (Cambridge, MA, National Bureau of Economic Research, 2004), p. 2, http://www.nber.org/papers/w10580.
8 Eugene Rotwein, “Post–World War I price movements and price policy,” Journal of Political Economy, September 1945, pp. 234–235.
9 Lewis H. Haney, “Price fixing in the United States during the War I,” Political Science Quarterly, March 1919, p. 120.
10 Rockoff, p. 32.
11 Ibid., p. 9.
12 Rotwein, p. 238.
13 Ibid., p. 247.
14 “Compel 5 dealers to lower prices,” The New York Times, Sept. 9, 1919.
15 Retail prices, December 1934 (U.S. Bureau of Labor Statistics, 1935).
16 “Shape store plans for holiday trade; more confidence now shown in respect to outlook, comments indicate,” The New York Times, November 8, 1931.
17 E. E. Agger, “Inflation and deflation,” letter to the editor, The New York Times, February 22, 1923.
18 Franklin D. Roosevelt, “Statement on signing the National Industrial Recovery Act,” June 16, 1933, in Gerhard Peters and John T. Woolley, The American Presidency Project (Santa Barbara, CA: University of California, 1999–2014), https://www.presidency.ucsb.edu/documents/statement-signing-the-national-industrial-recovery-act.
19Leverett S. Lyon, The National Recovery Administration: an analysis and appraisal (Washington, DC: Brookings Institution, 1935).
20 Christina D. Romer, “Why did prices rise in the 1930s?” The Journal of Economic History, March 1999, pp. 167–199.
21 Ibid.
22 Jonathan Hughes, The vital few: the entrepreneur and American economic progress (New York: Oxford University Press, 1986), p. 539.
23 See BLS handbook of labor statistics (U.S. Bureau of Labor Statistics, 1973), p. 287.
24 America on the homefront: selected World War II records of federal agencies in New England, section I: “Rationing and controlling prices” (Boston: National Archives at Boston), http://www.archives.gov/boston/exhibits/homefront/#prices.
25 Paul Evans, “The effects of general price controls in the United States during World War II,” Journal of Political Economy, October, 1982, p. 944.
26 See the photo from the OPA archives, http://www.archives.gov/boston/exhibits/homefront/1.11-egg-prices.pdf.
27 Faith M. Williams, “Bureau of Labor Statistics Cost-of-Living Index in wartime,” Monthly Labor Review, July 1943, pp. 82–100; see especially p. 84.
28 Consumers’ prices in the United States, 1942–48, Bulletin 966 (U.S. Bureau of Labor Statistics, 1949), p. 3.
29 Ibid., p. 3.
30 Consumer prices in the United States, 1949–52 price trends and indexes, Bulletin No. 1165. (U.S. Bureau of Labor Statistics, 1954), p. 1.
31 Ibid., p. 32. Changes in major groups are calculated from the pre-1953 series, which was revised that year.
32 Benjamin Caplan, “A case study: the 1948–1949 recession,” in Policies to combat depression: a conference of the Universities-National Bureau Committee for Economic Research (Princeton, NJ: Princeton University Press, 1956), pp. 27–58, http://www.nber.org/chapters/c2798.
33 Consumer prices in the United States, 1949–52, p. 11.
34 Or, as it was officially termed at the time, a “police action.”
35 From Retail prices of food 1955–56, Bulletin 1217 (U.S. Bureau of Labor Statistics, 1957).
36 From Average retail prices 1955, Bulletin 1197 (U.S. Bureau of Labor Statistics, June 1956).
37 David Frum, How we got here: the ’70s (New York: Basic Books, 2000), p. 296.
38 Retail prices of food 1957–58, Bulletin 1254 (U.S. Bureau of Labor Statistics 1959), p. 8.
39 “The shadow of inflation,” The New York Times, August 25, 1956.
40 Joseph A. Loftus, “Threat of inflation shadows the economy,” The New York Times, September 2, 1956, p. E7.
41 Edwin L. Dale, Jr., “Government concern over inflation rises,” The New York Times, August 30, 1959, p. E6.
42 Edwin L. Dale, Jr. , “Johnson voices inflation fear,” The New York Times, May 10, 1964, p. E6.
43 Christina Romer, “Commentary,” Federal Reserve Bank of St. Louis Review, March/April 2005, part 2, pp. 177–178, http://research.stlouisfed.org/publications/review/05/03/part2/Romer.pdf.
44 For a thorough discussion of inflationary pressures from 1957 to 1968, see Norman Bowsher, “1968—year of inflation,” Federal Reserve Bank of St. Louis Review, December 1968, pp. 3–14, http://research.stlouisfed.org/publications/review/68/12/Inflation_Dec1968.pdf.
45 “Recession-cum-inflation,” editorial, The New York Times, November 3, 1974.
46 “Though farm aid pledged, food price cuts unlikely” and “Businesses to feel heat from price fix legislation,” Watertown Daily Times, October 9, 1974, p. 7.
47 Jimmy Carter, “Anti-inflation program,” Vital Speeches of the Day, November 15, 1978, pp. 66–69.
48 Ibid.
49 “Jimmy Carter, “Crisis of confidence,” speech presented on television, July 15, 1979, http://www.pbs.org/wgbh/americanexperience/features/primary-resources/carter-crisis.
50 “Examining Carter’s “malaise speech,” 30 years later,” heard on National Public Radio July 12, 2009, http://www.npr.org/templates/story/story.php?storyId=106508243.
51 Before 1983, The CPI housing measure included a measure of the cost of mortgage interest, so mortgage interest rates directly affected the CPI in a way they have not since 1982.
52 See Robert D. Hershey, Jr., “Inflation at 13.3 percent? What is this rapacious thing?” The New York Times, February 3, 1980, p. F1.
53 Allen R. Myerson, “Business diary: April 15–20,” The New York Times, April 22, 1990, http://www.nytimes.com/1990/04/22/business/business-diary-april-15-20.html?pagewanted=all&src=pm.
54 See N. Gregory Mankiw, “U.S. monetary policy in the 1990s,” NBER Working Paper 8471 (Cambridge, MA: National Bureau of Economic Research, September 2001),p. 9, http://www.nber.org/papers/w8471. Mankiw showed that inflation in the 1990s had a lower standard deviation than it had in previous decades.
55 For a full discussion of the NAIRU and its history in the United States, see Laurence Ball and N. Gregory Mankiw, “The NAIRU in theory and practice,” Journal of Economic Perspectives, Fall 2002, pp. 115–136.
56 See Jared Bernstein and Dean Baker, “The unemployment rate at full employment: how low can you go?” Economix: explaining the science of everyday life, November 20, 2013, http://economix.blogs.nytimes.com/2013/11/20/the-unemployment-rate-at-full-employment-how-low-can-you-go/?_php=true&_type=blogs&_r=0.
57 Peter S. Goodman. “Fear of deflation lurks as global demand drops,” The New York Times, November 1, 2008, p. A1, http://www.nytimes.com/2008/11/01/business/economy/01deflation.html?pagewanted=all.
58 Tom Petruno, “Gold hits record highs as dollar sinks and inflation fears revive,” The Los Angeles Times, October 6, 2009, http://latimesblogs.latimes.com/money_co/2009/10/the-new-gold-rushis-on--the-metal-soared-to-record-highs-early-today-fueled-by-fresh-fears-that-the-dollars-status-as-the-w.html.