
An official website of the United States government
An official website of the United States government
The .gov means it's official.
Federal government websites often end in .gov or .mil. Before sharing sensitive information,
make sure you're on a federal government site.
The site is secure.
The
https:// ensures that you are connecting to the official website and that any
information you provide is encrypted and transmitted securely.

Crossref 0
Policy steps in the federal budget and health care to achieve sustainable fiscal conditions in the U.S., Journal of Policy Modeling, 2024.
The Industry Productivity Studies (IPS) program of the Bureau of Labor Statistics (BLS) has developed a new index of labor productivity, defined as output per hour, for private community hospitals. This labor productivity index relies upon volume-based measures of hospital services, which are separated into outpatient visits and inpatient courses of treatment.
Health care, one of the largest sectors of the U.S. economy, accounted for 12.9 percent of all nonfarm payroll employment in 2012.1 That same year, hospitals accounted for 35.7 percent of gross output in the health care sector2 and employed approximately 4.7 million workers.3 The number of hospital workers is expected to increase by more than 15 percent in the next decade.4 As employment in this industry continues to grow, it is important to measure labor productivity—the efficiency with which hospital workers provide services.
Despite the size and importance of hospitals in the U.S. economy, an official Bureau of Labor Statistics (BLS) measure of labor productivity has not been available in the past. While the Industry Productivity Studies (IPS) program publishes labor hours for hospitals, output measures had not previously been developed. This is due to the complex nature of the services that hospitals provide and the difficulty of measuring these services in a single index of output. Responding to this need, IPS has developed a new measure of labor productivity for community hospitals.5 This article details the data sources and methods used to measure output (typically the most difficult aspect of productivity measurement) and introduces a final measure of labor productivity. According to this new measure, output for community hospitals grew at an average annual rate of 2.1 percent from 1993 to 2012, and labor productivity grew at a rate of 0.5 percent over the same period.
Defining and measuring hospital output poses many challenges. Like most service industries, the hospital industry provides many different types of services—from relatively simple diagnostic x-rays to incredibly complex open-heart surgeries. But what is the best way to define and measure these different services?
For most of the service industries measured by IPS, output is calculated with a deflated revenue model. In this model, constant-dollar revenues serve as a proxy for volume of output. However, this approach is not well suited to the hospital industry because transactions are not conducted within a single-price, perfectly competitive market. Patients pay different prices based upon their payment methods and are generally unaware of the relevant pricing structures. Additionally, the hospital service providers direct the transactions due to either patient incapacitation or a lack of medical knowledge. Because prices do not reflect marginal costs in the hospital industry, the output derived from deflated values is likely to be highly distorted.
To address the problems with deflated-value output in this industry, IPS developed and analyzed two volumetric output concepts—one based on the number of procedures and the other based on the number of complete treatments administered.6 Both concepts measure output via a physical count of services provided. The output concept based on the number of procedures was rejected on the grounds that hospitals, rather than consumers, direct the number of procedures. IPS concluded that the volume-based “course of treatment model” was superior because it best answers the question, “What services are being demanded by a patient?” For hospitals, the patient is purchasing the treatment of a specific health problem. The course of treatment model also aligns with the Organization for Economic Co-operation and Development (OECD) recommendation which states, “The target definition of health care volume output . . . is the number of complete treatments with specified bundles of characteristics so as to capture quality change and new products.”7
As noted by the OECD, an ideal measure of hospital services would account for the outcome of the treatment itself. Patients seek to have their ailment cured or, at least, alleviated. Therefore, unsuccessful treatments are fundamentally different from those which result in a cure or alleviation. Positive outcomes offer the best indicator of service quality, followed by expediency and comfort.
Currently, the only available patient-level outcome statistic is the inpatient mortality rate. For patients who live, there is no information on whether they were completely cured, had their health somewhat improved, or were discharged unimproved, with the same illness. While it is possible to incorporate mortality data into industry output measures,8 doing so is of questionable value because it is often not possible to determine whether the hospital is directly responsible for a patient’s death. Numerous factors outside the hospital’s control, such as prior health of the patient, the patient’s adherence to treatment, and random chance can affect outcomes. These outside factors must be taken into account in order to isolate the hospital’s role. For these reasons, the IPS output index does not account for either the outcome or the quality of treatment. Hospital output is defined as the treatment of disease, rather than the cure of disease.
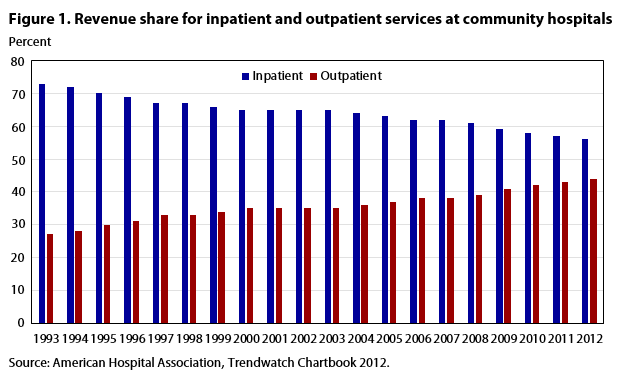
The IPS program separates hospital services into two general categories—outpatient services and inpatient services. This distinction is necessary because the measurement of “complete treatments” differs for outpatient and inpatient treatments. Outpatient treatments are “complete” by definition. These are services, such as x-rays or noninvasive surgeries, that do not require an overnight stay. Inpatient treatments, on the other hand, require an overnight stay of 1 or more days and may include several different services, such as diagnostic tests, major surgical procedures, monitoring, and room and board. The individual services for inpatients do not constitute “complete treatments”; rather, treatment is “complete” when the patient is discharged from the hospital. Additionally, statistics for inpatient and outpatient services are produced by different federal programs. Outpatient services have become increasingly prominent, accounting for 44 percent of total hospital revenue in 2012, up from 27 percent in 1993.9 (See figure 1.)
| Year | Inpatient revenue | Outpatient revenue | |
|---|---|---|---|
| 1993 | 0.73 | 0.27 | |
| 1994 | .72 | .28 | |
| 1995 | .70 | .30 | |
| 1996 | .69 | .31 | |
| 1997 | .67 | .33 | |
| 1998 | .67 | .33 | |
| 1999 | .66 | .34 | |
| 2000 | .65 | .35 | |
| 2001 | .65 | .35 | |
| 2002 | .65 | .35 | |
| 2003 | .65 | .35 | |
| 2004 | .64 | .36 | |
| 2005 | .63 | .37 | |
| 2006 | .62 | .38 | |
| 2007 | .62 | .38 | |
| 2008 | .61 | .39 | |
| 2009 | .59 | .41 | |
| 2010 | .58 | .42 | |
| 2011 | .57 | .43 | |
| 2012 | .56 | .44 | |
| Source: American Hospital Association, Trendwatch Chartbook 2012. | |||
The inpatient and outpatient services that compose hospital activity can be aggregated into a single index of output, using revenue shares as weights. Each inpatient discharge and outpatient visit is assigned a disease and associated cost. Annual changes in the quantity of each disease is weighted by its share in the total value of output. Therefore, those diseases that contribute more to total revenue are given a greater weight in the overall output index.
The Nationwide Inpatient Sample (NIS) is the largest all-payer inpatient care database in the United States. It contains patient discharge data, including information on health care costs and utilization, and provides an excellent source for measuring output for inpatient stays. Since 1993,10 private hospital inpatient discharges have been calculated by applying nationally representative weights to the discharges recorded in the NIS. Because the NIS contains discharge-level records, rather than patient-level records, individual patients who are hospitalized more than once in a single year may appear in the NIS multiple times.
Each discharge is assigned a Diagnosis-Related Group (DRG) that corresponds to both the primary condition being treated and the associated bundle of procedures and services used during treatment. These treatment bundles correspond to differing amounts of hospital resource utilization. A single charge is reported for the complete stay, and this charge is converted to hospital costs using ratios developed by the Agency for Healthcare Research and Quality (AHRQ).
The DRG system, the primary system for classifying hospital discharges, was developed by the Center for Medicare and Medicaid Services (CMS). It offers a uniform payment system for Medicare and Medicaid patients across the United States.11 With this approach, an inpatient output index is constructed by assigning each patient a single DRG with one corresponding charge, as opposed to a set of multiple procedures or diagnoses with multiple charges. The classification of diagnoses in the DRG system is updated annually to include more specific types of ailments, as well as differing levels of severity. New DRGs are also assigned for substantial advances in medical treatment.12 The DRG system allows IPS to classify inpatient services by complete treatments with specific bundles of characteristics.
Another aspect of the DRG system is that it differentiates patients with secondary pathologies, often called “co-morbidities.” These patients pose a problem because their multiple courses of treatment are not recorded separately in the NIS. However, separate diagnosis groups have been created to account for cases where there are serious complications or co-morbidities. The DRGs that include complications and co-morbidities tend to have higher average costs and charges, thereby contributing more weight to the overall inpatient index.
The total number of inpatient discharges in each DRG category are aggregated (using the Tornqvist formula) into a single quantity index of inpatient output with weights based on each DRG’s share of total cost:
where
It/It-1 = the ratio of inpatient output in the current year (t) to the previous year (t-1),
n = the number of DRGs
ln (iDRG,t/iDRG,t-1) = the natural logarithm of the ratio of the number of inpatient stays for each DRG in the current year to the number in the previous year, and
wDRG,t = the average value share weight for each DRG over the current year (t) and the previous year (t-1).
To get total inpatient values, the number of inpatient treatments for each DRG is multiplied by their average cost or charge. Based on these values, relative weights are derived by dividing the total value for each DRG category in a given year by the sum of values for all DRGs that year.
Since 2001, average cost data have been used for weighting. Because cost data are unavailable for earlier years, charge data are used for that period. Cost refers to the dollar amount incurred by a hospital to provide services. Charge refers to the final amount on a patient’s bill. Costs are not subject to external market forces, thus making them a more accurate measure of the value of an inpatient stay than charges. For specific years where cost data are unavailable, charge data are an acceptable proxy because, presumably, the value of hospital resources used to provide inpatient services is the primary factor that determines the final charge. Hospital cost data, as calculated by the AHRQ, differs from charge data on the basis of the hospital providing service, rather than on the basis of the DRG. Therefore, the relative cost share weights among DRGs are practically equivalent to the corresponding relative charge share weights, and there is no discontinuity in the time series data.
The number of outpatient visits from the American Hospital Association (AHA) Chartbook serves as the basis of the physical quantity measure of outpatient services.13 The AHA defines an outpatient visit as follows:
[A] visit by a patient not lodged in the hospital while receiving medical, dental, or other services. Each visit an outpatient makes to a discrete unit constitutes one visit regardless of the number of diagnostic and/or therapeutic treatments that the patient receives. Total outpatient visits should include all clinic visits, referred visits, observation services, outpatient surgeries, and emergency room visits.14
The National Hospital Ambulatory Medical Care Survey (NHAMCS) offers a more detailed representation of outpatient visits. This survey is a product of the Centers for Disease Control and Prevention (CDC) National Center for Health Statistics (NCHS), and provides nationally representative estimates of diagnoses and patterns of use of emergency and outpatient services in U.S. hospitals.15 NHAMCS data are used for calculating ratios of outpatient visits for each major disease category relative to total outpatient visits. Major disease categories correspond to particular organ systems, as well as injuries, accidents, and poisonings (conditions that are commonly treated in emergency departments). Total outpatient visits for each major disease category are obtained by applying the NHAMCS ratios to the AHA totals.
The number of visits for each major disease category are matched with corresponding charge data from CMS. CMS compiles billing data for hospital outpatient visits that are covered by Medicare and Medicaid, including the total number of outpatient visits and the associated charges for each of the more than 900 ICD-9-CM categories.16 The total visits and charges for individual ICD-9-CM categories are aggregated to the 15 major disease groupings. Total charges are divided by the number of visits for each respective major disease category to obtain an average charge per outpatient visit. Average charges are then multiplied by the number of outpatient visits calculated using data from AHA and CDC. The resulting values are used to derive weights for combining the quantities of various outpatient visits:17
where
Ot/Ot-1 = the ratio of outpatient output in the current year (t) to the previous year (t-1),
n = the number of major disease categories (15)
ln (oMDC,t/oMDC,t-1) = the natural logarithm of the ratio of the number of outpatient visits for each major disease category (MDC) in the current year to the number in the previous year, and
wMDC,t = the average value share weight for each MDC over the current year (t) and the previous year (t-1).
A potential problem with this approach is the lack of a representative patient sample. Because Medicare and Medicaid charges represent treatment to a subset of the population (the elderly and the poor), it is possible that using these charges alone may introduce some bias to the outpatient measure. However, as with the charge data used to weight inpatient services, the value of hospital resources used to provide the outpatient services is thought to be the primary factor influencing these charges. Therefore, we assume that shares for each major disease category calculated from the CMS data are similar to corresponding shares for the general population. The various quantities of outpatient visits are combined into a single outpatient index, with their associated share of the total nationwide value used as weights.
The independently constructed indexes of inpatient services and outpatient services are combined to create a total output index for private hospitals. Average share weights for inpatient and outpatient services are calculated using the percentages of inpatient and outpatient gross revenue published in the AHA’s Trendwatch report.18 Again, relative costs to provide services would be the preferable method for weighting, but such data are unavailable for outpatient services. The AHA revenue data place outpatient and inpatient services on the same basis. Such data are, therefore, of value in determining the relative importance of each with respect to overall hospital activities.
The growth rate of hospital output is derived as a weighted aggregation (using the Tornqvist formula) of the growth rates of inpatient and outpatient services:
where
A = output index for community hospitals,
I = Inpatient input,
O = Outpatient input, and
wi, wo = value share weights.
For our purposes, labor input refers to BLS estimates for the total number of hours worked in community hospitals during the year. Total hours is equal to the sum of hours worked by supervisory workers and nonsupervisory workers in North American Industry Classification System (NAICS) 6221 (General medical and surgical hospitals) and NAICS 6223 (Specialty, except psychiatric and substance abuse, hospitals).19 Annual hours for workers in each category are calculated by multiplying total weekly hours (employment times average weekly hours) by 52 (the number of weeks in a year).
The Current Employment Statistics program publishes employment data for all employees and nonsupervisory workers, along with average weekly hours for nonsupervisory workers. To estimate hours for supervisory workers, ratios of average weekly hours for supervisory workers relative to those of nonsupervisory workers are estimated using data from the Current Population Survey. These ratios are applied to average weekly hours for nonsupervisory workers.20 Hours paid are converted to hours worked using ratios derived from the National Compensation Survey.
Both total employment and total hours worked in community hospitals have seen continuous growth between 1993 and 2012. Over this period, community hospitals have added over a million new employees, and hours have increased by an average of 1.6 percent per year.
| Year | Inpatient | Outpatient | Total output |
|---|---|---|---|
| 1993 | 100.0 | 100.0 | 100.0 |
| 1994 | 99.8 | 103.0 | 100.7 |
| 1995 | 105.2 | 111.9 | 107.1 |
| 1996 | 105.9 | 120.6 | 110.0 |
| 1997 | 107.8 | 120.0 | 111.2 |
| 1998 | 109.1 | 127.2 | 114.3 |
| 1999 | 113.4 | 133.6 | 119.2 |
| 2000 | 113.9 | 142.0 | 122.1 |
| 2001 | 118.2 | 146.5 | 126.4 |
| 2002 | 118.9 | 149.5 | 127.8 |
| 2003 | 121.3 | 151.5 | 130.1 |
| 2004 | 122.5 | 154.6 | 131.8 |
| 2005 | 124.5 | 156.9 | 134.0 |
| 2006 | 127.3 | 162.7 | 137.7 |
| 2007 | 125.1 | 164.6 | 136.8 |
| 2008 | 128.5 | 169.1 | 140.5 |
| 2009 | 127.5 | 173.8 | 141.4 |
| 2010 | 125.5 | 179.6 | 142.0 |
| 2011 | 130.4 | 182.9 | 146.3 |
| 2012 | 128.3 | 191.0 | 147.7 |
| Source: U.S. Bureau of Labor Statistics, Industry Productivity Studies. | |||
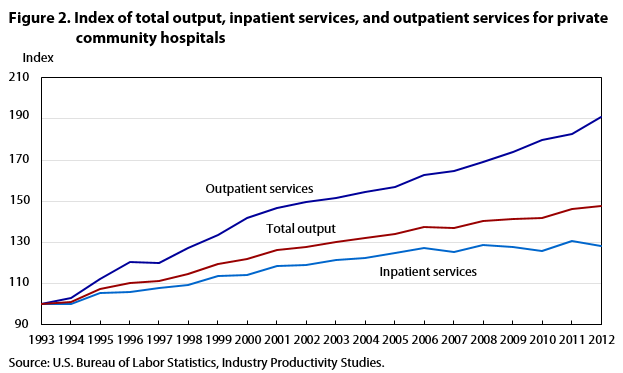
From 1993 to 2012, the output of community hospitals grew at an average annual rate of 2.1 percent; there was positive year-to-year growth every year, except in 2007. The index of outpatient services rose by an average of 3.5 percent annually, while inpatient services grew by 1.3 percent annually over this time period. Starting in 1993, outpatient services experienced 20 years of almost continuous yearly growth. However, this trend is not replicated for inpatient services. From 1993 through 2006, inpatient services grew by an average annual rate of 1.9 percent. But in the years since, inpatient services growth has slowed significantly. From 2006 to 2012, the growth rate was a mere 0.1 percent. (See figure 2.)
| Year | Total employment | Labor hours | |
|---|---|---|---|
| 1993 | 100.0 | 100.0 | |
| 1994 | 99.6 | 100.2 | |
| 1995 | 100.1 | 100.0 | |
| 1996 | 101.2 | 100.7 | |
| 1997 | 102.7 | 103.1 | |
| 1998 | 104.7 | 105.3 | |
| 1999 | 106.0 | 105.8 | |
| 2000 | 106.5 | 107.0 | |
| 2001 | 109.3 | 110.0 | |
| 2002 | 112.0 | 112.7 | |
| 2003 | 114.3 | 117.4 | |
| 2004 | 115.4 | 119.9 | |
| 2005 | 117.1 | 123.6 | |
| 2006 | 119.1 | 125.5 | |
| 2007 | 121.7 | 128.9 | |
| 2008 | 124.6 | 132.3 | |
| 2009 | 125.6 | 131.1 | |
| 2010 | 126.0 | 131.1 | |
| 2011 | 126.6 | 133.5 | |
| 2012 | 128.2 | 134.2 | |
| Source: U.S. Bureau of Labor Statistics, Industry Productivity Studies. | |||
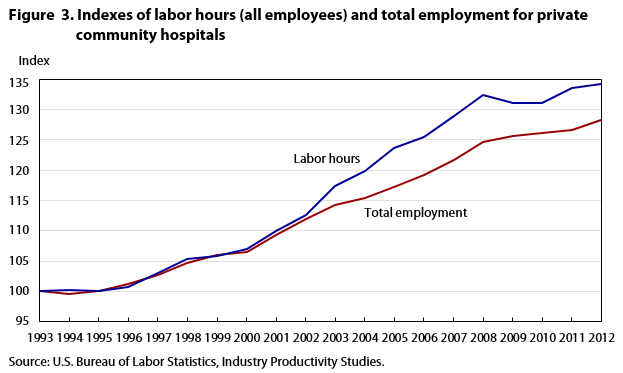
Labor hours increased at an average annual rate of 1.6 percent from 1993 to 2012, while total employment grew by 1.3 percent. These indexes moved in tandem from 1993 to 2002. From 2003 to 2008, the number of hours worked increased by an average of 2.4 percent per year while employment increased by only 1.7 percent. This indicates that employees began to work more hours per year over that time period. From 2008 to 2012, average annual growth has been modest for both hours worked (0.4 percent) and employment (0.7 percent). (See figure 3.)
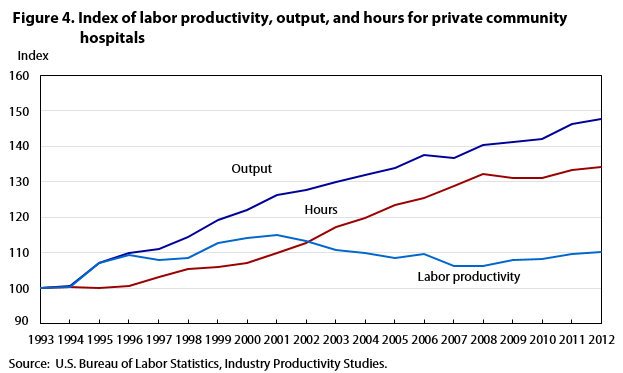
Labor productivity is determined by dividing the index of output by the index of labor hours. From 1993 through 2012, hospital output has grown at a faster rate than hours, resulting in average annual growth of 0.5 percent for labor productivity. A closer look at the index reveals that labor productivity increased through 2001, and declined thereafter. From 2001 to 2012, labor productivity decreased by an average of 0.4 percent annually. (See figure 4.)
| Year | Output | Hours | Labor productivity |
|---|---|---|---|
| 1993 | 100.0 | 100.0 | 100.0 |
| 1994 | 100.7 | 100.2 | 100.4 |
| 1995 | 107.1 | 100.0 | 107.1 |
| 1996 | 110.0 | 100.7 | 109.3 |
| 1997 | 111.2 | 103.1 | 107.8 |
| 1998 | 114.3 | 105.3 | 108.6 |
| 1999 | 119.2 | 105.8 | 112.6 |
| 2000 | 122.1 | 107.0 | 114.1 |
| 2001 | 126.4 | 110.0 | 115.0 |
| 2002 | 127.8 | 112.7 | 113.4 |
| 2003 | 130.1 | 117.4 | 110.8 |
| 2004 | 131.8 | 119.9 | 110.0 |
| 2005 | 134.0 | 123.6 | 108.4 |
| 2006 | 137.7 | 125.5 | 109.7 |
| 2007 | 136.8 | 128.9 | 106.1 |
| 2008 | 140.5 | 132.3 | 106.2 |
| 2009 | 141.4 | 131.1 | 107.9 |
| 2010 | 142.0 | 131.1 | 108.4 |
| 2011 | 146.3 | 133.5 | 109.6 |
| 2012 | 147.7 | 134.2 | 110.1 |
| Source: U.S. Bureau of Labor Statistics, Industry Productivity Studies. | |||
A number of factors have contributed to the decline in hospital labor productivity since 2001. As technology, pharmacology, and medical science have improved, many conditions that once required hospitalization can now be treated on an outpatient basis. As seen in figures 1 and 2, the volume of outpatient treatments has grown significantly over the period studied. This trend generally serves to increase labor productivity in hospitals, as fewer labor hours are required to treat patients on an outpatient basis. However, the rise in outpatient procedures has not been confined to the hospital industry. Such treatments are administered in physicians’ offices (NAICS 6211), ambulatory care centers (NAICS 6214), and even at home (NAICS 6216).21 Hospitals see no productivity gains when outpatients are treated in other facilities.
In general, outpatients require fewer resources for treatment than do inpatients, and therefore receive less weight in the overall output index. Shifts between outpatient and inpatient treatments therefore impact the labor productivity index through the influence of their relative weights. As a certain percentage of patients shift from inpatient to outpatient care, the remaining inpatients are given a greater relative weight in the output measure. This weighting effect is further magnified by the fact that the cases still being treated as inpatients are increasingly those with the most serious health conditions.
One way of quantifying the level of sickness of patients is the presence of multiple chronic conditions (MCC). According to the Healthcare Cost and Utilization Project (HCUP), the percentage of inpatients with MCC has been steadily increasing, from 63.5 percent in 2003 to a projected 78.1 percent in 2014.22 These patients have more than one long-term illness and require additional resources. HCUP reports that “patients with MCC had higher in-hospital mortality rates, longer lengths of stay in the hospital, and higher average hospital costs compared with patients without MCC.”23
An analysis of the DRGs confirms that hospital inpatients have experienced more serious conditions in recent years. Certain DRGs classify patients with comorbidities or complications. These DRGs indicate cases with serious problems that require more resources to treat. In 1993, the NIS sample showed that 22.5 percent of inpatients were labeled as having complications or comorbidities. By 2012, this percentage had risen to 25.9 percent.
Hospital labor productivity is unique in that it is affected strongly by patient characteristics, a factor outside the hospital’s control. There are two countervailing trends on productivity. On the one hand, patients who are less sick can be treated on an outpatient basis, requiring fewer labor hours and raising labor productivity. On the other hand, the remaining inpatients tend to be the most serious cases, requiring more resources and lowering labor productivity. These resource-intensive patients also receive a higher weight in the overall output index. This impact is further heightened by the fact that, as discussed earlier, the outcome of treatment is currently not accounted for in this measure. Future changes in patient treatment, as well as potential incorporation of new data on treatment outcomes, may result in very different labor productivity trends.
Over the last several years, U.S. federal statistical agencies have developed new methods and data to measure the health care sector. Such efforts include the Bureau of Economic Analysis health care satellite accounts and the BLS disease-based producer price indexes. Complementary to these statistics are the new measures of hospital output and labor productivity introduced in this article.
While the majority of IPS industry labor productivity measures are calculated using a deflated-value methodology, the most logical and practical means to measure productivity for community hospitals is to use a physical quantity measure, specifically by counting the number of courses of treatment. Each inpatient stay is counted when the patient is discharged from the hospital, while each outpatient visit is a single discrete unit. Both inpatient and outpatient quantities are classified by diagnostic type and are derived using comprehensive detailed data from the NIS, the AHA annual survey, the NHAMCS, and CMS.
This labor productivity measure is available on the BLS website and will be updated annually.
Industry Productivity Studies (IPS) measures of inpatient services are based on patient discharge data from the Nationwide Inpatient Sample (NIS). Sponsored by the Agency for Healthcare Research and Quality (AHRQ), the NIS is the largest all-payer inpatient care database publicly available in the United States, providing information on health care utilization and charge data, with annual data starting in 1988. As part of the Healthcare Cost and Utilization Project (HCUP), the NIS is drawn from those states participating in HCUP; for 2010, these states account for more than 96 percent of the U.S. population. The 2011 database contains information on more than 8 million hospital stays, from about 1,000 hospitals in 45 states, sampled to approximate a 20-percent stratified sample of U.S. community hospitals. The NIS is a stratified probability sample of hospitals in the frame, with sampling probabilities proportional to the number of U.S. community hospitals in each stratum. The universe of U.S. community hospitals is divided into strata using five hospital characteristics: ownership/control, bed size, teaching status, urban/rural location, and U.S. region. In 2012, the NIS sample was redesigned to improve national estimates. The NIS is now a sample of discharge records from all HCUP-participating hospitals.
The unit of observation is an inpatient stay record. NIS inpatient stay records are composed of clinical and resource use information, typically available from discharge abstracts. These records encompass more than 100 data elements for each hospital stay; the data elements include primary and secondary diagnoses, admission and discharge status, hospital characteristics, expected payment source, primary and secondary procedures, length of stay, patient demographics, and total costs and/or charges.24 The NIS is the only national hospital database with charge information on all patients, regardless of payer, including people covered by Medicare, Medicaid, private insurance, and the uninsured.25
For the purposes of this study, we remove state and local government hospitals from the original NIS dataset, leaving only the privately-owned non-profit and for-profit hospitals. We do this to ensure consistency between the output measure and the BLS labor input series that is used in the final labor productivity calculations. The sample of discharge records is made into a nationwide measure by applying weights to each inpatient discharge and its associated charge. Patient-level data are weighted with respect to the type of hospital where the service takes place.26 The nationwide discharge data are then summed with respect to each Diagnosis-Related Group (DRG).
!--?pagebreak?-->!--?pagebreak?-->!--?pagebreak?-->!--?pagebreak?-->!--?pagebreak?-->!--?pagebreak?-->!--?pagebreak?-->Brian Chansky, Corby A. Garner, and Ronjoy Raichoudhary, "New measure of labor productivity for private community hospitals: 1993–2012," Monthly Labor Review, U.S. Bureau of Labor Statistics, October 2015, https://doi.org/10.21916/mlr.2015.39
1 For more information, see BLS Current Employment Statistics at https://www.bls.gov/ces/.
2 Bureau of Economic Analysis, National Income and Product Accounts, Gross Output by Industry, https://apps.bea.gov/industry/xls/io-annual/GDPbyInd_GO_NAICS_1997-2013.xlsx.
3 For more information, see BLS Current Employment Statistics at https://www.bls.gov/ces/.
4 Elka Torpey, “Health Care: Millions of Jobs now and in the future,” (Bureau of Labor Statistics Office of Occupational Statistics and Employment Projections, 2014), https://www.bls.gov/careeroutlook/2014/spring/art03.pdf .
5 Community hospitals, as defined by the American Hospital Association, are “all nonfederal, short-term general, and other special hospitals. Other special hospitals include obstetrics and gynecology; eye, ear, nose, and throat; rehabilitation; orthopedic; and other individually described specialty services. Community hospitals include academic medical centers or other teaching hospitals if they are nonfederal short-term hospitals. Excluded are hospitals not accessible by the general public, such as prison hospitals or college infirmaries.” These hospitals are a combination of general medical and surgical hospitals (NAICS 6221) and specialty (except psychiatric and substance abuse) hospitals (NAICS 6223).
6 Brian Chansky, Corby Garner, and Ronjoy Raichoudhary, “Measuring output and productivity in private hospitals” (National Bureau of Economic Research, October 2013), https://www.nber.org/chapters/c13096.pdf.
7 Paul Schreyer, “Towards measuring the volume output of education and health services” (Organization for Economic Co-operation and Development, April 2010), http://www.oecd.org/officialdocuments/publicdisplaydocumentpdf/?doclanguage=en&cote=std/doc(2010)2.
8 Chansky et al., “Measuring output and productivity in private hospitals,” p. 26.
9 Trendwatch chartbook 2012: supplementary data tables trends in hospital financing (American Hospital Association, 2012), p. A–33.
10 The NIS is built from data provided by state health agencies. Prior to 1993, only a small number of states were sampled. Thus, based primarily on the addition of states to the NIS dataset over time, the U.S. Department of Health and Human Services recommends that time-series analyses of these data begin with 1993.
11 DRGs are derived from the International classification of diseases, ninth revision, clinical modification (ICD–9–CM) (U.S. Department of Health and Human Services, Centers for Medicare and Medicaid Services. Official version: International Classification of Diseases, Ninth Revision, Clinical Modification, Sixth Edition. DHHS Pub No. (PHS) 06–1260).
12 We are able to create time series of inpatient services by using DRG versions 10, 18, and 24. The NIS provides yearly discharge data for these versions.
13 AHA statistics do not segregate private hospitals from government hospitals. NIS data are used to calculate the percentage of hospitals that are privately owned in the United States. This percentage is applied to the AHA data to remove government-owned hospitals.
14 Trendwatch chartbook 2009: trends affecting hospitals and health systems (American Hospital Association, 2009), p. A–57.
15 For more information, see http://www.cdc.gov/nchs/ahcd/about_ahcd.htm.
16 For more information, see https://archive.cdc.gov/#/details?url=https://www.cdc.gov/nchs/icd/icd9cm.htm.
17 CMS data have only been available since 2004. Therefore, all average charge data are held constant from 1993 through 2003, using 2004 values.
18 Trendwatch chartbook 2012: supplementary data table, trends in hospital financing (American Hospital Association, 2012).
19 Self-employed and unpaid family workers are also included in total hospital employment and labor hours using data from the BLS Current Population Survey.
20 For more information, see https://www.bls.gov/lpc/iprhours.htm.
21 The Bureau of Economic Analysis reports that, from 1997 to 2013, real gross output has increased at an average annual rate of 4.4 percent in offices of physicians (NAICS 6211). The yearly average growth for outpatient care centers (NAICS 6214) and home health care centers (NAICS 6216) was 4.9 percent and 2.8 percent, respectively.
22 Claudia Steiner, Marguerite L. Barrette, Audrey J. Weiss, and Roxanne M. Andrews, “Trends and projections in hospital stays for adults with multiple chronic conditions, 2003–2014,” statistical brief 183, (Healthcare Cost and Utilization Project, November 2014), p. 2, http://www.hcup-us.ahrq.gov/reports/statbriefs/sb183-Hospitalizations-Multiple-Chronic-Conditions-Projections-2014.pdf.
23 Ibid at 1.
24 Overview of the nationwide inpatient sample (NIS), (U.S. Department of Health and Human Services, May 2011), http://www.hcup-us.ahrq.gov/nisoverview.jsp.
25 Introduction to the HCUP Nationwide Inpatient Sample (NIS) 2009, (U.S. Department of Health and Human Services, May 2011), p. 5, http://www.hcup-us.ahrq.gov/db/nation/nis/NIS_2009_INTRODUCTION.pdf.
26 These weights take into account geographic region, urban/rural location, teaching status, bed size, and ownership control; see ibid., p. 6, http://www.hcup-us.ahrq.gov/db/nation/nis/NIS_2009_INTRODUCTION.pdf.