An official website of the United States government
An official website of the United States government
The .gov means it's official.
Federal government websites often end in .gov or .mil. Before sharing sensitive information,
make sure you're on a federal government site.
The site is secure.
The
https:// ensures that you are connecting to the official website and that any
information you provide is encrypted and transmitted securely.
The stability of the proportion of the national dividend accruing to labor, irrespective apparently of the level of output as a whole and of the phase of the trade cycle…is one of the most surprising, yet best-established, facts in the whole range of economic statistics, both for Great Britain and the United States.—John Maynard Keynes, March 1939
Some facts turn out to be temporary. This is what John Maynard Keynes would have discovered had he lived to see the decline in the labor share during the second half of the 20th century. Keynes and other economists had accepted as fact that the share of national output accruing to workers as compensation was relatively constant. In fact, this idea had become so well accepted that some economists even began using the supposed constancy as an issue to be addressed in theories of production and economic growth.1 The term “Bowley’s Law,” referring to a 19th-century economist who had compiled statistics on the issue, was even coined to describe this stability.2
The stability of labor’s share of output had been unexpected because there had previously been an assumption, dating back to Ricardo, that the labor share would tend to vary with the quantity and quality of other factors of production.3 Consequently, the considerable changes to the U.S. and world economy over the early 20th century—including “phenomenal changes in the techniques of production, in the accumulation of capital relative to labor and in real income per head”4—would have led many to expect sizable changes in the labor share over time. In addition, the considerable variation in the labor share across industries in advanced economies over the period made the relative stability of the economy-wide labor share all the more surprising.5
However, in the late 20th century—after many decades of relative stability—the labor share began to decline in the United States and many other economically advanced nations, and in the early 21st century it fell to unprecedented lows. In response, an academic literature developed that attempted to determine the reasons for the decline and to consider the implications for economic theory and for economies throughout the world. The fact that the labor share declined simultaneously with increased attention on income inequality in many countries has further focused economists on studying the distribution of economic output. In view of the increased interest in the labor share in recent years, we are presenting detailed information on how the U.S. Bureau of Labor Statistics (BLS) estimates this measure. The material that follows reviews the BLS methodology for estimating the labor share, discusses the uses and limitations of this measure, and suggests potential improvements in that methodology.
The labor share is the percentage of economic output that accrues to workers in the form of compensation. It is calculated by dividing the compensation earned during a certain period by the economic output produced over the same period. The labor share is an indicator of the extent to which workers share in the economy’s output and is of interest to many. For example, studies by Michael W. L. Elsby, Bart Hobijn, and Ayşegül Şahin in 2013; Loukas Karabarbounis and Brent Neiman in 2014; and Robert Z. Lawrence in 2015 address measurement issues concerning the labor share and possible reasons for its decline.6 The measure is also of interest to workers, because it both describes the degree to which they are compensated for their efforts on the job and directly compares the output they helped produce with the compensation they received.
Furthermore, changes in the labor share help explain the extent of the “wage gap” between growth in labor productivity and growth in real hourly compensation. Declines in the labor share widen the gap between these two measures, while increases narrow the gap.7 In addition to its relevance for workers, the labor share is of interest to government policymakers, who can have a substantial impact on the distribution of income in an economy through tax policy and spending initiatives. Also, in part because of their simplicity, labor share measures facilitate international comparisons of income distribution among more-advanced nations, which produce a range of sophisticated statistical measures, and less developed nations, which may produce only a few broad economic statistics.
Still, the labor share measure does have at least one limitation: it cannot account for between-worker inequality. For example, the compensation of a highly paid CEO and a low-wage worker would both be included in the labor share. This limitation can be mitigated by supplementing the labor share data with other data, including wage data and information on income inequality. At the same time, it should be noted that the labor share does include nonwage compensation, a useful feature lacking from many other measures used to investigate income inequality.
The labor share is calculated with data from the BLS labor productivity news release and is published in a separate spreadsheet on the BLS website.8 Data are available quarterly and annually from 1947 to the current quarter for the nonfarm business, business, nonfinancial corporate, and manufacturing sectors. In this article, we focus on the nonfarm business sector measure, which excludes general government, nonprofit institutions, private households, the Armed Forces, and farms.9 The nonfarm business sector covers 75 percent of the U.S. economy, as measured in terms of economic output. BLS also publishes industry-level measures of the labor share.10
The labor share is calculated as

The larger portion of labor compensation is employee compensation, which comes directly from the U.S. Bureau of Economic Analysis (BEA) and is a comprehensive measure that includes all forms of pay and benefits:
The main source of data for BEA estimates of employee compensation is the BLS Quarterly Census of Employment and Wages (QCEW). BEA adjusts the QCEW data from a when-paid basis to a when-earned, or accrual, basis, to make the reference period of the compensation measure match the reference period of the output measure. BEA further adjusts the QCEW data to account for underreporting and nonreporting of compensation on employment tax returns and to account for employees who are not covered by the QCEW.14 BEA then aggregates these wage and salary data to the industry and sector level, using industry payroll data from the U.S. Census Bureau’s Economic Census.15
The employee compensation series also includes supplements to wages and salaries. These supplements are obtained mainly from government survey data and government administrative data, as well as from purchased data.16 Typically, the supplemental data are available on an annual basis only, and in these cases they are extrapolated forward through the quarters of the current year.17
Proprietors’ labor compensation makes up the other portion of labor compensation. It is difficult to estimate because BEA has data only on proprietors’ total income, which also includes proprietors’ return to capital.18 To separate this combination of proprietors’ labor and capital income, it is necessary to make an assumption about how proprietors’ income is divided into these two components. In a seminal paper, Irving Kravis proposed two approaches to estimating proprietors’ labor compensation: the labor approach and the asset approach.19 In the labor approach, proprietors’ labor compensation is estimated directly by assuming that proprietors earn the same hourly compensation as the average employee working in their sector. The asset approach estimates capital income by first assuming that the rate of return to capital is the same for proprietors and corporations. It then calculates proprietors’ labor compensation by subtracting the estimated noncorporate capital income from proprietors’ total income. The BLS quarterly labor share measure uses the labor approach because the asset approach requires data on capital income, which are available only on an annual basis and with a significant lag. BLS implements the labor approach by multiplying nonfarm proprietor hours by nonfarm business employee compensation per hour; that is,
 ,
,where  is employee compensation and
  and
and  are, respectively, employee and proprietor hours worked.
  is estimated mainly with the use of private nonfarm employee data from the Current Employment Statistics (CES) survey, supplemented by data from the Current Population Survey (CPS), the National Compensation Survey, and other sources.
  is estimated with the use of monthly data from the CPS. These data include all hours worked by proprietors in a primary job or another job.20 That way, the data on proprietors are consistent with the jobs-based CES data that are used for employees.21
The final component of the labor share estimation is output. BLS uses BEA’s gross value-added output, which is defined as gross output minus intermediate inputs, and subtracts the output of sectors in which output data are derived from input data. As with the compensation data, BEA compiles output data from several sources, with the Census Bureau being the main one. For data that are not yet available, BEA uses alternative data sources to extrapolate forward into recent quarters.22
The gross value-added output series used in the labor share measure is consistent with the BLS labor productivity measure. Some researchers prefer to use net value-added output—gross value-added output less depreciation—when estimating the labor share, because deprecation can be thought of as the portion of final output that replaces the capital consumed in production and is not distributed to workers or owners as income.23 Whether one uses net value-added or gross value-added output depends on the question to be answered. If one is interested in the extent to which workers share in the output available for consumption, then net value-added output may be more appropriate. Gross value-added output is more appropriate if one is interested in the extent to which compensation tracks productivity. Finally, note that all output and compensation data used to calculate the labor share are in current dollars.
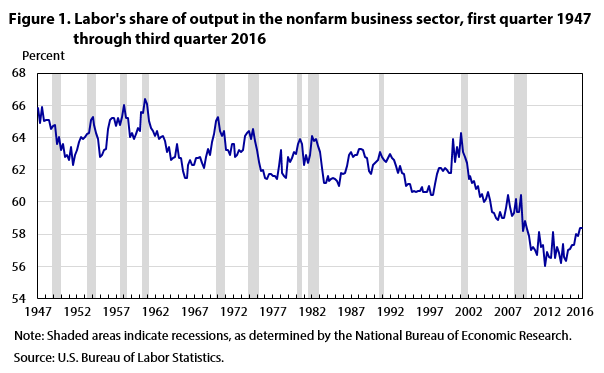
Figure 1 shows the evolution of the labor share from 1947 through the third quarter of 2016. Although there is quite a bit of variability, we see that the labor share declined by about 2 percentage points from the beginning of the series to around the turn of the 21st century. Since then, the labor share has declined more rapidly, dipping below 60 percent for the first time in 2005 and falling to a low of 56.0 percent in the fourth quarter of 2011. By the third quarter of 2016, however, the labor share had increased to 58.4 percent.
The slow and steady decline during the latter half of the 20th century—followed by the sharper decline over the 15 years since then—has increasingly been a focus of research. In this regard, Karabarbounis and Neiman examined data from more than 50 countries and argue that the decline in the relative price of investment goods—in particular, computerized capital—has led firms to employ more capital and relatively less labor.24 They find that this shift has been responsible for approximately one-half of the observed decline in the labor share.
Lawrence presents another possible explanation for the observed changes in the labor share.25 He argues that labor and capital are actually complements, rather than substitutes, in the production process. Although the capital-to-labor ratio has been generally increasing, when the ratio is adjusted for labor and capital augmenting technical change over time, the effective capital-to-labor ratio is seen to have actually been decreasing. Lawrence writes that increases in labor-augmenting technical changes essentially increase the amount of labor provided by a given number of workers, thereby decreasing labor’s share of output.
After also estimating the effect of the decline in the price of investment goods, Elsby, Hobijn, and Şahin identify two additional important causes of the decline.26 The first is an increased reliance on imported inputs used in domestic production, especially inputs that have labor-intensive production processes. These “offshored” inputs are typically produced in countries with lower labor costs, resulting in an overall reduction in the price of domestically produced final goods. The second possible cause is the assumption that the hourly compensation of proprietors is the same as that of employees. Elsby and his coauthors determined that about one-third of the observed decline in the labor share is due to this assumption. They also note that using the BLS labor share calculation method allows for the possibility of a proprietors’ labor compensation series which exceeds the proprietors’ total income series; this situation actually occurred in the data for the mid-1980s and implies a negative return to proprietors’ capital over that period.
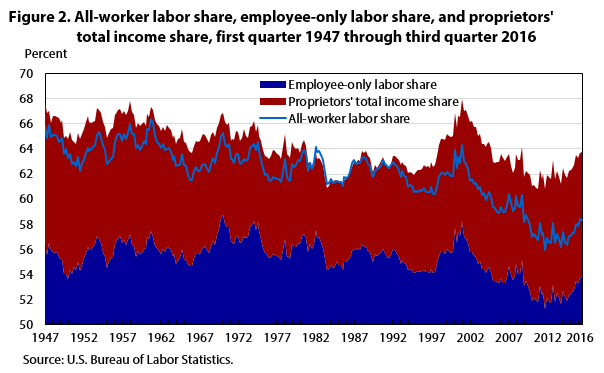
Figure 2 illustrates the relationship between proprietors’ labor compensation and proprietors’ total income, in terms of their shares of output. The solid dark-blue area depicts employee compensation as a share of output (i.e., the “employee-only” labor share), and the light-blue line is the “all-worker” labor share (the same as appeared in figure 1). The difference between the employee-only labor share and the all-worker labor share is the proprietors’ labor share, as estimated by BLS and illustrated as the gap between the dark-blue area and the light-blue line. The red area is the proprietors’ total income share, and it is stacked on top of the employee-only labor share. In theory, the all-worker labor share line should lie entirely within the red area, indicating the split of the proprietors’ total income into their labor compensation and their return to capital. Nonetheless, we see that, for 17 quarters from 1981 to 1987, the all-worker labor share exceeded the sum of the employee-only labor share and the proprietors’ total income share—a situation that also occurred in two quarters of 1991. However, after 1991, the ratio of proprietors’ labor compensation to proprietors’ total income fell steadily, as illustrated by the all-worker labor share line falling downward into the middle of the red region in the right-hand portion of the figure. The periods of implied negative return to proprietors’ capital occurring in the 1980s and in 1991 reveal that the assumption that proprietors and the employees working in the same sector as those proprietors earn the same hourly compensation is problematic. An alternative approach is to explicitly account for the return to proprietors’ capital during the estimation of proprietors’ labor compensation. (See the box that follows.)
The multifactor productivity methodology for estimating proprietors’ labor compensation
In addition to issuing the labor share series associated with its quarterly labor productivity data, BLS publishes a second major-sector labor share measure, referred to here as the multifactor productivity (MFP) labor share series, which is associated with the annual “Multifactor Productivity Trends” news release. The MFP labor share is used to weight labor input in MFP calculations, and it differs conceptually from the labor productivity measure, because it is defined as labor’s share of the sum of labor and capital costs. The MFP series is available only at an annual frequency, from 1987 to the current year, for the private nonfarm business, private business, and manufacturing sectors. (The term “private” indicates that the MFP series excludes government enterprises from sector coverage. Government enterprises are defined as “government agencies that cover a substantial portion of their operating costs by selling goods and services to the public and that maintain their own separate accounts.” (See the BEA glossary, at https://www.bea.gov/help/glossary.) Government enterprises are excluded from the MFP series because no satisfactory capital measures for this sector are available; specifically, a substantial portion of the capital income of these entities consists of subsidies.) Note that there is a publication lag with the MFP series of about 16 months after the end of the reference year, because of a lag in the availability of the source data. This delay makes the MFP series unsuitable for quarterly data releases.
The methodology for estimating MFP proprietors’ labor compensation is a combination of the labor and asset approaches described by Kravis. In this regard, BLS uses each approach separately to calculate two distinct estimates of proprietors’ labor compensation. The two estimates are summed and then proportionally scaled up or down, so that the sum equals proprietors’ income as reported by BEA. The MFP methodology for the labor approach is identical to the approach used in the labor productivity labor share measure. The asset approach requires an estimate of proprietors’ (i.e., noncorporate) capital income, which must be calculated.
Capital income is equal to the productive capital stock multiplied by the rental rate of capital. The rental rate of capital is an opportunity cost concept that depends on the internal rate of return, the depreciation rate, taxes, and the rate of change in asset prices. All of these series are available or can be calculated, except for the internal rate of return. For the corporate sector, the internal rate of return is calculated by industry, with the use of data on capital income and the other components of the rental price. This approach is not possible for the noncorporate sector, because there are no data on capital income. Instead, capital income is estimated by assuming that the noncorporate rate of return on capital is the same as the corporate rate. As noted in the text, under the asset approach proprietors’ labor compensation is equal to the difference between proprietors’ income and noncorporate capital income.
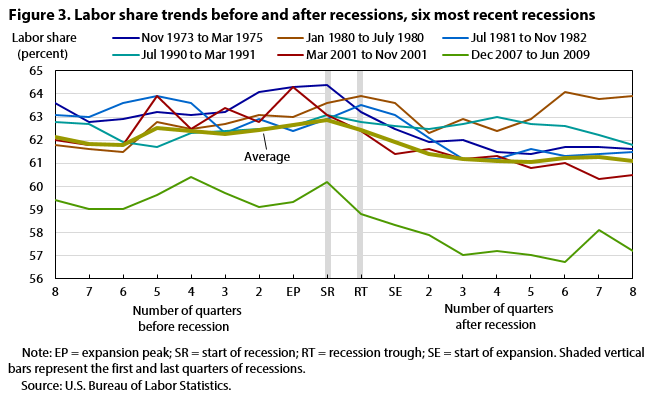
Researchers also have studied how labor’s share of output varies over the course of the business cycle.27 Figure 3 illustrates the cyclicality of the labor share, or, more specifically, how the labor share changes in the quarters leading up to and following a recession. In the figure, the horizontal axis shows the eight quarters before the beginning of a recession and the eight quarters following the end of a recession. The quarter before the start of a recession is the expansionary peak, and the quarter after the recessionary trough (the end of the recession) is the start of a new expansion. The number of quarters between the start and end of a recession varies across the six recessions depicted.28 The value of the labor share before and after each of the six most recent recessions is shown in the figure, as is the average labor share. As an example, consider the labor share surrounding the recession of November 1973 through March 1975. In the first quarter of 1972, eight quarters before the start of that recession, the labor share was 63.6 percent. Beginning with that quarter, the labor share initially fell and then moved slowly upward, until it reached 64.3 percent during the expansionary peak in the quarter before the recession (the fourth quarter of 1973) and 64.4 percent in the first quarter of the recession. By the end of the recession (the first quarter of 1975), the labor share had fallen to 63.2 percent. In the expansion that followed, the labor share continued to trend mostly downward before recovering somewhat, to 61.6 percent, in the eighth quarter after the end of the recession. The average labor share eight quarters before the beginning of a recession was 62.1 percent and rose to 62.9 percent in the first quarter of a recession. With the exception of the brief 1980 recession, the labor share has tended to decline after each of the last six recessions, decreasing by about 1.3 percentage points, on average, during the three quarters following the trough of the recession, before essentially leveling out over the next five quarters. Note the labor share’s downward shift that occurred between the 2001 recession, when the measure was between 62 percent and 64 percent, and the recession of December 2007 to June 2009, when it had fallen below 60 percent. Despite this shift, changes in the labor share before and after the most recent recession are similar to those observed in the previous five recessions.
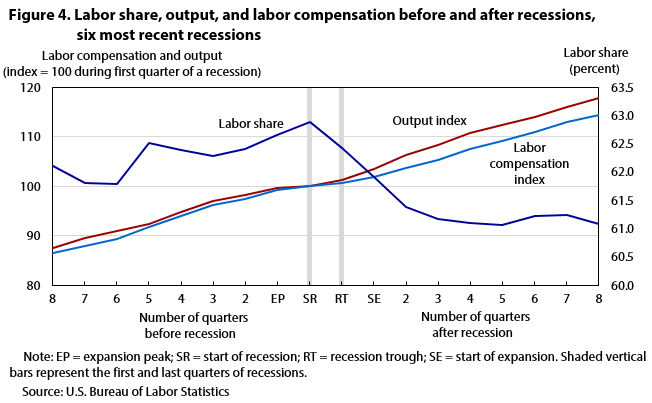
Figure 4 shows the average labor share (the same as in figure 3) in the quarters leading up to and following the six most recent recessions, along with the two component series: average labor compensation and average output. The vertical axis on the right measures labor share, and the vertical axis on the left measures the labor compensation and output indexes, both scaled to equal 100 in the first quarter of a recession. The figure reveals that the labor compensation index grew faster, on average, than output before these recessions. During this pre-recessionary period, there is a general upward trend of about 1 percentage point in the labor share, but there is also substantial variability in that trend.
By contrast, there appears to be no clear trend in the labor share during recessions, measured from the expansionary peak to the recessionary trough: the average change during the six most recent recessions was just –0.2 percentage point. Still, in three of the recessions, the labor share changed by more than 1 percentage point: a decrease of 1.1 percentage points in the November 1973–March 1975 recession, an increase of 1.1 percentage points in the July 1981–November 1982 recession, and a decrease of 1.9 percentage points during the brief 2001 recession.
Following recessions, a couple of factors act to exert downward pressure on wage and compensation growth. First, employers are not yet certain that economic activity is accelerating, so they are hesitant to increase wages. Second, recessions lead to higher levels of unemployment and, consequently, a large supply of available workers, making workers less likely to demand higher wages. Therefore, after recessions, the output index tends to grow more quickly than labor compensation. The result is a drop in the labor share of about 1.3 percentage points during the three quarters following the trough quarter. Over the next five quarters, output and labor compensation grow at similar rates, leaving the labor share essentially unchanged. Typically, following a recession, the number of hours worked per employee increases as firms observe faster economic growth. Subsequently, employment rises, and as the surplus of labor diminishes, wages finally begin to increase, on average.
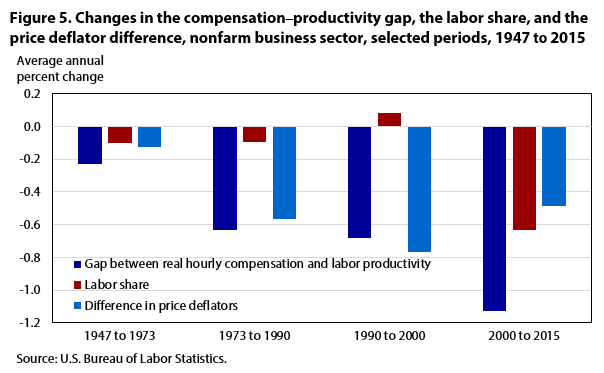
As previously noted, the labor share is one of two components that can contribute to a gap between real hourly compensation and labor productivity. The other contributor is the percentage-point difference between the deflator that BEA applies to nonfarm business output and the Consumer Price Index (CPI)–based deflator that BLS applies to the compensation component of its hourly compensation series;29 that is,

From 1947 to 1973, real hourly compensation increased at about the same rate as labor productivity, resulting in a relatively small 0.2-percentage-point gap in growth between these measures over the period. (See figure 5.) Then, real hourly compensation began to lag further behind labor productivity during the 1970s, and the gap has continued to widen. From the early 1970s until the turn of the century, the difference in deflators accounted for virtually all of the gap between real hourly compensation and labor productivity. However, since 2000, the decline in the labor share has contributed more than in any previous period. Over this 15-year period, labor productivity has grown 1.1 percentage points faster than real hourly compensation, with the drop in the labor share accounting for 0.6 percentage point of this gap and the difference in deflators accounting for the remaining 0.5 percentage point.
As Robert Solow observed, examining movements in the labor share within component industries can shed light on the variation in the aggregate labor share.30 Solow was attempting to explain the “relative stability” of the labor share in the early to mid 20th century;31 we focus instead on more-recent data to determine industry contributions to the decline in the labor share over the last two decades. To estimate these contributions, we constructed measures of the labor share for the industries that make up the nonfarm business sector. BEA publishes data on the components of industry value-added output, including labor compensation, from 1997 through 2014. To be consistent with our earlier analysis, we restricted these data to the nonfarm business sector by subtracting industry-level nonprofit output from both output and compensation in industries for which BEA estimates data for nonprofits.32 As noted previously, nonprofits are excluded from the nonfarm business sector because their output is estimated mainly from compensation data. Note also that the BEA industry-level compensation data are employee-only data, so our analysis here addresses just the employee compensation portion of the decline in the labor share, not the proprietor-based portion.
Industry-level labor share values from 1997 to 2014 are shown in table 1. There were declines in the labor share in eight industries, increases in five industries, and no change in one. The largest percentage-point declines in the labor share were in mining (from 37 percent to 22 percent) and nondurable goods manufacturing (from 49 percent to 34 percent). The largest increase was in other services (except government), whose labor share grew from 39 percent to 44 percent.
| Sector | 1997 | 1998 | 1999 | 2000 | 2001 | 2002 | 2003 | 2004 | 2005 | 2006 | 2007 | 2008 | 2009 | 2010 | 2011 | 2012 | 2013 | 2014 | Change, 1997 to 2014 |
|---|---|---|---|---|---|---|---|---|---|---|---|---|---|---|---|---|---|---|---|
Mining | 0.37 | 0.44 | 0.41 | 0.33 | 0.31 | 0.31 | 0.26 | 0.25 | 0.21 | 0.21 | 0.20 | 0.18 | 0.22 | 0.21 | 0.20 | 0.22 | 0.21 | 0.22 | -0.15 |
Utilities | .24 | .26 | .26 | .28 | .29 | .30 | .28 | .27 | .28 | .26 | .27 | .28 | .27 | .25 | .26 | .27 | .27 | .26 | .02 |
Construction | .67 | .66 | .66 | .67 | .67 | .66 | .64 | .61 | .59 | .60 | .62 | .66 | .64 | .64 | .64 | .63 | .63 | .64 | -.04 |
Durable goods | .62 | .64 | .66 | .66 | .70 | .66 | .64 | .63 | .62 | .61 | .61 | .62 | .62 | .57 | .58 | .57 | .57 | .57 | -.06 |
Nondurable goods | .49 | .49 | .48 | .48 | .46 | .46 | .45 | .42 | .41 | .39 | .38 | .39 | .35 | .34 | .34 | .34 | .34 | .34 | -.15 |
Wholesale trade | .50 | .51 | .52 | .52 | .53 | .53 | .52 | .51 | .50 | .50 | .50 | .50 | .49 | .47 | .48 | .48 | .47 | .47 | -.03 |
Retail trade | .58 | .57 | .58 | .58 | .58 | .58 | .57 | .57 | .56 | .56 | .58 | .58 | .56 | .55 | .56 | .55 | .55 | .55 | -.03 |
Transportation and warehousing | .65 | .65 | .66 | .67 | .68 | .68 | .65 | .63 | .62 | .59 | .62 | .60 | .61 | .58 | .58 | .59 | .58 | .58 | -.07 |
Information | .43 | .44 | .45 | .52 | .49 | .42 | .41 | .38 | .38 | .38 | .37 | .35 | .36 | .34 | .36 | .37 | .36 | .37 | -.06 |
Finance, insurance, real estate, rental and leasing | .23 | .24 | .24 | .25 | .24 | .24 | .23 | .24 | .24 | .25 | .25 | .26 | .23 | .23 | .23 | .23 | .23 | .23 | .00 |
Educational services, health care, and social assistance | .41 | .40 | .39 | .38 | .34 | .34 | .36 | .39 | .38 | .38 | .39 | .39 | .38 | .38 | .40 | .42 | .41 | .42 | .01 |
Professional and business services | .70 | .72 | .72 | .75 | .73 | .71 | .70 | .70 | .70 | .71 | .71 | .70 | .70 | .70 | .71 | .72 | .73 | .74 | .04 |
Arts, entertainment, recreation, accommodation, and food services | .56 | .58 | .58 | .57 | .59 | .58 | .58 | .58 | .58 | .57 | .58 | .59 | .58 | .58 | .58 | .59 | .58 | .59 | .03 |
Other services (except government) | .39 | .39 | .38 | .38 | .41 | .39 | .44 | .43 | .41 | .39 | .42 | .43 | .44 | .40 | .44 | .42 | .44 | .44 | .05 |
| Source: U.S. Bureau of Labor Statistics. | |||||||||||||||||||
To identify each industry’s contribution to the overall decline, we weighted each industry’s labor share by that industry’s share of output. The aggregate labor share declined from 48.1 percent in 1997 to 45.1 percent in 2014. Note that these shares are lower than the published labor share estimates for the nonfarm business sector; the disparity is due to several methodological differences between the industry series we used in our estimations for this article and the data used in constructing the published BLS major-sector series.33 In our analysis of these industry series, we found that a few of the industries contributed disproportionately to the decline in the overall labor share. Declines in durable goods manufacturing and nondurable goods manufacturing were responsible for 2.8 percentage points and 1.6 percentage points, respectively, of the decline in the overall labor share. Over the same period, several industries showed gains in their labor share—led by professional and business services, which contributed 2.5 percentage points, partially offsetting the decline in the overall labor share.
We also identified how much of the overall decline in the labor share was due to changes in the within-industry labor share and how much was due to the relative changes in each industry’s share of total output. To ascertain these two effects, we decomposed the change in the weighted average labor share from 1997 to 2014 in the following manner:
Change in weighted labor share 
In this equation, LS is the labor share, W is industry’s share of output, and the subscripts denote the particular industry (i) and year (1997 or 2014). The three factors that determine the change in the weighted labor share are presented in table 2. The change in the weighted labor share for each sector shown is in the first column. The first term under the summation sign in the equation represents the within-industry changes in the labor share, weighted by the industry’s relative share of output in 1997. This term is shown in the second column of the table. The second term under the summation sign gives the change in the relative industry output share, weighted by the industry’s labor share in 1997. This term appears in the third column of the table. The third term under the summation sign gives the interaction between the changes in the industry labor share and the changes in the output share. This term is shown in the rightmost column of the table. For each column, the aggregate labor share using output share weights (the sum of all the entries after the first row) is given in the first row of that column. Looking at these sums, we see that the within-industry changes in labor shares contributed about 4 times as much as the relative changes in industry output to the overall decline in the labor share. Notable changes in relative industry output occurred in durable goods manufacturing, which fell from 12 percent of total output to 8 percent, and in professional and business services, which rose from 12 percent to 15 percent.
| Sector | Change in weighted labor share from 1997 to 2014 | Change in labor share maintaining 1997 output share | Change in output share maintaining 1997 labor share | Change in output share times change in labor share |
|---|---|---|---|---|
Aggregate labor share using output share weights | -0.030 | -0.0258 | -0.0057 | 0.00165 |
Mining | .002 | -.0021 | .0072 | -.00292 |
Utilities | -.001 | .0005 | -.0011 | -.00009 |
Construction | -.002 | -.0018 | -.0006 | .00003 |
Durable goods | -.028 | -.0067 | -.0236 | .00210 |
Nondurable goods | -.016 | -.0120 | -.0052 | .00154 |
Wholesale trade | -.003 | -.0025 | -.0003 | .00002 |
Retail trade | -.009 | -.0023 | -.0072 | .00034 |
Transportation and warehousing | -.003 | -.0027 | -.0001 | .00001 |
Information | -.002 | -.0034 | .0013 | -.00017 |
Finance, insurance, real estate, rental and leasing | .005 | .0003 | .0043 | .00002 |
Educational services, health care, and social assistance | .001 | .0002 | .0005 | .00001 |
Professional and business services | .025 | .0044 | .0196 | .00101 |
Arts, entertainment, recreation, accommodation, and food services | .004 | .0012 | .0022 | .00012 |
Other services (except government) | -.002 | .0011 | -.0028 | -.00036 |
| Source: U.S. Bureau of Labor Statistics. | ||||
In their 2013 article, Elsby, Hobijn, and şahin noted an important limitation of the BLS labor share measure associated with labor productivity:34 the assumption that proprietors earn the same hourly compensation as that of employees. In unpublished research, Michael Giandrea and Jay Stewart attempted to correct this limitation by controlling for occupation and accounting for the return to capital for proprietors.35 Giandrea and Stewart assumed that proprietors earn the same hourly compensation as corporate employees in the same occupation. The reason they took this approach is that there is a substantial difference in average employee labor compensation across occupations and this difference can have an important effect on the calculation of the labor share if the distribution of occupations is very different for employees and proprietors. As it turns out, that is in fact the case, with proprietors more likely to be in some of the higher paying occupations (e.g., executive, administrative, and managerial occupations; construction trades; personal service occupations; and writers, artists, entertainers, and athletes) and less likely to be in some of the lower paying occupations (e.g., administrative support and clerical occupations). Still, Giandrea and Stewart’s adjustment is not perfect, because proprietors tend to be generalists who perform the tasks of many occupations.
The difference in the distributions of occupations held by proprietors and those held by employees who work in the same sector as those proprietors suggests that using the average wage computed over all employees may understate proprietors’ labor compensation. Moreover, with the return to education and high skill levels increasing with time, this effect may be more and more substantial over time. Working in the opposite direction, however, is a shift in the distribution of proprietors’ occupations. The distributions of employees and proprietors across occupations shifted substantially from 1979 to 2013. For example, in 1979, fully 22 percent of proprietors were classified into the high-wage executive, administrative, and managerial occupations while only 10 percent of employees were similarly classified. This 12-percentage-point gap fell to only 3 percentage points in 2013, when 19 percent of proprietors and 16 percent of employees were classified into executive, administrative, and managerial occupations.
In their paper, Giandrea and Stewart calculated a revised labor share after controlling for proprietor occupations. In all quarters but two from 1979 through 2013, their modification results in a labor share of output that is just slightly higher than that produced by the current methodology. The average size of the adjustment is 0.27 percentage point, so the change in the labor share is very small when the different occupations of proprietors and employees are taken into account. Also, the adjustment gets smaller throughout the period: while in the early years it results in an increase in the estimated labor share by approximately 0.5 percentage point, over time the gap between the measured and the adjusted labor share decreases and essentially vanishes in the most recent periods. This vanishing of the gap reflects the fact that the distribution of occupations among proprietors becomes increasingly similar to the distribution of occupations among corporate employees over the particular period examined.
Giandrea and Stewart also attempted to use their hybrid approach to estimate proprietors’ labor compensation for the BLS multifactor productivity (MFP) series, as described earlier in the box entitled “The multifactor productivity methodology for estimating proprietors’ labor compensation.” A significant drawback to the MFP approach is a lack of timeliness, because the required data are not available until more than a year after the reference period. Giandrea and Stewart examined whether it might be possible to use preliminary data on capital to generate a better preliminary estimate of proprietors’ capital income. They assumed that the ratio of proprietors’ labor compensation to employee labor compensation in the reference period is the same as it was in the previous period. The labor share could then be estimated as the sum of employee compensation and predicted proprietors’ labor compensation, divided by output. This advance estimate of the labor share turned out to be a good predictor in the MFP labor share series approach and could be available up to a year before the MFP labor share measure is released. BLS continues to research this and alternative methods for improving measures of the labor share.
The labor share is the fraction of economic output accruing to workers in exchange for their labor. The measure is an important indicator of the extent to which workers are being compensated in an economy. In part owing to the simplicity of both the calculation and the interpretation of the labor share, the measure has been produced for many decades in countries all across the world. In the United States, BLS labor share data have been used in economic models and by government officials to inform public-policy choices. In addition, new research on the labor share is helping to inform debates on issues such as wage inequality and worker compensation. BLS labor share data have a continuing role to play in these discussions.
ACKNOWLEDGMENTS: The authors express their sincere gratitude to colleagues Jay Stewart, for his very helpful editorial suggestions and analytical insights; Steve Rosenthal, for providing information on the BLS multifactor productivity labor share methodology; Lucy Eldridge, for her editorial suggestions; and Brian Smith and Jennifer Lee of the U.S. Bureau of Economic Analysis, for providing information on BEA source data.
Michael D. Giandrea and Shawn Sprague, "Estimating the U.S. labor share," Monthly Labor Review, U.S. Bureau of Labor Statistics, February 2017, https://doi.org/10.21916/mlr.2017.7
1 Nonetheless, Robert M. Solow and several other economists, including Edward F. Denison and Irving B. Kravis, noted tumultuous changes in the labor share at the underlying industry level. For a discussion of the relationship between the labor share and economic theory, see Dorothee Schneider, “The labor share: a review of theory and evidence,” SFB 649 Discussion Paper 2011-069 (Berlin: Humboldt-Universität zu Berlin, 2011), http://edoc.hu-berlin.de/series/sfb-649-papers/2011-69/PDF/69.pdf.
2 Ibid., p. 6.
3 David Ricardo, On the principles of political economy and taxation, 3rd edition, Library of Economics and Liberty (London: John Murray, 1821), http://www.econlib.org/library/Ricardo/ricP1.html.
4 Nicholas Kaldor, “Alternative theories of distribution,” The Review of Economic Studies, vol. 23, no. 2 (1955), p. 84.
5 Robert M. Solow, “A skeptical note on the constancy of relative shares,” American Economic Review, September 1958, pp. 618–631.
6 See Michael W. L. Elsby, Bart Hobijn, and Ayşegül Şahin, “The decline of the U.S. labor share,” Brookings Papers on Economic Activity, Fall 2013, pp. 1–63; Loukas Karabarbounis and Brent Neiman, “The global decline of the labor share,” Quarterly Journal of Economics, vol. 129, no. 1 (February 2014), pp. 61–103; and Robert Z. Lawrence, “Recent declines in labor’s share in U.S. income: a preliminary neoclassical account,” NBER Working Paper 21296 (Cambridge, MA: National Bureau of Economic Research, June 2015), http://www.nber.org/papers/w21296.pdf
7 Although the output and compensation data used in calculating the labor share are not deflated, the output data used in estimating labor productivity and the compensation data used in estimating real hourly compensation are both deflated. The difference in these deflators makes up one component of the gap between real hourly compensation and labor productivity; the other component is the labor share.
8 See “LPC databases,” Labor productivity and costs (U.S. Bureau of Labor Statistics), https://www.bls.gov/lpc/data.htm. Click the link that says, “Download the complete Major Sector Productivity and Costs dataset.” A zip file that contains the annual and quarterly datasets will open. This is the sole location on the BLS website where data on labor share levels can be found: the other data search tools on the Productivity and Costs homepage supply only percent-change and index data.
9 The farm sector is excluded because it is volatile. The others are excluded because their output is measured largely with the use of compensation data, which bias the labor share toward 100 percent in those sectors.
10 Industry measures of the labor share are defined as labor’s share of costs, rather than labor’s share of output, because they are prepared in conjunction with BLS multifactor productivity estimates. To use these measures, see “Industry productivity” (U.S. Bureau of Labor Statistics), https://data.bls.gov/pdq/querytool.jsp?survey=ip. Select “Labor cost share” in box 1 of the window, the sector you are interested in in box 2, and the industry in box 3. Then select the “Indexes or values” button and click “Get data” to retrieve the labor-share-of-cost estimates. Labor cost share data associated with the annual BLS news release on multifactor productivity trends are found in “Major sector multifactor productivity” (U.S. Bureau of Labor Statistics), https://data.bls.gov/pdq/querytool.jsp?survey=mp. Select the sector you are interested in in box 1 of the window, “Labor’s Share in Cost” in box 2, and “Levels” in box 3. Then click “Get data” to retrieve the labor-share-of-cost estimates.
11 Wages and salaries are measured on an accrual basis and are recorded as they are earned; in contrast, disbursements of wage and salaries are recorded as they are paid. For labor share and productivity analyses, BLS uses the accrual measure to connect the compensation actually earned in a period with the output that the workers who received the compensation helped to produce during the same period.
12 Because of data limitations, stock options are not measured on an accrual basis. (See National Income and Product Accounts Handbook of Methods, “Chapter 10: Compensation of employees,” p. 3, note 4, https://apps.bea.gov/national/pdf/chapter10.pdf.)
13 For a comprehensive list of these items and all aspects of BEA’s estimation of employee compensation, see ibid.
14 “Major exclusions from UI [unemployment insurance] coverage include self-employed workers, most agricultural workers on small farms, all members of the Armed Forces, elected officials in most states, most employees of railroads, some domestic workers, most student workers at schools, and employees of certain small nonprofit organizations.” (See item 15, “What is included in employment?” on the QCEW frequently-asked-questions webpage: https://www.bls.gov/cew/cewfaq.htm.)
15 QCEW data are not available until 5 months after the end of the reference quarter. For quarters when the QCEW data are not yet available, BEA extrapolates the wage and salary data forward with the use of data from the BLS Current Employment Statistics (CES) survey. BEA estimates total wages and salaries with the use of CES estimates of average weekly hours, average hourly earnings, and employment. BEA then uses the quarterly growth rate of this estimate to extrapolate the most recent quarterly data from the QCEW through the current quarter. (See National Income and Product Accounts Handbook of Methods, chapter 10, November 2014 update, p. 12.) Generally, the first release of the nation’s gross domestic product (GDP) would have incorporated QCEW data up through two quarters prior to the most recent quarter, whereas the second GDP release would have incorporated QCEW data up through one quarter prior to the most recent quarter.
16 The survey and administrative data come from the U.S. Department of Labor, Department of the Treasury, Census Bureau, Office of Personnel Management, Federal Retirement Thrift Investment Board, Pension Benefit Guaranty Corporation, Employment Benefits and Security Administration, Department of Health and Human Services, Department of Defense, Department of Veterans Affairs, Social Security Administration, and Office of Management and Budget, as well as from reports from state and local pension plans. Purchased data include Best’s Aggregates and Averages (Oldwick, NJ: A.M. Best Co., published annually).
17See National Income and Product Accounts Handbook of Methods, chapter 10, p. 12.
18 Here and, indeed, throughout this article, "proprietors" is taken to mean "unincorporated proprietors." Incorporated self-employed workers are technically employees of their own corporation; thus, their compensation is already included in the “employee compensation” category.
19 Irving B. Kravis, “Relative income shares in fact and theory,” American Economic Review, December 1959, pp. 917–949.
20 Note that the proprietors we are referring to here are defined as unincorporated self-employed workers. Proprietors whose businesses are incorporated are covered by the CES survey, because these workers are employees of their own corporation.
21 The CPS collects hours-worked data on workers who were self-employed on their main job or a secondary job (outgoing rotations only).
22 See Alyssa E. Holdren, “Gross domestic product and gross domestic income: revisions and source data,” Survey of Current Business, June 2014, pp. 1–11.
23 See Benjamin Bridgman, “Is labor’s loss capital’s gain? Gross versus net labor shares” (Bureau of Economic Analysis, October 2014).
24 Karabarbounis and Neiman, “The global decline of the labor share.”
25 Lawrence, “Recent declines in labor’s share.”
26 Elsby, Hobijn, and Şahin, “The decline of the U.S. labor share.”
27 Ibid. See also Enchuan Shao and Pedro Silos, “Accounting for the cyclical dynamics of income shares,” Economic Inquiry, April 2014, pp. 778–795; and Andrew T. Young, “Labor’s share fluctuations, biased technical change, and the business cycle,” Review of Economic Dynamics, October 2004, pp 916–931.
28 Two of the recessions shown lasted for two quarters, one lasted for three quarters, two more lasted for five quarters, and the most recent recession, from December 2007 to June 2009, lasted for six quarters.
29 Consumer prices through the most recent completed year are based on the CPI Research Series (CPI-U-RS), and the series is extrapolated for the quarters of the current year on the basis of the CPI for All Urban Consumers (CPI-U).
30 Solow, “A skeptical note.”
31 Ibid., p. 619.
32 We utilized nonprofit gross output data from BEA Table 2.4.5U, “Personal Consumption Expenditures by Type of Product,” as proxy data for both nonprofit output and compensation in the three sectors for which BEA estimates nonprofits (educational services, health care, and social assistance; arts, entertainment, recreation, accommodation, and food services; and other services, except government), as these were the only available data on nonprofits with which we could exclude nonprofits and estimate “business-only” industry labor share series.
33 Data limitations led to the exclusion of proprietor compensation from our industry analysis, the use of nonprofit output as a proxy for nonprofit compensation, and the exclusion of government enterprises from our industry analysis; these modifications to methodology contributed to the difference between the data used for this analysis and the published major-sector labor share series. Also contributing to this difference was the fact that the sum of industry value-added measures is greater than the total value added for the nonfarm business sector.
34 Elsby, Hobijn, and Şahin, “The decline of the U.S. labor share.”
35 Michael D. Giandrea and Jay Stewart, “BLS measures of labor share: current practice and possible extensions,” paper presented at the annual meeting of the Society for Economic Measurement, Chicago, IL, August 18–20, 2014.