
An official website of the United States government
An official website of the United States government
The .gov means it's official.
Federal government websites often end in .gov or .mil. Before sharing sensitive information,
make sure you're on a federal government site.
The site is secure.
The
https:// ensures that you are connecting to the official website and that any
information you provide is encrypted and transmitted securely.

Crossref 0
Improving response rates and representativity in the CPI medical care index, Monthly Labor Review, 2023.
In this article, we examine the possibility of including medical insurance claims data in the calculation of medical price indexes. Our analysis indicates that indexes supplemented with claims data more accurately reflect changes in prices for physicians’ services and outpatient hospital services. In addition, we identify both advantages and disadvantages of using claims data in index construction.
The use of medical insurance claims data in the construction of medical price indexes presents many opportunities and challenges for the U.S. Bureau of Labor Statistics (BLS). This article describes a new methodology for incorporating claims data into traditionally collected data for the Consumer Price Index (CPI) for physicians’ services and the CPI for outpatient hospital services. We address the current state of CPI data collection for medical care and describe the claims data, their sampling and representativeness, the methodologies used to construct price indexes with the data, our initial results, and the next steps for this project.
Medical insurance claims data, which are collected from bills submitted by healthcare providers to a patient’s insurance provider, can help address issues with survey response rates, while also reducing index volatility. Because of their large amount, claims data capture more types of medical procedures and involve faster updating of the quantities of those procedures.
We have constructed price indexes by using a national medical claims dataset. We compare these indexes with the CPIs for physicians’ services and outpatient hospital services at the U.S. city-average level. Some of the practical issues we consider in the comparison include the following:
(1) Claims data introduce a time lag that can affect when price changes appear in an index.
(2) Weighting involves issues related to the use of both claims data and traditionally collected data.
(3) There is substantial variation in prices in the claims data even after controlling for provider, insurer, and service.
Our results indicate that supplementing the medical price indexes with claims data will improve index accuracy by increasing the number of observations.
In 2004, BLS examined the use of claims data in index calculation, determining that the benefits of such use were not sufficient to justify the high cost of purchasing the data. This determination held even when the practical issues related to using claims data in the production of official price statistics could be addressed.1 Since 2004, however, growing challenges to the traditional collection of price data for medical services—challenges that risk introducing bias in the official statistics—have led BLS to reconsider the use of claims data. Respondent cooperation among medical providers has declined, and the response rates for the household surveys used to select providers have fallen. (See chart 1.)
| Major group | 2002 | 2003 | 2004 | 2005 | 2006 | 2007 | 2008 | 2009 | 2010 | 2011 | 2012 | 2013 | 2014 | 2015 | 2016 | 2017 | 2018 | 2019 | 2020 |
|---|---|---|---|---|---|---|---|---|---|---|---|---|---|---|---|---|---|---|---|
|
Food |
91.51 | 90.81 | 91.82 | 91.91 | 91.69 | 91.02 | 91.37 | 91.53 | 91.31 | 91.43 | 91.30 | 89.16 | 89.83 | 88.60 | 88.50 | 87.70 | 86.50 | 88.00 | 69.41 |
|
Housing |
89.37 | 89.20 | 90.19 | 89.93 | 89.76 | 89.95 | 89.87 | 87.82 | 89.62 | 89.67 | 87.49 | 84.48 | 85.55 | 86.80 | 87.20 | 85.50 | 81.60 | 81.70 | 73.02 |
|
Shelter |
76.80 | 75.94 | 74.23 | 73.41 | 72.99 | 72.55 | 73.62 | 73.92 | 75.96 | 77.99 | 77.52 | 75.18 | 73.42 | 71.80 | 70.00 | 69.20 | 63.45 | 62.46 | 65.96 |
|
Apparel |
53.30 | 52.26 | 52.46 | 53.85 | 53.12 | 53.20 | 53.60 | 50.72 | 55.30 | 55.78 | 51.93 | 52.75 | 55.24 | 59.80 | 60.70 | 59.00 | 56.10 | 60.60 | 56.46 |
|
Transportation |
92.17 | 92.61 | 93.94 | 92.26 | 92.33 | 91.77 | 90.47 | 86.75 | 89.88 | 90.60 | 90.55 | 88.62 | 90.14 | 90.90 | 90.30 | 88.40 | 85.40 | 86.00 | 76.60 |
|
Medical care |
90.38 | 88.90 | 88.53 | 82.03 | 80.16 | 76.99 | 75.91 | 70.34 | 69.09 | 65.36 | 62.72 | 58.51 | 53.30 | 48.00 | 47.40 | 49.70 | 48.10 | 47.20 | 40.81 |
|
Recreation |
85.21 | 85.12 | 85.68 | 85.76 | 85.32 | 84.14 | 84.47 | 78.47 | 83.53 | 82.64 | 82.42 | 80.73 | 81.24 | 81.20 | 79.80 | 79.10 | 77.20 | 76.80 | 62.64 |
|
Education and communication |
81.85 | 82.08 | 82.19 | 81.43 | 80.61 | 81.21 | 82.76 | 83.61 | 88.00 | 91.04 | 89.13 | 87.89 | 88.11 | 87.40 | 85.60 | 85.70 | 85.80 | 87.10 | 82.24 |
|
Other goods and services |
92.07 | 91.84 | 92.26 | 92.04 | 92.66 | 91.57 | 91.72 | 89.68 | 90.83 | 90.52 | 90.72 | 88.74 | 87.85 | 85.90 | 87.50 | 87.50 | 83.10 | 82.30 | 65.21 |
|
Source: U.S. Bureau of Labor Statistics. |
|||||||||||||||||||
Declining response rates negatively affect the medical price indexes in two ways. First, because fewer responses mean the indexes are based on less data, lower response rates can cause greater variance in index estimates. When a sample is smaller, price movements of specific quotes in that sample have a greater impact on index values, and the price change in the sample becomes a less reliable indicator of the true price change in the full universe of prices. So, a smaller sample size makes it harder to distinguish real price trends from sample noise.
Besides increasing sample variability, declining response rates may change the sample in such a way that the overall sample of collected price data becomes less representative. For example, if response rates were to fall for one physician payer type (self-pay, private insurance, or Medicare) more than for other payer types,2 the overall index for physicians’ services would be biased against the one payer type for which response rates suffered disproportionately.
In 2018, in response to the problems posed by lower response rates, the CPI program started a new project to study whether claims data can be used to improve the accuracy of medical price indexes. In phase I of the project, we analyzed data from a single insurer, for a single city.3 The data had a 2-month lag. Considering the results of our analysis, we reached the following conclusions:
(1) Even with a lag, the CPIs for physicians’ services and outpatient hospital services can be improved by supplementing traditionally collected data with alternative data. As the lag increases, the accuracy of indexes calculated with supplemented data may decrease.
(2) There are discrepancies between geographic area-level data and national-level data with respect to the acceptable length of a lag.4
For phase II of this project, BLS purchased medical claims data that cover all geographic areas of the CPI for a 4-year period. The data have a 3-month lag, which is 1 month longer than the lag of the data analyzed during phase I. Unlike the latter data, which are for a single insurer, the data for phase II include multiple health insurance providers, which are masked by the data provider.
During phase II, we determined that more research was needed before we could confidently propose incorporating inpatient hospital data in the official estimation of the CPI. Because of patient characteristics or other factors that cannot be controlled for in using claims data, inpatient hospital prices can change drastically for the same service, resulting in high variation in prices even after controlling for several variables. For this reason, this article focuses only on the results for physicians’ services and outpatient hospital services.5
Currently, BLS collects price data directly from providers in a resource-intensive collection process. Data collectors often encounter barriers to collection such as busy respondents, gatekeepers, and confidentiality concerns, and these barriers limit cooperation with and access to the doctor or other respondent who can provide the data we need. Hospitals usually require data-release approval from high-level officials (such as chief financial officers or chief operating officers), and data collectors may have to contact a third party that handles the hospital’s billing to gather the necessary price data. These barriers prolong the process of data collection, requiring more time and effort than is necessary to collect other data items, and may still result in a refusal.
Providers of physicians’ services are selected randomly on the basis of results from the BLS Consumer Expenditure Surveys, and providers of hospital services are sampled from a dataset of the American Hospital Association. CPI data collectors work with the selected provider to identify a specific service on the basis of the billing history of that provider and record the service’s price-determining characteristics (such as insurance provider and plan type). In subsequent months, the provider is asked to provide a price for the same service, holding the characteristics of the original bill constant. The price is defined as the total amount paid (or expected to be paid) to the provider, including payments from both the patient and the insurance provider.
For a given geographic area and a given item category (called an entry-level item (ELI)), the collected price data are used to form a price relative that measures the one-period change in price for that item–area combination. For this research, we focus on the ELIs for physicians’ services and the outpatient portion of the ELI for hospital services.6 We calculate the price relative for the ELI as follows:
where  and
and  are the prices of good or service j in, respectively, period t and the base period; and
  is the item weight in the base period. The item weight is proportional to the share of expenditures on good or service j in the base period.7
The existing BLS methodology for collecting medical price data has some important advantages over the use of claims data. Under the existing methodology, the characteristics of each service are held constant in price collection and the data are published in real time. In addition, the data are intentionally designed to represent the universe of medical goods and services consumed by households.8 These features are generally not found in claims data, which represent only a subset of private insurance claims and are available only after a lag.
BLS purchased data, beginning in 2015, from a national health insurance aggregator. The data are a convenience sample of procedures performed by healthcare providers and reimbursed by insurers. The data cover all CPI geographic areas.9
For each CPI geographic area, we select a sample of 200 physician National Provider Identifiers (NPIs) and 10 hospital locations. The sample is selected by using probability proportion to size (PPS) based on expenditure. Medical services are defined by using Current Procedural Terminology (CPT) codes, and each service is broken out by the insurance company that pays for the service. Ten medical services are sampled via PPS for each physician, and 100 services are sampled at each outpatient hospital. This procedure results in the collection of up to 2,000 unique observations for physicians’ services and 1,000 unique observations for outpatient hospital services per area, per month. For physicians’ services, we also control for the most common place of service associated with a given NPI/insurer/CPT combination.
Each combination of medical provider, insurance provider, and medical service (and place of service for physicians’ services) can be thought of as a single observation. Each observation is supplied with an average price, which is calculated across all transactions at the outlet for the specified medical service and health insurance provider. The average prices are used to calculate the unit-value indexes.10 Included in the monthly data is a quantity value that reveals the number of transactions used in creating the average price. The average price and quantity values are updated each month over a 2-year pricing period, for a total of 24 months.
A limitation of a unit-value index is that it is estimated under the assumption that the average price is calculated across homogeneous goods. In reality, considerable price variation may exist at the level of provider, insurance company, or service. This variation is driven by unobserved factors, and changes in the mix of those factors will be measured as a price change in a unit-value index. Current CPI methodology is designed to capture price change by holding all else equal, so having price changes driven by unobserved factors is not ideal.
Using claims data has several additional drawbacks. If a provider does not bill any claims for a given service in a given month, we must impute the price for that service. Insurance claims data do not represent the entire eligible CPI market basket because they do not include Medicare Part B or out-of-pocket payments. As a result, claims data cannot serve as a full replacement for data collection, lessening the potential cost savings.
One clear advantage of claims data over traditionally collected data is their vastly larger sample size. Because of this advantage, BLS can potentially produce medical price indexes at a finer level (regional medical price indexes, physician indexes by specialty, etc.).
CPT codes were created by the American Medical Association (AMA) to describe medical procedures and standardize reporting.11 Currently, these codes are used by providers in medical claims processing and in data collection and analysis. There are four categories of CPT codes. Category I codes correspond to an established procedure or service and are grouped into subcategories based on procedure type and anatomy. The three additional categories of codes—Category II, Category III, and Proprietary Laboratory Analyses codes—are used to, respectively, measure performance, label new procedures, and describe proprietary laboratory procedures. CPT codes are updated three times a year by an editorial panel of clinical and industry experts. The codes are updated frequently so that emerging technologies and treatments can be added to the coding set in a timely manner.
Although CPT codes cover most physician services, they do not capture some services, as well as drugs and supplies that can be billed separately. These drugs, supplies, and additional services are covered by Healthcare Common Procedure Coding System (HCPCS) level II codes, which are maintained by the Centers for Medicare and Medicaid Services.12 CPT and HCPCS codes are used to control for specific services performed by physicians and outpatient providers and are captured in the medical claims data described earlier.
BLS purchased a second medical claims dataset that could be compared with the primary claims dataset. This second dataset, hereafter referred to as “comparison data,” is a fully separate dataset purchased from a data provider that is unrelated to the primary claims data (hereafter referred to as “medical claims data”). The comparison data have over 100 million claim lines for both physicians’ services and hospital services. BLS purchased 4 years of data, covering the period from January 2016 to March 2020. The items in the comparison data are defined similarly to those in the medical claims dataset—by identifying a particular combination of medical service and provider. However, unlike the medical claims data, the comparison data do not involve controlling for the insurer.
Each observation in the comparison data is associated with a monthly average price and the quantity of claims used to calculate the average price. The comparison data have a larger sample size than the medical claims data, but they have a much greater time lag (roughly 9 months). Because of this lag, the comparison data are not suitable for use in production, but their robust sample size makes them appropriate for comparison.
The medical claims data contain a sample of data rather than a complete data frame. We develop a sampling methodology that the data provider uses to select observations. We use PPS without replacement to select medical providers, and we use total revenue during the previous 12 months as a measure of revenue size in our probability calculations. Before BLS receives the medical claims data, the data provider removes claim-level outliers.13
The medical claims sample is fully rotated every 2 years, with 25 percent of geographic areas rotated every 6 months. This rotation is more frequent than the 4-year sample rotation currently used in the CPI. Increasing the rotation frequency aims to pick up new services and CPT code changes, because we are unable to crosswalk these codes as new code sets are released. The more frequent sample rotation is an improvement over current procedure, which is limited by the cost of initiating a new sample.
The month preceding the rotation month is a link month used to create relatives for the rotation month. For example, in July, the data provider would provide new outlets and observations in the rotating geographic areas, along with average prices corresponding to April. The data provider would also provide prices for the new outlets and observations corresponding to March, the link month, so that BLS would have a March-to-April relative to use in April.
We compared the sample distribution of the medical claims data with the distributions of the comparison data and, if available, data from other third-party sources. The distributions of outlets and services for the medical claims data, the comparison data, and the data from third-party sources are close. The fact that two large data sources such as the medical claims data and the comparison data show similar distributions across provider types and services may suggest that these sources reasonably represent the market. It could also indicate that both datasets source information from overlapping data providers. CPI data seem to oversample the more common categories (as illustrated in the next two tables), which indicates that integrating claims data offers potential advantages.
Table 1 shows the distributions of outlet specialties for the medical claims data, the comparison data, and the CPI data. These distributions are compared with data from the American Association of Medical Colleges (AAMC) Physician Specialty Data Report.14 The columns for the medical claims data, the comparison data, and the CPI data show the percentage of observations in each physician specialty. The columns for the medical claims data and the comparison data cover the entirety of 2016 and 2017. The columns for the AAMC data indicate the percentage of active physicians in each specialty. The AAMC data are for December 2015 and December 2017, and the CPI data are for July 2016 and July 2017. As noted in table 1, the categorical divisions among the medical claims data, the comparison data, the AAMC data, and the CPI data are slightly different. Some of the divergence among the data sources could be driven by different specialty mappings.
| Category | 2015 AAMC data | 2016 medical claims data | 2016 comparison data | 2016 CPI data | 2017 AAMC data | 2017 medical claims data | 2017 comparison data | 2017 CPI data |
|---|---|---|---|---|---|---|---|---|
| Allergy/immunology | 0.5 | 2.1 | 1.0 | 0.4 | 0.5 | 2.1 | 1.1 | 0.3 |
| Anesthesiology | 5.1 | 0.7 | 6.8 | 0.1 | 5.0 | 0.7 | 6.8 | 0.2 |
| Cardiovascular disease | 2.7 | 1.7 | 2.4 | 1 | 2.6 | 1.8 | 2.5 | 1 |
| Dermatology | 1.5 | 2.6 | 2.7 | 1.7 | 1.4 | 2.7 | 2.8 | 1.7 |
| Emergency medicine | 4.8 | 1 | 4.4 | 1 | 5.0 | 1 | 4.6 | 1 |
| Endocrinology and metabolism | 0.7 | 1 | 0.9 | 1 | 0.8 | 1 | 1.0 | 1 |
| Family practice | 13.6 | 9.6 | 9.5 | 28.5 | 13.4 | 8.9 | 9.4 | 26.8 |
| Gastroenterology | 1.7 | 1.8 | 2.4 | 1 | 1.7 | 1.7 | 2.4 | 1 |
| Internal medicine | 13.3 | 6.6 | 7.1 | 30.6 | 13.0 | 6.2 | 7.4 | 34.4 |
| Medical doctor—MD (NEC) | 1 | 1 | 2.8 | 1 | 1 | 1 | 1.9 | 1 |
| Neurology | 1.5 | 2.1 | 1 | 3.6 | 1.5 | 2.1 | 1 | 3.6 |
| Obstetrics and gynecology | 5.1 | 4.1 | 7.7 | 1.6 | 5.0 | 4.5 | 7.7 | 2.6 |
| Oncology—hematology | 1.6 | 9.2 | 1 | 1 | 1.7 | 9.5 | 1 | 1 |
| Oncology—radiation | 0.6 | 2.0 | 1 | 1.9 | 0.6 | 1.7 | 1 | 1.0 |
| Other facility (NEC) | 1 | 1 | 2.0 | 1 | 1 | 1 | 2.5 | 1 |
| Other specialty | 1 | 1 | 1 | 6.5 | 1 | 1 | 1 | 4.3 |
| Otolaryngology | 1.2 | 1.5 | 2.2 | 0.7 | 1.1 | 1.5 | 2.1 | 0.8 |
| Pathology | 1 | 9.0 | 2.9 | 0.1 | 1 | 6.8 | 2.7 | 0.0 |
| Pediatric medicine | 6.9 | 5.2 | 7.9 | 9.0 | 6.7 | 6.2 | 8.2 | 9.1 |
| Plastic/maxillofacial surgery | 0.9 | 1 | 1 | 3.2 | 0.9 | 1 | 1 | 2.5 |
| Psychiatry | 4.4 | 0.7 | 1.7 | 1.4 | 4.3 | 0.9 | 1.9 | 2.9 |
| Radiology | 3.3 | 11.1 | 6.2 | 2.0 | 3.2 | 11.6 | 5.7 | 0.9 |
| Rheumatology | 0.6 | 3.2 | 1 | 1 | 0.6 | 3.6 | 1 | 1 |
| Single or multispecialty clinic or group practice | 1 | 6.4 | 2.7 | 1 | 1 | 6.3 | 2.3 | 1 |
| Surgery—general | 2.9 | 0.7 | 1 | 2.8 | 2.8 | 0.6 | 1 | 2.2 |
| Surgery—orthopedic | 2.4 | 2.0 | 6.0 | 3.1 | 2.6 | 2.0 | 6.0 | 4.6 |
| Urgent care facility | 1 | 1 | 1.1 | 1 | 1 | 1 | 1.5 | 1 |
| Urology | 1.2 | 0.9 | 1.2 | 0.4 | 1.2 | 0.9 | 1.2 | 0.1 |
| 1 Category does not exist for corresponding data source. Note: The AAMC data are for December 2015 and December 2017, and the CPI data are for July 2016 and July 2017. Data in columns may not add up to 100 percent because smaller categories are omitted for brevity. AAMC = Association of American Medical Colleges; CPI = Consumer Price Index; NEC = not elsewhere classified. Source: U.S. Bureau of Labor Statistics, Association of American Medical Colleges, and national health insurance aggregator. | ||||||||
The distributions for the AAMC data, the comparison data, and the medical claims data are close, except for measures of expenditure in the fields of pathology, anesthesiology, and radiology. According to these distributions, the CPI oversamples specialties in family practice and internal medicine, the largest categories, and undersamples specialties in radiology, pathology, and obstetrics and gynecology. The small deviations across the medical claims data, the comparison data, and the AAMC data suggest that the comparison data and the medical claims data may reasonably represent physicians’ services in terms of outlet specialty.
Physicians’ services and outpatient hospital services are identified by using CPT codes. The AMA manages CPT codes and groups similar codes into larger CPT subcategories. Table 2 shows the distribution of CPT subcategories by expenditure weight. Relative to the medical claims data and the comparison data, the CPI oversamples evaluation and management (E/M) services. This leads to the CPI undersampling the other categories. E/M services also represent the largest category of services in the comparison data and the medical claims data. The category is rather broad, covering everything from routine office visits to psychiatric care. BLS dependence on respondent cooperation may be the cause of this oversampling of E/M services. To minimize respondent burden, field staff often price a common or simple service, and this service is likely to fall under the E/M category.
| CPT subcategory | 2016 | 2017 | ||||
|---|---|---|---|---|---|---|
| Medical claims data | Comparison data | CPI data | Medical claims data | Comparison data | CPI data | |
| Evaluation and management | 33.7 | 37.0 | 72.5 | 34.7 | 37.1 | 75.1 |
| Anesthesia | 0.3 | 6.5 | 0.0 | 0.2 | 6.4 | 0.0 |
| Surgery | 7.5 | 20.4 | 9.1 | 7.3 | 19.8 | 8.8 |
| Radiology | 14.0 | 7.8 | 4.5 | 14.6 | 7.7 | 3.9 |
| Pathology and laboratory medicine | 10.5 | 5.5 | 4.7 | 8.1 | 5.6 | 4.3 |
| Medicine | 9.4 | 12.5 | 7.2 | 9.2 | 12.4 | 6.2 |
| HCPCS level 2 | 24.6 | 10.3 | 2.1 | 25.8 | 10.6 | 1.6 |
| Note: CPT = Current Procedural Terminology; CPI = Consumer Price Index; HCPCS = Healthcare Common Procedure Coding System. Source: U.S. Bureau of Labor Statistics, American Medical Association, and Centers for Medicare and Medicaid Services. | ||||||
The expenditure weight for comparison data in surgery is higher than the corresponding weights for the other two data sources shown in table 2. The expenditure weight for HCPCS medical claims is likely overstated in our analysis. Working with the data provider, we found that our sampling procedure oversamples HCPCS level II codes, and we are currently exploring possible solutions to this oversampling.
Table 3 shows the distribution of outpatient hospital services by expenditure weight in the medical claims data and the comparison data. Here, a large expenditure difference is observed between the two data sources for surgery codes. Again, this difference is due, in part, to the oversampling of HCPCS codes. Apart from the surgery and HCPCS codes, the two data sources generally align with each other.
| CPT subcategory | 2016 | 2017 | ||
|---|---|---|---|---|
| Medical claims data | Comparison data | Medical claims data | Comparison data | |
| Evaluation and management | 16.1 | 10.5 | 16.2 | 11.0 |
| Anesthesia | 0.0 | 0.1 | 0.0 | 0.1 |
| Surgery | 9.5 | 28.4 | 9.7 | 28.1 |
| Radiology | 23.9 | 18.8 | 23.1 | 18.3 |
| Pathology and laboratory medicine | 7.0 | 8.9 | 7.3 | 8.7 |
| Medicine | 13.8 | 13.2 | 13.8 | 13.2 |
| HCPCS level 2 | 29.6 | 20.1 | 30.0 | 20.6 |
| Note: CPT = Current Procedural Terminology; HCPCS = Healthcare Common Procedure Coding System. Source: U.S. Bureau of Labor Statistics, American Medical Association, and Centers for Medicare and Medicaid Services. | ||||
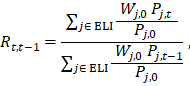
In the research stage of this project, we experimented with several index methodologies,15 including methodologies for calculating a mix of chained and unchained indexes and superlative indexes. (See also appendix.) Our research primarily focused on two methodologies. The first methodology involves the calculation of a chained Törnqvist index:

where  and
and  are the prices for observation i in, respectively, period t and period t – 1; and
  and
and  are the expenditure shares for observation i in, respectively, period t and period t – 1.
The second methodology involves the calculation of an unchained Lowe index:
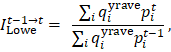
where  is the average calendar-year quantity for observation i. We construct two versions of the Lowe index. The first version uses the base-year quantities for the entire 2-year period during which an observation is in the sample. We also construct an annually chained Lowe index that uses the average monthly quantity from the prior year. We refer to this methodology as a “mixed-quantity” methodology, because it uses the sampling-period quantities in the first year of pricing and an average of first-year quantities in the second year of pricing.
Using claims data in the calculation of a price index presents several challenges. There can be substantial variation in prices for a given service. Changes in the average price for a given provider–service combination can be caused by redrawing a sample from the same underlying price distribution rather than by a shift in the actual price distribution. This problem is particularly pronounced when the number of claims used to calculate an average price is small, because some additional price-determining characteristics (e.g., patient age or health) are either not observed or not controlled for in our methodology. The problem cannot be solved simply by controlling for additional variables, because doing so would increase the likelihood of the data containing no claims for a given provider–service combination in a month.
Although some theoretical work has addressed the effect of price dispersion on price indexes, this work assumes that an identical product is being sold at different prices because of market frictions.16 This formulation differs from the case of medical care, where differences in prices for a given provider–service combination are due to unobserved quality differences. For example, the average price of a given service in a given month can increase because the patients who seek that service during that month happen to be sicker. In cases in which “big data” (e.g., scanner data) are used to calculate price indexes, products are defined at a very granular level, and the calculation of average price does not involve averaging over potentially different products (as is the case with medical care).
If there are no claims for a sampled item in a given month, a price relative cannot be calculated. In this case, we impute the missing current-period price by using the aggregated price relative for the corresponding combination of ELI, geographic area, and data source in the given month. This procedure is consistent with standard CPI methodology.
BLS additionally removes outliers within the medical claims data at the average-price level and the price-relative level. At the average-price level, we set a minimum price of $1 for physicians’ services and outpatient hospital services, removing any observations below this price level. After an average price is removed, it is imputed. At the price-relative level, we calculate the average price change and remove any observations with a price relative of ±3 standard deviations.
In this section, we first review unlagged indexes that show price changes based on when services were delivered rather than on when the data were received. In analyzing differences in the results, we examine various statistics to determine the proximity of the medical claims indexes and the CPI to the comparison index (i.e., the index calculated with comparison data). These statistics include the total index change from start month to end month, the annualized change during that period, the sum of squared errors (SSE) between the index being analyzed and the comparison index, and the SSE of the index relative between the index being analyzed and the comparison index.
In assessing index differences, it is important to analyze the SSE scores for both the index relative (how close the indexes are on a month-to-month basis) and the index value (how close the indexes are throughout the entire period). A one-time level shift in the index value of one index may result in a persistent difference between that index and other indexes. The SSE based on the index relative does not contain persistent differences when a level shift occurs.
Below, we begin by reviewing the index results for private insurance indexes, which are experimental price indexes created by using only private insurance claims data. Whenever possible, we use a CPI for private insurance rather than the published CPI that includes all payers. Then, we combine the private insurance indexes with CPI self-pay and Medicare data to create all-payer indexes.
Chart 2a shows the private insurance indexes for physicians’ services. These indexes are created only with private insurance data. As shown in the chart, the comparison index increases steadily over time, whereas the CPI for private insurance first increases quickly and then decreases, showing smaller price changes than the comparison index from 2018 to the end of the period. The mixed-quantity, Törnqvist, and Lowe indexes all track closely with one another and with the comparison index, although they grow more slowly in later years. However, the CPI for private insurance moves differently from the other private insurance indexes. This could be due to the brief rise observed at the beginning of the series,17 as well as to other payer types imputing prices within the private-insurance-only index.18
| Date | Comparison unchained Lowe | Consumer Price Index | Medical claims unchained Lowe | Medical claims mixed quantity | Medical claims chained Törnqvist |
|---|---|---|---|---|---|
|
Jan 2016 |
100.00 | 100.00 | 100.00 | 100.00 | 100.00 |
|
Feb 2016 |
100.20 | 100.06 | 99.87 | 99.86 | 99.93 |
|
Mar 2016 |
99.99 | 100.20 | 99.80 | 99.82 | 99.88 |
|
Apr 2016 |
100.25 | 100.39 | 99.71 | 99.76 | 99.84 |
|
May 2016 |
100.36 | 100.81 | 100.10 | 100.05 | 100.20 |
|
Jun 2016 |
100.31 | 101.10 | 100.21 | 100.27 | 100.29 |
|
Jul 2016 |
100.48 | 102.00 | 100.48 | 100.36 | 100.51 |
|
Aug 2016 |
100.54 | 102.29 | 100.54 | 100.43 | 100.68 |
|
Sep 2016 |
100.47 | 102.28 | 100.85 | 100.69 | 100.77 |
|
Oct 2016 |
100.54 | 102.24 | 100.85 | 100.71 | 100.81 |
|
Nov 2016 |
100.61 | 102.61 | 101.18 | 101.08 | 101.08 |
|
Dec 2016 |
100.50 | 102.63 | 101.45 | 101.31 | 101.40 |
|
Jan 2017 |
100.78 | 102.95 | 101.69 | 101.53 | 101.63 |
|
Feb 2017 |
101.10 | 102.82 | 101.69 | 101.36 | 101.57 |
|
Mar 2017 |
101.07 | 103.06 | 101.61 | 101.19 | 101.50 |
|
Apr 2017 |
101.15 | 102.36 | 101.59 | 101.23 | 101.52 |
|
May 2017 |
101.29 | 102.33 | 101.55 | 101.27 | 101.50 |
|
Jun 2017 |
101.37 | 101.39 | 101.62 | 101.27 | 101.58 |
|
Jul 2017 |
101.31 | 101.42 | 101.68 | 101.48 | 101.64 |
|
Aug 2017 |
101.50 | 101.37 | 101.54 | 101.08 | 101.50 |
|
Sep 2017 |
101.54 | 101.28 | 101.97 | 101.52 | 101.88 |
|
Oct 2017 |
101.95 | 101.17 | 102.13 | 101.66 | 101.96 |
|
Nov 2017 |
102.22 | 100.66 | 102.29 | 101.77 | 102.08 |
|
Dec 2017 |
102.43 | 100.75 | 102.88 | 102.19 | 102.66 |
|
Jan 2018 |
102.50 | 100.79 | 103.16 | 102.38 | 102.91 |
|
Feb 2018 |
102.59 | 100.92 | 103.08 | 102.41 | 102.81 |
|
Mar 2018 |
102.63 | 100.96 | 103.15 | 102.38 | 102.84 |
|
Apr 2018 |
102.72 | 101.04 | 102.93 | 102.12 | 102.62 |
|
May 2018 |
102.58 | 101.10 | 102.97 | 102.48 | 102.69 |
|
Jun 2018 |
102.79 | 101.02 | 103.09 | 102.71 | 102.86 |
|
Jul 2018 |
103.14 | 100.86 | 103.10 | 102.46 | 102.86 |
|
Aug 2018 |
103.41 | 100.81 | 103.15 | 102.61 | 102.91 |
|
Sep 2018 |
103.28 | 101.03 | 103.57 | 102.86 | 103.36 |
|
Oct 2018 |
103.51 | 100.91 | 103.51 | 103.11 | 103.18 |
|
Nov 2018 |
103.69 | 100.74 | 103.58 | 103.12 | 103.20 |
|
Dec 2018 |
103.67 | 100.75 | 103.93 | 103.78 | 103.44 |
|
Jan 2019 |
104.21 | 101.34 | 104.16 | 103.89 | 103.64 |
|
Feb 2019 |
104.41 | 101.58 | 104.06 | 103.80 | 103.59 |
|
Mar 2019 |
104.45 | 101.05 | 103.60 | 103.34 | 103.13 |
|
Apr 2019 |
104.66 | 101.34 | 103.90 | 103.63 | 103.45 |
|
May 2019 |
104.80 | 101.42 | 104.07 | 103.78 | 103.64 |
|
Jun 2019 |
104.92 | 101.49 | 104.31 | 104.05 | 103.84 |
|
Jul 2019 |
105.04 | 101.58 | 104.11 | 103.85 | 103.52 |
|
Aug 2019 |
105.21 | 101.53 | 104.20 | 103.98 | 103.58 |
|
Sep 2019 |
105.59 | 101.96 | 103.69 | 103.56 | 103.15 |
|
Oct 2019 |
105.59 | 102.08 | 104.05 | 103.89 | 103.42 |
|
Nov 2019 |
105.83 | 102.11 | 104.33 | 104.14 | 103.64 |
|
Dec 2019 |
106.07 | 102.13 | 104.63 | 104.39 | 103.98 |
|
Jan 2020 |
105.57 | 102.04 | 104.73 | 104.60 | 104.22 |
|
Feb 2020 |
105.82 | 102.43 | 104.42 | 104.53 | 104.13 |
|
Mar 2020 |
105.90 | 102.50 | 104.71 | 104.78 | 104.32 |
|
Source: U.S. Bureau of Labor Statistics. |
|||||
For the private-insurance-only indexes for physicians’ services, the annualized increase for the comparison index is higher (by 0.3 percentage point to 0.4 percentage point) than the increases for the other medical claims indexes. (See table 4a.) The comparison index increases at an annualized rate of 1.4 percent, compared with 1.1 percent for the medical claims mixed-quantity index. The medical claims unchained Lowe index has the smallest SSE score in terms of index value, and the medical claims chained Törnqvist index has the smallest SSE score in terms of index relative.
| Index by source and method | Total change (percent) | Annualized change (percent) | SSE index value | SSE index relative (×104) |
|---|---|---|---|---|
| Comparison unchained Lowe | 5.9 | 1.4 | 1 | 1 |
| Consumer Price Index | 2.5 | 0.6 | 277 | 53 |
| Medical claims unchained Lowe | 4.7 | 1.1 | 24 | 42 |
| Medical claims mixed quantity | 4.8 | 1.1 | 29 | 49 |
| Medical claims chained Törnqvist | 4.3 | 1.0 | 43 | 40 |
| 1 SSE scores are calculated relative to the comparison index. Note: SSE = sum of squared errors. Source: U.S. Bureau of Labor Statistics. | ||||
Chart 2b shows the published all-payer CPI for outpatient hospital services and the private-insurance-only comparison and medical claims indexes for the same services category. As seen in the chart, all indexes track closely with one another. (Outliers are removed from the insurer’s data; there are no outliers in the CPI or comparison data.)
| Date | Comparison unchained Lowe (insurance) | Consumer Price Index (all payers) | Medical claims unchained Lowe (insurance) | Medical claims mixed quantity (insurance) | Medical claims chained Törnqvist (insurance) |
|---|---|---|---|---|---|
|
Jan 2016 |
100.00 | 100.00 | 100.00 | 100.00 | 100.00 |
|
Feb 2016 |
99.99 | 100.39 | 100.52 | 100.28 | 100.21 |
|
Mar 2016 |
99.84 | 100.18 | 100.61 | 100.86 | 100.47 |
|
Apr 2016 |
98.74 | 100.24 | 100.71 | 100.82 | 100.27 |
|
May 2016 |
99.25 | 100.52 | 100.35 | 100.38 | 100.01 |
|
Jun 2016 |
99.28 | 100.46 | 101.36 | 101.44 | 100.56 |
|
Jul 2016 |
100.01 | 100.81 | 102.08 | 102.03 | 101.55 |
|
Aug 2016 |
101.59 | 102.19 | 102.13 | 102.20 | 102.17 |
|
Sep 2016 |
102.11 | 102.48 | 102.20 | 102.16 | 101.94 |
|
Oct 2016 |
101.97 | 102.67 | 102.87 | 102.74 | 102.22 |
|
Nov 2016 |
102.46 | 102.61 | 102.90 | 103.15 | 102.60 |
|
Dec 2016 |
103.42 | 102.60 | 102.93 | 103.62 | 102.23 |
|
Jan 2017 |
102.82 | 103.36 | 102.05 | 103.27 | 101.97 |
|
Feb 2017 |
102.67 | 104.73 | 102.81 | 103.45 | 102.46 |
|
Mar 2017 |
102.53 | 104.95 | 102.92 | 104.31 | 102.67 |
|
Apr 2017 |
103.11 | 106.23 | 103.51 | 105.19 | 103.25 |
|
May 2017 |
102.12 | 106.11 | 103.06 | 104.19 | 102.93 |
|
Jun 2017 |
101.86 | 106.61 | 104.08 | 105.18 | 104.28 |
|
Jul 2017 |
101.94 | 106.96 | 104.21 | 104.62 | 103.91 |
|
Aug 2017 |
103.46 | 106.83 | 104.49 | 104.81 | 103.92 |
|
Sep 2017 |
101.55 | 107.15 | 105.40 | 106.54 | 105.08 |
|
Oct 2017 |
102.28 | 107.62 | 105.74 | 106.28 | 105.08 |
|
Nov 2017 |
102.17 | 107.46 | 105.90 | 106.10 | 104.99 |
|
Dec 2017 |
102.14 | 107.56 | 106.06 | 106.22 | 104.89 |
|
Jan 2018 |
106.34 | 109.60 | 106.31 | 106.76 | 105.24 |
|
Feb 2018 |
106.69 | 109.83 | 106.98 | 107.39 | 106.00 |
|
Mar 2018 |
107.14 | 110.34 | 107.34 | 107.43 | 106.38 |
|
Apr 2018 |
107.27 | 110.51 | 106.83 | 107.03 | 106.09 |
|
May 2018 |
107.38 | 110.62 | 106.36 | 106.55 | 105.73 |
|
Jun 2018 |
107.58 | 111.21 | 107.19 | 107.33 | 106.40 |
|
Jul 2018 |
107.94 | 111.56 | 107.57 | 107.58 | 106.74 |
|
Aug 2018 |
107.90 | 110.92 | 108.22 | 107.98 | 107.47 |
|
Sep 2018 |
107.66 | 110.60 | 108.99 | 109.18 | 108.11 |
|
Oct 2018 |
109.25 | 110.81 | 109.60 | 109.76 | 108.87 |
|
Nov 2018 |
109.60 | 111.63 | 109.88 | 110.03 | 108.83 |
|
Dec 2018 |
109.60 | 111.89 | 110.30 | 110.52 | 109.36 |
|
Jan 2019 |
110.49 | 112.27 | 111.30 | 114.27 | 111.79 |
|
Feb 2019 |
111.63 | 112.16 | 111.44 | 114.43 | 111.52 |
|
Mar 2019 |
110.46 | 112.24 | 110.32 | 112.94 | 110.72 |
|
Apr 2019 |
110.37 | 111.56 | 110.65 | 112.95 | 110.94 |
|
May 2019 |
110.16 | 111.58 | 111.21 | 112.95 | 111.55 |
|
Jun 2019 |
111.66 | 111.28 | 112.26 | 112.74 | 112.27 |
|
Jul 2019 |
111.96 | 111.97 | 112.34 | 112.88 | 112.28 |
|
Aug 2019 |
112.89 | 113.21 | 112.80 | 113.22 | 113.02 |
|
Sep 2019 |
113.12 | 112.99 | 113.08 | 114.45 | 113.11 |
|
Oct 2019 |
113.72 | 114.08 | 112.86 | 114.67 | 112.46 |
|
Nov 2019 |
113.84 | 114.10 | 114.02 | 117.27 | 113.85 |
|
Dec 2019 |
113.18 | 114.12 | 113.55 | 117.90 | 113.39 |
|
Jan 2020 |
111.69 | 115.79 | 112.67 | 117.79 | 113.25 |
|
Feb 2020 |
112.74 | 116.12 | 112.97 | 116.07 | 113.04 |
|
Mar 2020 |
113.61 | 116.28 | 114.50 | 117.62 | 114.52 |
|
Source: U.S. Bureau of Labor Statistics. |
|||||
Table 4b presents metrics for index total change, annualized change, and SSE scores for outpatient hospital services. Consistent with the patterns observed in chart 2b, these metrics indicate that the four noncomparison indexes perform fairly similarly to the comparison index. The all-payer CPI and the mixed-quantity index end the period at a higher point than the comparison index and have higher SSE scores, whereas the Törnqvist index and the unchained Lowe index match more closely the comparison index.
| Index by source and method | Total change (percent) | Annualized change (percent) | SSE index value | SSE index relative (×104) |
|---|---|---|---|---|
| Comparison unchained Lowe | 13.6 | 3.9 | 1 | 1 |
| Consumer Price Index (all payers) | 16.3 | 3.6 | 375 | 39 |
| Medical claims unchained Lowe | 14.5 | 3.2 | 94 | 42 |
| Medical claims mixed quantity | 17.6 | 3.9 | 274 | 66 |
| Medical claims chained Törnqvist | 14.5 | 3.2 | 76 | 48 |
| 1 SSE scores are calculated relative to the comparison index. Note: SSE = sum of squared errors. Source: U.S. Bureau of Labor Statistics. | ||||
In this section, we construct all-payer price indexes by combining the private-insurance-only indexes with the CPIs for physicians’ services and outpatient hospital services for self-pay and Medicare payers. For example, by combining the medical claims unchained Lowe index for outpatient hospital services with the self-pay and Medicare index for outpatient hospital services, we create a hypothetical all-payer CPI that is supplemented with alternative data. The medical claims mixed-quantity index for outpatient hospital services is also separately combined with the CPI for outpatient hospital services. This model assumes that the medical claims data are representative of the private insurance market as a whole.
All-payer indexes are then compared with the comparison index and the CPIs. The comparison index also is combined with the self-pay and Medicare index in order to create a comparison all-payer index. The medical claims indexes and the CPIs are combined by using payer-type market-share data at the area level. Market shares are determined by using Small Area Health Insurance Estimates data from the U.S. Census Bureau. When the indexes are combined with data for the other payer types from the CPI (including self-pay and Medicare Part B data), the differences between them decrease. This is because the Medicare and self-pay portions of the indexes are based on the same data.
Chart 3a shows the comparison all-payer index and the medical claims all-payer indexes for physicians’ services. The all-payer CPI is the same as the official CPI. Throughout the period, there are only small differences between the comparison index and the medical claims indexes. From July 2017 onward, after exhibiting an initial rise, the all-payer CPI also tracks closely with the medical claims indexes, although slight gaps occur in two periods—one between March 2019 and September 2019, and another between September 2019 and February 2020. Once we lag the medical claims indexes (the CPI remains unlagged), these gaps shrink.
| Date | Comparison unchained Lowe | Consumer Price Index | Medical claims mixed quantity | Medical claims unchained Lowe | Medical claims chained Törnqvist |
|---|---|---|---|---|---|
|
Jan 2016 |
100.00 | 100.00 | 100.00 | 100.00 | 100.00 |
|
Feb 2016 |
100.16 | 100.32 | 100.19 | 100.05 | 100.12 |
|
Mar 2016 |
100.03 | 100.47 | 100.19 | 100.04 | 100.12 |
|
Apr 2016 |
100.39 | 100.55 | 100.33 | 100.15 | 100.27 |
|
May 2016 |
100.66 | 101.44 | 100.75 | 100.66 | 100.75 |
|
Jun 2016 |
100.68 | 101.82 | 100.99 | 100.78 | 100.86 |
|
Jul 2016 |
100.81 | 102.47 | 101.04 | 100.98 | 101.03 |
|
Aug 2016 |
100.90 | 103.03 | 101.12 | 101.06 | 101.19 |
|
Sep 2016 |
100.79 | 103.03 | 101.22 | 101.24 | 101.20 |
|
Oct 2016 |
100.70 | 102.83 | 101.18 | 101.12 | 101.11 |
|
Nov 2016 |
100.79 | 103.56 | 101.48 | 101.40 | 101.35 |
|
Dec 2016 |
100.78 | 103.67 | 101.71 | 101.64 | 101.63 |
|
Jan 2017 |
101.03 | 103.77 | 101.97 | 101.90 | 101.88 |
|
Feb 2017 |
101.32 | 103.89 | 101.92 | 101.94 | 101.87 |
|
Mar 2017 |
101.25 | 103.52 | 101.75 | 101.82 | 101.77 |
|
Apr 2017 |
101.17 | 102.42 | 101.65 | 101.67 | 101.64 |
|
May 2017 |
101.26 | 102.24 | 101.69 | 101.62 | 101.61 |
|
Jun 2017 |
101.29 | 101.84 | 101.67 | 101.65 | 101.64 |
|
Jul 2017 |
101.25 | 101.91 | 101.82 | 101.69 | 101.69 |
|
Aug 2017 |
101.42 | 102.18 | 101.53 | 101.63 | 101.62 |
|
Sep 2017 |
101.45 | 102.23 | 101.83 | 101.94 | 101.90 |
|
Oct 2017 |
101.75 | 102.20 | 101.97 | 102.09 | 101.99 |
|
Nov 2017 |
101.95 | 101.65 | 102.03 | 102.19 | 102.06 |
|
Dec 2017 |
102.11 | 101.84 | 102.36 | 102.64 | 102.50 |
|
Jan 2018 |
102.20 | 102.20 | 102.54 | 102.89 | 102.72 |
|
Feb 2018 |
102.22 | 102.58 | 102.49 | 102.78 | 102.59 |
|
Mar 2018 |
102.25 | 102.66 | 102.49 | 102.83 | 102.62 |
|
Apr 2018 |
102.34 | 102.74 | 102.32 | 102.69 | 102.47 |
|
May 2018 |
102.22 | 102.80 | 102.57 | 102.71 | 102.52 |
|
Jun 2018 |
102.35 | 102.72 | 102.72 | 102.78 | 102.62 |
|
Jul 2018 |
102.58 | 102.56 | 102.50 | 102.74 | 102.59 |
|
Aug 2018 |
102.69 | 102.49 | 102.53 | 102.70 | 102.54 |
|
Sep 2018 |
102.56 | 102.70 | 102.69 | 102.98 | 102.84 |
|
Oct 2018 |
102.73 | 102.58 | 102.87 | 102.94 | 102.71 |
|
Nov 2018 |
102.84 | 102.42 | 102.87 | 102.98 | 102.72 |
|
Dec 2018 |
102.84 | 102.42 | 103.36 | 103.24 | 102.90 |
|
Jan 2019 |
103.65 | 103.00 | 103.87 | 103.83 | 103.46 |
|
Feb 2019 |
103.90 | 103.26 | 103.93 | 103.87 | 103.55 |
|
Mar 2019 |
104.06 | 102.73 | 103.70 | 103.66 | 103.32 |
|
Apr 2019 |
104.24 | 103.03 | 103.95 | 103.91 | 103.59 |
|
May 2019 |
104.35 | 103.11 | 104.07 | 104.04 | 103.74 |
|
Jun 2019 |
104.47 | 103.18 | 104.29 | 104.24 | 103.91 |
|
Jul 2019 |
104.55 | 103.27 | 104.15 | 104.10 | 103.68 |
|
Aug 2019 |
104.68 | 103.22 | 104.25 | 104.17 | 103.73 |
|
Sep 2019 |
104.95 | 103.65 | 103.93 | 103.78 | 103.40 |
|
Oct 2019 |
104.95 | 103.77 | 104.18 | 104.05 | 103.61 |
|
Nov 2019 |
105.26 | 103.80 | 104.50 | 104.39 | 103.90 |
|
Dec 2019 |
105.45 | 103.82 | 104.70 | 104.63 | 104.16 |
|
Jan 2020 |
105.10 | 103.72 | 104.87 | 104.73 | 104.36 |
|
Feb 2020 |
105.28 | 104.12 | 104.82 | 104.50 | 104.30 |
|
Mar 2020 |
105.30 | 104.20 | 104.96 | 104.68 | 104.40 |
|
Source: U.S. Bureau of Labor Statistics. |
|||||
The difference in annualized changes between the all-payer indexes (0.0 percentage point to 0.2 percentage point) is smaller than the difference between the private-insurance-only indexes examined in the previous section. (See table 5a.) The medical claims mixed-quantity index has the smallest SSE score in terms of index value, and the medical claims chained Törnqvist index has the smallest SSE score in terms of index relative.
| Index by source and method | Total change (percent) | Annualized change (percent) | SSE index value | SSE index relative (×104) |
|---|---|---|---|---|
| Comparison unchained Lowe | 5.3 | 1.2 | 1 | 1 |
| Consumer Price Index | 4.2 | 1.0 | 84 | 51 |
| Medical claims unchained Lowe | 4.7 | 1.1 | 12 | 22 |
| Medical claims mixed quantity | 5.0 | 1.1 | 9 | 25 |
| Medical claims chained Törnqvist | 4.4 | 1.0 | 18 | 21 |
| 1 SSE scores are calculated relative to the comparison index. Note: SSE = sum of squared errors. Source: U.S. Bureau of Labor Statistics. | ||||
Chart 3b shows the comparison all-payer index and the medical claims all-payer indexes for outpatient hospital services. Again, the indexes trend similarly, ending the period at nearly the same point, although the mixed-quantity index ends at a slightly higher point than the other indexes.
| Date | Comparison unchained Lowe | Consumer Price Index | Medical claims unchained Lowe | Medical claims mixed quantity | Medical claims chained Törnqvist |
|---|---|---|---|---|---|
|
Jan 2016 |
100.00 | 100.00 | 100.00 | 100.00 | 100.00 |
|
Feb 2016 |
101.03 | 100.39 | 100.88 | 100.79 | 100.75 |
|
Mar 2016 |
100.69 | 100.18 | 100.95 | 101.14 | 100.88 |
|
Apr 2016 |
99.55 | 100.24 | 100.58 | 100.83 | 100.43 |
|
May 2016 |
100.11 | 100.52 | 100.25 | 100.58 | 100.26 |
|
Jun 2016 |
100.18 | 100.46 | 101.02 | 101.50 | 100.80 |
|
Jul 2016 |
100.73 | 100.81 | 101.58 | 101.90 | 101.50 |
|
Aug 2016 |
101.95 | 102.19 | 101.69 | 102.06 | 101.93 |
|
Sep 2016 |
102.49 | 102.48 | 101.84 | 102.16 | 101.93 |
|
Oct 2016 |
103.54 | 102.67 | 103.81 | 104.17 | 103.70 |
|
Nov 2016 |
103.89 | 102.61 | 103.90 | 104.52 | 104.01 |
|
Dec 2016 |
104.54 | 102.60 | 103.77 | 104.63 | 103.57 |
|
Jan 2017 |
104.08 | 103.36 | 103.16 | 104.17 | 103.26 |
|
Feb 2017 |
104.27 | 104.73 | 104.28 | 104.85 | 104.13 |
|
Mar 2017 |
104.16 | 104.95 | 104.38 | 105.55 | 104.30 |
|
Apr 2017 |
104.87 | 106.23 | 105.09 | 106.49 | 105.04 |
|
May 2017 |
104.07 | 106.11 | 104.69 | 105.79 | 104.82 |
|
Jun 2017 |
104.13 | 106.61 | 105.84 | 106.50 | 105.87 |
|
Jul 2017 |
103.94 | 106.96 | 105.71 | 105.96 | 105.48 |
|
Aug 2017 |
105.27 | 106.83 | 106.16 | 106.39 | 105.78 |
|
Sep 2017 |
103.91 | 107.15 | 106.97 | 107.71 | 106.70 |
|
Oct 2017 |
104.45 | 107.62 | 107.08 | 107.42 | 106.59 |
|
Nov 2017 |
104.60 | 107.46 | 107.42 | 107.61 | 106.80 |
|
Dec 2017 |
104.57 | 107.56 | 107.54 | 107.68 | 106.74 |
|
Jan 2018 |
107.81 | 109.60 | 107.75 | 108.31 | 107.08 |
|
Feb 2018 |
108.15 | 109.83 | 108.43 | 108.85 | 107.74 |
|
Mar 2018 |
109.08 | 110.34 | 109.21 | 109.56 | 108.59 |
|
Apr 2018 |
109.16 | 110.51 | 108.94 | 109.14 | 108.38 |
|
May 2018 |
109.27 | 110.62 | 108.71 | 108.80 | 108.14 |
|
Jun 2018 |
110.13 | 111.21 | 109.96 | 110.15 | 109.34 |
|
Jul 2018 |
110.49 | 111.56 | 110.27 | 110.34 | 109.70 |
|
Aug 2018 |
111.08 | 110.92 | 111.37 | 111.44 | 110.88 |
|
Sep 2018 |
110.98 | 110.60 | 112.10 | 112.43 | 111.47 |
|
Oct 2018 |
112.11 | 110.81 | 112.48 | 112.95 | 112.05 |
|
Nov 2018 |
112.40 | 111.63 | 112.63 | 113.15 | 112.04 |
|
Dec 2018 |
112.36 | 111.89 | 113.01 | 113.63 | 112.39 |
|
Jan 2019 |
113.22 | 112.27 | 113.95 | 116.68 | 114.28 |
|
Feb 2019 |
114.12 | 112.16 | 114.11 | 116.71 | 114.11 |
|
Mar 2019 |
113.31 | 112.24 | 113.33 | 115.57 | 113.58 |
|
Apr 2019 |
113.28 | 111.56 | 113.66 | 115.46 | 113.73 |
|
May 2019 |
112.64 | 111.58 | 113.63 | 115.01 | 113.69 |
|
Jun 2019 |
113.75 | 111.28 | 114.15 | 114.62 | 114.20 |
|
Jul 2019 |
114.15 | 111.97 | 114.50 | 114.96 | 114.37 |
|
Aug 2019 |
114.82 | 113.21 | 114.99 | 115.02 | 114.93 |
|
Sep 2019 |
114.99 | 112.99 | 115.10 | 116.16 | 114.99 |
|
Oct 2019 |
115.53 | 114.08 | 114.95 | 116.48 | 114.66 |
|
Nov 2019 |
115.61 | 114.10 | 115.92 | 118.52 | 115.68 |
|
Dec 2019 |
115.19 | 114.12 | 115.59 | 119.08 | 115.34 |
|
Jan 2020 |
115.14 | 115.79 | 116.16 | 120.29 | 116.37 |
|
Feb 2020 |
116.27 | 116.12 | 116.70 | 119.27 | 116.51 |
|
Mar 2020 |
116.93 | 116.28 | 117.84 | 120.30 | 117.62 |
|
Source: U.S. Bureau of Labor Statistics. |
|||||
Again, in the case of outpatient hospital services, the metrics for index total change, annualized change, and SSE scores are similar. (See table 5b.) The Törnqvist index for outpatient hospital services has the smallest SSE score in terms of index value, and the CPI has the lowest SSE score in terms of index relative.
| Index by source and method | Total change (percent) | Annualized change (percent) | SSE index value | SSE index relative (×104) |
|---|---|---|---|---|
| Comparison unchained Lowe | 16.9 | 3.7 | 1 | 1 |
| Consumer Price Index | 16.3 | 3.6 | 120 | 23 |
| Medical claims unchained Lowe | 17.8 | 3.9 | 52 | 25 |
| Medical claims mixed quantity | 20.3 | 4.4 | 182 | 38 |
| Medical claims chained Törnqvist | 17.6 | 3.9 | 42 | 26 |
| 1 SSE scores are calculated relative to the comparison index. Note: SSE = sum of squared errors. Source: U.S. Bureau of Labor Statistics. | ||||
A key characteristic of alternative medical claims data is their lag. Any alternative data used to supplement traditionally collected CPI data require processing by a vendor. Claims data are based on fully adjudicated claims, which can take several months to finalize. This processing results in data that are lagged by several months before they can be delivered to BLS. Given current BLS methodology for calculating CPIs for physicians’ services and outpatient hospital services, this lag is a weakness of using alternative data. However, the CPI program currently uses lagged data for other items. In our market research, we found multiple sources of data with a lag ranging from 2 months to 9 months. This lag is counted from the date of service of the medical claim.
The claims data used in this project have a 3-month lag, so data for a doctor’s office visit with a date of service in, say, January would not be delivered to BLS until April. BLS would use these January data to calculate April indexes, showing December-to-January price relatives in the April index, which would then be published in May. This section examines the behavior of hypothetical all-payer CPIs that are based on medical claims data with a 3-month lag. These data are combined with unlagged CPI self-pay and Medicare data. The resulting all-payer indexes best represent how lagged claims data would look if used in the calculation of official CPIs.
The charts and tables presented below are based on medical claims data, comparison data, and CPI data at the national level. Chart 4a presents the CPI, the lagged medical claims indexes, and the comparison index for physicians’ services. As seen in the chart, the medical claims indexes and the comparison index trend similarly, with no major jumps. After exhibiting an initial rise, the CPI for physicians’ services runs below the comparison index and increases steadily toward the end of the period. This pattern may be due to the fact that, from April 2018 onward, BLS began using data from the Medical Expenditure Panel Survey to adjust the weights of payer types included in the CPI for physicians’ services. The resulting index better reflects current market weights by increasing the share of payments covered by private insurance relative to the shares of payments made by uninsured people and payments covered by Medicare Part B.
| Date | Comparison unchained Lowe | Consumer Price Index | Medical claims unchained Lowe (lagged) | Medical claims mixed quantity (lagged) | Medical claims chained Törnqvist (lagged) |
|---|---|---|---|---|---|
|
Apr 2016 |
100.00 | 100.00 | 100.00 | 100.00 | 100.00 |
|
May 2016 |
100.27 | 100.89 | 100.10 | 100.10 | 100.15 |
|
Jun 2016 |
100.29 | 101.26 | 100.13 | 100.14 | 100.18 |
|
Jul 2016 |
100.42 | 101.91 | 100.06 | 100.10 | 100.17 |
|
Aug 2016 |
100.51 | 102.47 | 100.44 | 100.39 | 100.51 |
|
Sep 2016 |
100.40 | 102.46 | 100.45 | 100.51 | 100.50 |
|
Oct 2016 |
100.31 | 102.26 | 100.51 | 100.42 | 100.53 |
|
Nov 2016 |
100.40 | 102.99 | 100.59 | 100.51 | 100.69 |
|
Dec 2016 |
100.39 | 103.10 | 100.88 | 100.73 | 100.83 |
|
Jan 2017 |
100.64 | 103.20 | 100.98 | 100.89 | 100.95 |
|
Feb 2017 |
100.92 | 103.32 | 101.26 | 101.19 | 101.18 |
|
Mar 2017 |
100.86 | 102.95 | 101.39 | 101.31 | 101.35 |
|
Apr 2017 |
100.78 | 101.86 | 101.48 | 101.41 | 101.44 |
|
May 2017 |
100.86 | 101.67 | 101.44 | 101.27 | 101.34 |
|
Jun 2017 |
100.89 | 101.28 | 101.36 | 101.13 | 101.27 |
|
Jul 2017 |
100.86 | 101.35 | 101.34 | 101.17 | 101.28 |
|
Aug 2017 |
101.03 | 101.62 | 101.35 | 101.26 | 101.31 |
|
Sep 2017 |
101.06 | 101.66 | 101.40 | 101.26 | 101.36 |
|
Oct 2017 |
101.35 | 101.64 | 101.44 | 101.41 | 101.41 |
|
Nov 2017 |
101.55 | 101.09 | 101.35 | 101.11 | 101.32 |
|
Dec 2017 |
101.71 | 101.28 | 101.67 | 101.43 | 101.60 |
|
Jan 2018 |
101.80 | 101.64 | 101.76 | 101.50 | 101.69 |
|
Feb 2018 |
101.82 | 102.01 | 101.84 | 101.57 | 101.77 |
|
Mar 2018 |
101.86 | 102.09 | 101.93 | 101.64 | 101.85 |
|
Apr 2018 |
101.94 | 102.18 | 102.15 | 101.80 | 102.04 |
|
May 2018 |
101.82 | 102.24 | 102.08 | 101.80 | 101.96 |
|
Jun 2018 |
101.95 | 102.15 | 102.11 | 101.76 | 101.96 |
|
Jul 2018 |
102.18 | 102.00 | 101.92 | 101.55 | 101.77 |
|
Aug 2018 |
102.29 | 101.93 | 101.86 | 101.72 | 101.73 |
|
Sep 2018 |
102.16 | 102.14 | 101.93 | 101.87 | 101.83 |
|
Oct 2018 |
102.33 | 102.02 | 101.93 | 101.68 | 101.83 |
|
Nov 2018 |
102.44 | 101.85 | 101.96 | 101.79 | 101.86 |
|
Dec 2018 |
102.43 | 101.86 | 102.27 | 101.98 | 102.20 |
|
Jan 2019 |
103.24 | 102.43 | 102.64 | 102.57 | 102.47 |
|
Feb 2019 |
103.50 | 102.69 | 102.81 | 102.70 | 102.62 |
|
Mar 2019 |
103.65 | 102.17 | 103.18 | 103.29 | 102.91 |
|
Apr 2019 |
103.83 | 102.46 | 103.38 | 103.42 | 103.09 |
|
May 2019 |
103.95 | 102.54 | 103.32 | 103.37 | 103.06 |
|
Jun 2019 |
104.06 | 102.61 | 103.01 | 103.05 | 102.74 |
|
Jul 2019 |
104.15 | 102.70 | 103.24 | 103.28 | 102.99 |
|
Aug 2019 |
104.27 | 102.65 | 103.37 | 103.40 | 103.13 |
|
Sep 2019 |
104.54 | 103.08 | 103.53 | 103.58 | 103.27 |
|
Oct 2019 |
104.55 | 103.20 | 103.40 | 103.45 | 103.04 |
|
Nov 2019 |
104.85 | 103.23 | 103.60 | 103.67 | 103.22 |
|
Dec 2019 |
105.04 | 103.25 | 103.23 | 103.37 | 102.92 |
|
Jan 2020 |
104.69 | 103.15 | 103.51 | 103.63 | 103.13 |
|
Feb 2020 |
104.87 | 103.55 | 103.72 | 103.82 | 103.30 |
|
Mar 2020 |
104.89 | 103.63 | 103.90 | 103.97 | 103.51 |
|
Source: U.S. Bureau of Labor Statistics. |
|||||
The comparison index grows at an annualized rate of 1.2 percent, which is slightly faster than the 0.9- to 1.0-percent rate for the medical claims indexes. (See table 6a.) The CPI for physicians’ services has an annualized growth rate of 0.9 percent, which is between the growth rate of the comparison index and the growth rates of the medical claims indexes.
| Index by source and method | Total change (percent) | Annualized change (percent) | SSE index value | SSE index relative (×104) |
|---|---|---|---|---|
| Comparison unchained Lowe | 4.9 | 1.2 | 1 | 1 |
| Consumer Price Index | 3.6 | 0.9 | 81 | 49 |
| Medical claims unchained Lowe (lagged) | 3.9 | 1.0 | 19 | 22 |
| Medical claims mixed quantity (lagged) | 4.0 | 1.0 | 17 | 22 |
| Medical claims chained Törnqvist (lagged) | 3.5 | 0.9 | 29 | 21 |
| 1 SSE scores are calculated relative to the comparison index. Note: SSE = sum of squared errors. Source: U.S. Bureau of Labor Statistics. | ||||
Chart 4b shows the CPI, the lagged medical claims indexes, and the comparison index for outpatient hospital services. Again, the indexes trend similarly, although the mixed-quantity index has the highest value at the end of the period. The mixed-quantity index is followed closely by the comparison index, the Törnqvist index, and the CPI. This pattern indicates that a 3-month lag may not be problematic.
| Date | Comparison unchained Lowe | Consumer Price Index | Medical claims unchained Lowe (lagged) | Medical claims mixed quantity (lagged) | Medical claims chained Törnqvist (lagged) |
|---|---|---|---|---|---|
|
Apr 2016 |
100.00 | 100.00 | 100.00 | 100.00 | 100.00 |
|
May 2016 |
100.57 | 100.28 | 100.36 | 100.28 | 100.24 |
|
Jun 2016 |
100.63 | 100.22 | 100.59 | 100.76 | 100.51 |
|
Jul 2016 |
101.19 | 100.57 | 100.58 | 100.83 | 100.44 |
|
Aug 2016 |
102.42 | 101.94 | 100.22 | 100.57 | 100.25 |
|
Sep 2016 |
102.96 | 102.24 | 101.05 | 101.52 | 100.84 |
|
Oct 2016 |
104.01 | 102.42 | 103.20 | 103.53 | 103.14 |
|
Nov 2016 |
104.36 | 102.36 | 103.24 | 103.60 | 103.51 |
|
Dec 2016 |
105.02 | 102.35 | 103.17 | 103.50 | 103.27 |
|
Jan 2017 |
104.55 | 103.11 | 102.85 | 103.33 | 103.24 |
|
Feb 2017 |
104.74 | 104.48 | 102.56 | 103.27 | 103.27 |
|
Mar 2017 |
104.64 | 104.69 | 102.32 | 103.30 | 103.36 |
|
Apr 2017 |
105.35 | 105.97 | 102.11 | 103.44 | 103.51 |
|
May 2017 |
104.54 | 105.85 | 102.66 | 103.52 | 103.79 |
|
Jun 2017 |
104.60 | 106.35 | 102.86 | 104.27 | 104.06 |
|
Jul 2017 |
104.41 | 106.70 | 103.11 | 104.74 | 104.34 |
|
Aug 2017 |
105.75 | 106.58 | 102.95 | 104.24 | 104.34 |
|
Sep 2017 |
104.39 | 106.89 | 104.08 | 105.08 | 105.45 |
|
Oct 2017 |
104.93 | 107.36 | 103.99 | 104.57 | 105.05 |
|
Nov 2017 |
105.07 | 107.20 | 104.46 | 105.03 | 105.35 |
|
Dec 2017 |
105.05 | 107.30 | 105.28 | 106.35 | 106.31 |
|
Jan 2018 |
108.30 | 109.33 | 104.78 | 106.09 | 106.31 |
|
Feb 2018 |
108.64 | 109.57 | 104.99 | 106.35 | 106.61 |
|
Mar 2018 |
109.57 | 110.07 | 105.20 | 106.62 | 106.90 |
|
Apr 2018 |
109.66 | 110.24 | 105.41 | 107.16 | 107.20 |
|
May 2018 |
109.77 | 110.36 | 106.02 | 107.63 | 107.80 |
|
Jun 2018 |
110.63 | 110.94 | 106.91 | 108.45 | 108.78 |
|
Jul 2018 |
110.99 | 111.29 | 106.74 | 108.14 | 108.67 |
|
Aug 2018 |
111.59 | 110.65 | 107.09 | 108.42 | 109.01 |
|
Sep 2018 |
111.49 | 110.33 | 107.74 | 109.14 | 109.62 |
|
Oct 2018 |
112.62 | 110.54 | 107.95 | 109.24 | 109.90 |
|
Nov 2018 |
112.91 | 111.36 | 108.44 | 109.67 | 110.48 |
|
Dec 2018 |
112.87 | 111.62 | 109.02 | 110.53 | 110.91 |
|
Jan 2019 |
113.73 | 112.00 | 109.39 | 111.09 | 111.50 |
|
Feb 2019 |
114.64 | 111.89 | 109.57 | 111.30 | 111.52 |
|
Mar 2019 |
113.83 | 111.97 | 110.08 | 111.80 | 112.02 |
|
Apr 2019 |
113.79 | 111.29 | 111.00 | 114.93 | 113.94 |
|
May 2019 |
113.16 | 111.31 | 110.64 | 114.40 | 113.24 |
|
Jun 2019 |
114.27 | 111.01 | 109.82 | 113.33 | 112.65 |
|
Jul 2019 |
114.67 | 111.69 | 110.26 | 113.33 | 112.93 |
|
Aug 2019 |
115.34 | 112.93 | 110.71 | 113.38 | 113.39 |
|
Sep 2019 |
115.52 | 112.72 | 111.22 | 112.96 | 113.90 |
|
Oct 2019 |
116.06 | 113.80 | 111.58 | 113.32 | 114.08 |
|
Nov 2019 |
116.14 | 113.83 | 112.06 | 113.35 | 114.65 |
|
Dec 2019 |
115.71 | 113.84 | 112.18 | 114.55 | 114.70 |
|
Jan 2020 |
115.67 | 115.51 | 112.98 | 115.90 | 115.35 |
|
Feb 2020 |
116.80 | 115.84 | 114.19 | 118.22 | 116.63 |
|
Mar 2020 |
117.46 | 116.00 | 113.89 | 118.84 | 116.31 |
|
Source: U.S. Bureau of Labor Statistics. |
|||||
Table 6b shows that the lagged mixed-quantity index has total and annualized changes that are among the closest to those of the comparison index. The Törnqvist index has the lowest SSE score in terms of index value, and the CPI has the lowest SSE score in terms of index relative.
| Index by source and method | Total change (percent) | Annualized change (percent) | SSE index value | SSE index relative (×104) |
|---|---|---|---|---|
| Comparison unchained Lowe | 17.5 | 4.1 | 1 | 1 |
| Consumer Price Index | 16.0 | 3.8 | 137 | 22 |
| Medical claims unchained Lowe (lagged) | 13.9 | 3.3 | 483 | 39 |
| Medical claims mixed quantity (lagged) | 18.8 | 4.4 | 168 | 50 |
| Medical claims chained Törnqvist (lagged) | 16.3 | 3.8 | 129 | 36 |
| 1 SSE scores are calculated relative to the comparison index. Note: SSE = sum of squared errors. Source: U.S. Bureau of Labor Statistics. | ||||
The results of our analysis show that the use of medical claims data in price-index construction produces indexes that more accurately track price changes in medical care than the currently produced CPIs for physicians’ services and outpatient hospital services. However, incorporating medical claims data in the CPI presents both advantages and disadvantages.
In terms of advantages, medical claims data provide significantly more observations, capture more types of services, and, compared with traditionally collected field data, involve faster updating of procedure quantities. The amount of claims data is larger than that of traditionally collected data by an order of magnitude, providing more procedure codes and more data for each code. Finally, by providing the monthly quantities of each observation, claims data allow us to update weights much faster and to choose among several options in selecting price-index formulas.
The main drawbacks of using medical claims data include the data’s lag, the convenience sampling involved in their collection, and the delay in incorporating new procedure codes. However, we believe that the medical claims data we receive address CPI’s needs successfully.
On the basis of our analysis, BLS has drawn the following conclusions:
(1) Even with a lag, the medical claims data can improve the CPI by supplementing traditionally collected data. Using medical claims data will reduce the amount of volatility in medical price indexes, address the problem of declining response rates, and produce consistent and accurate results.
(2) Medical claims data provide more observations for the CPI for medical care services and its component indexes, increasing index accuracy. The indexes capturing medical claims data are generally closer to the comparison index in terms of both index values and index relatives.
(3) The three formulas for calculating price indexes based on medical claims data produce similar results, and choosing one formula over another may not result in a substantially different index. For this reason, BLS should choose the index formula that most efficiently and accurately replicates CPI’s current formula. Although we were able to use medical claims data to calculate a superlative index with a formula that uses real-time weights, we believe that, for consistency in index-formula use, the production of medical price indexes should be based on current production methodology. Lower level substitution is not considered to be a major issue for medical goods and services. There is also a concern how a superlative index will reflect seasonal changes in the types of services performed.
BLS has decided to supplement traditionally collected data with medical claims data in the calculation of price indexes for physicians’ services and outpatient hospital services. The claims data will be incorporated into CPI calculations once BLS information technology systems are modified to accommodate the data. BLS will post an announcement on its website before implementation. BLS plans to continue research into the potential use of medical claims data in improving the inpatient hospital services component of the CPI market basket.
Some consider the Törnqvist index to be the most accurate index for measuring price change. According to this view, an unlagged Törnqvist index would be the most accurate representation of price changes within the medical claims data. Because the unlagged Törnqvist index is similar to the lagged mixed-quantity index, the latter, which is our production index of choice, is a good approximation of price changes in the real market.
Chart A-1 shows the lagged mixed-quantity index and the unlagged Törnqvist index for physicians’ services. As seen in the chart, the two indexes trend similarly. There are some notable time lags whereby a rise in the unlagged Törnqvist index is followed by a similar rise in the lagged mixed-quantity index 3 months later. The SSE comparing the mixed-quantity index with the Törnqvist index was calculated for both index values and monthly index relatives. The SSE index value is 11.6 and the SSE index relative is 2.9.
| Date | Mixed quantity (lagged) | Törnqvist (unlagged) |
|---|---|---|
|
Apr 2016 |
100.00 | 100.00 |
|
May 2016 |
100.10 | 100.48 |
|
Jun 2016 |
100.14 | 100.58 |
|
Jul 2016 |
100.10 | 100.75 |
|
Aug 2016 |
100.39 | 100.92 |
|
Sep 2016 |
100.51 | 100.93 |
|
Oct 2016 |
100.42 | 100.84 |
|
Nov 2016 |
100.51 | 101.08 |
|
Dec 2016 |
100.73 | 101.36 |
|
Jan 2017 |
100.89 | 101.60 |
|
Feb 2017 |
101.19 | 101.60 |
|
Mar 2017 |
101.31 | 101.49 |
|
Apr 2017 |
101.41 | 101.37 |
|
May 2017 |
101.27 | 101.33 |
|
Jun 2017 |
101.13 | 101.37 |
|
Jul 2017 |
101.17 | 101.42 |
|
Aug 2017 |
101.26 | 101.35 |
|
Sep 2017 |
101.26 | 101.62 |
|
Oct 2017 |
101.41 | 101.71 |
|
Nov 2017 |
101.11 | 101.79 |
|
Dec 2017 |
101.43 | 102.22 |
|
Jan 2018 |
101.50 | 102.44 |
|
Feb 2018 |
101.57 | 102.31 |
|
Mar 2018 |
101.64 | 102.34 |
|
Apr 2018 |
101.80 | 102.20 |
|
May 2018 |
101.80 | 102.24 |
|
Jun 2018 |
101.76 | 102.34 |
|
Jul 2018 |
101.55 | 102.31 |
|
Aug 2018 |
101.72 | 102.26 |
|
Sep 2018 |
101.87 | 102.57 |
|
Oct 2018 |
101.68 | 102.43 |
|
Nov 2018 |
101.79 | 102.44 |
|
Dec 2018 |
101.98 | 102.62 |
|
Jan 2019 |
102.57 | 103.18 |
|
Feb 2019 |
102.70 | 103.27 |
|
Mar 2019 |
103.29 | 103.04 |
|
Apr 2019 |
103.42 | 103.31 |
|
May 2019 |
103.37 | 103.46 |
|
Jun 2019 |
103.05 | 103.63 |
|
Jul 2019 |
103.28 | 103.40 |
|
Aug 2019 |
103.40 | 103.45 |
|
Sep 2019 |
103.58 | 103.12 |
|
Oct 2019 |
103.45 | 103.33 |
|
Nov 2019 |
103.67 | 103.62 |
|
Dec 2019 |
103.37 | 103.88 |
|
Jan 2020 |
103.63 | 104.08 |
|
Feb 2020 |
103.82 | 104.01 |
|
Mar 2020 |
103.97 | 104.12 |
|
Source: U.S. Bureau of Labor Statistics. |
||
Chart A-2 shows the lagged mixed-quantity index and the unlagged Törnqvist index for outpatient hospital services. Although the two indexes track closely with each other, their relative movements show some notable time-lag artifacts. For example, the Törnqvist index exhibits a rise in January 2019, and a similar rise does not appear until April 2019 for the mixed-quantity index. In this case, the SSE index value is 70.5 and the SSE index relative is 28.8.
| Date | Mixed quantity (lagged) | Törnqvist (unlagged) |
|---|---|---|
|
Apr 2016 |
100.00 | 100.00 |
|
May 2016 |
100.28 | 99.83 |
|
Jun 2016 |
100.76 | 100.37 |
|
Jul 2016 |
100.83 | 101.06 |
|
Aug 2016 |
100.57 | 101.50 |
|
Sep 2016 |
101.52 | 101.49 |
|
Oct 2016 |
103.53 | 103.26 |
|
Nov 2016 |
103.60 | 103.56 |
|
Dec 2016 |
103.50 | 103.13 |
|
Jan 2017 |
103.33 | 102.81 |
|
Feb 2017 |
103.27 | 103.69 |
|
Mar 2017 |
103.30 | 103.85 |
|
Apr 2017 |
103.44 | 104.59 |
|
May 2017 |
103.52 | 104.37 |
|
Jun 2017 |
104.27 | 105.42 |
|
Jul 2017 |
104.74 | 105.03 |
|
Aug 2017 |
104.24 | 105.33 |
|
Sep 2017 |
105.08 | 106.24 |
|
Oct 2017 |
104.57 | 106.13 |
|
Nov 2017 |
105.03 | 106.34 |
|
Dec 2017 |
106.35 | 106.28 |
|
Jan 2018 |
106.09 | 106.63 |
|
Feb 2018 |
106.35 | 107.28 |
|
Mar 2018 |
106.62 | 108.13 |
|
Apr 2018 |
107.16 | 107.92 |
|
May 2018 |
107.63 | 107.67 |
|
Jun 2018 |
108.45 | 108.87 |
|
Jul 2018 |
108.14 | 109.23 |
|
Aug 2018 |
108.42 | 110.41 |
|
Sep 2018 |
109.14 | 110.99 |
|
Oct 2018 |
109.24 | 111.57 |
|
Nov 2018 |
109.67 | 111.56 |
|
Dec 2018 |
110.53 | 111.91 |
|
Jan 2019 |
111.09 | 113.79 |
|
Feb 2019 |
111.30 | 113.62 |
|
Mar 2019 |
111.80 | 113.09 |
|
Apr 2019 |
114.93 | 113.24 |
|
May 2019 |
114.40 | 113.20 |
|
Jun 2019 |
113.33 | 113.71 |
|
Jul 2019 |
113.33 | 113.88 |
|
Aug 2019 |
113.38 | 114.44 |
|
Sep 2019 |
112.96 | 114.49 |
|
Oct 2019 |
113.32 | 114.17 |
|
Nov 2019 |
113.35 | 115.18 |
|
Dec 2019 |
114.55 | 114.85 |
|
Jan 2020 |
115.90 | 115.87 |
|
Feb 2020 |
118.22 | 116.01 |
|
Mar 2020 |
118.84 | 117.12 |
|
Source: U.S. Bureau of Labor Statistics. |
||
John Bieler, Caleb Cho, JD Gayer, Brett Matsumoto, Brian T. Parker, and Daniel Wang, "Incorporating medical claims data in the Consumer Price Index," Monthly Labor Review, U.S. Bureau of Labor Statistics, February 2023, https://doi.org/10.21916/mlr.2023.3
1 Xue Song, William D. Marder, Robert Houchens, Jonathan E. Conklin, and Ralph Bradley, “Can a disease-based price index improve the estimation of the medical Consumer Price Index?” in W. Erwin Diewert, John S. Greenlees, and Charles R. Hulten, eds., Price index concepts and measurement (University of Chicago Press, 2009), pp. 329–372.
2 The term “payer type” refers to the person, organization, or entity that pays for the care administered by a healthcare provider.
3 John Bieler, Caleb Cho, Brett Matsumoto, Brian Parker, and Daniel Wang, “Using insurance claims data in the medical price indexes,” paper presented at the 2020 American Economic Association annual meeting, January 1–5, 2020, https://www.aeaweb.org/conference/2020/preliminary/paper/7i7sn2D3.
4 A longer lag is more noticeable at the geographic-area level. The U.S. Bureau of Labor Statistics (BLS) uses lagged data for other items such as rent.
5 For this project, we focused on physicians’ services and outpatient hospital services because they have the highest relative importance of all items in the medical price indexes and because they exhibit the lowest response rates. Prescription drugs also have a high relative importance but do not exhibit the same low response rates.
6 The BLS Consumer Price Index (CPI) program is still researching the use of medical claims data for inpatient hospital services.
7 See “Consumer Price Index,” Handbook of Methods (U.S. Bureau of Labor Statistics), https://www.bls.gov/opub/hom/cpi/pdf/cpi.pdf.
8 The data may not be representative if there is nonrandom nonresponse either in the household survey or by providers.
9 Before 2018, there were 87 geographic areas covered in the CPI. In 2018, a geographic revision of the CPI reduced the number of areas to 75 and changed the composition of the area sample. The data conform to the CPI geographic revision and cover the same 75 areas from 2018 onward.
10 For a discussion of unit-value indexes and claims data, see Accounting for health and health care: approaches to measuring the sources and costs of their improvement (National Research Council, 2010).
11 CPT is a registered trademark of the American Medical Association.
12 Dental codes maintained by the American Dental Association are an exception.
13 Outliers are defined as observations falling above the threshold of +4 median absolute deviations or below the lower bound threshold of 30 percent of Medicare rates.
14 Only data for “patient care” were used. Other categories are “teaching” and “research” (see https://www.aamc.org/data-reports/workforce/interactive-data/active-physicians-largest-specialties-2017).
15 These methodologies involved the calculation of chained Paasche indexes; geometric means; Fisher, Laspeyres, and Lowe indexes; and chained and unchained quantity shares.
16 See, for example, Michael R. Baye, “Price dispersion and functional price indices,” Econometrica, vol. 53, no. 1, January 1985, pp. 217–224; and Marshall Reinsdorf, “The effect of price dispersion on cost of living indexes,” International Economic Review, vol. 35, no. 1, February 1994, pp. 137–149.
17 The CPI for physicians’ services also exhibits an initial rise in the case of all-payer and lagged medical claims indexes. This rise can be attributed, in part, to changes across several areas for both self-pay and private insurance prices.
18 During the brief rise in the series, missing insurance observations in the index for physicians’ services would impute off of all-payer types within the geographic area. It is possible that the CPI for private insurance is being driven by price movements for the self-pay and Medicare payer types.