An official website of the United States government
 United States Department of Labor
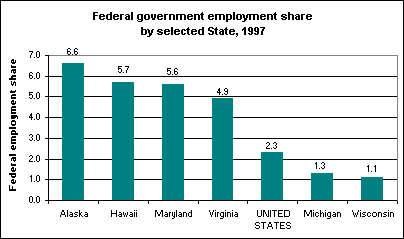
In 1997, the federal government employed 2.8 million people, accounting for about 2.3 percent of jobs in the United States. Twenty States had federal employment shares above the national average. Outside of the District of Columbia, where nearly one of every three employees works for the federal government, the State with the largest share of federal employment was Alaska at 6.6 percent.

[Chart data—TXT]
Following Alaska, Hawaii (5.7 percent), Maryland (5.6), Virginia (4.9), New Mexico (4.4), and Montana (3.6) reported the highest federal employment shares. The State with the lowest Federal employment share was Wisconsin at 1.1 percent, followed by Michigan (1.3), and Connecticut, Delaware, Indiana, and Minnesota (each 1.4).
These employment data are produced by the BLS Covered Employment and Wages (ES-202) program, a virtual census of establishments, employment, and wages of employees on nonfarm payrolls. Additional information may be obtained from the bulletin, "Employment and Wages Annual Averages, 1997."
Bureau of Labor Statistics, U.S. Department of Labor, The Economics Daily, Outside DC, largest federal employment share in Alaska at https://www.bls.gov/opub/ted/1999/mar/wk1/art01.htm (visited January 16, 2026).

