An official website of the United States government
 United States Department of Labor
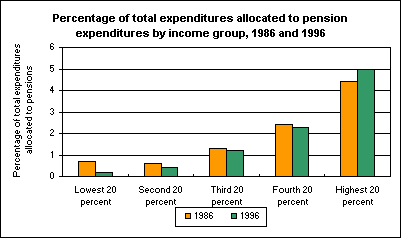
The share of consumer spending allocated to pensions was lower in 1996 than in 1986 for all income groups except the highest.

[Chart data—TXT]
Of the five income groups shown in the chart, four reduced the percentage of their expenditures that went to pensions. The lowest income group reduced its expenditures on pensions the most—by 0.5 percentage point from 1986 to 1996. In contrast, the highest income group increased the share of its expenditures allocated to pensions from 4.4 percent to 5.0 percent.
Overall, the percentage of total expenditures contributed to pensions fell slightly, from 2.4 percent in 1986 to 2.3 percent in 1996. The average expenditure on pensions (in 1996 dollars) fell from $834 in 1986 to $784 in 1996.
These data are a product of the BLS Consumer Expenditure Survey program. Additional information is available from "Consumer Expenditure Survey: Quarterly Data from the Interview Survey, Second Quarter 1997: Recent Changes in Pension Expenditures," BLS Report 931.
Bureau of Labor Statistics, U.S. Department of Labor, The Economics Daily, Pension expenditures drop for all except highest income group at https://www.bls.gov/opub/ted/1999/aug/wk2/art02.htm (visited February 20, 2026).

