An official website of the United States government
 United States Department of Labor
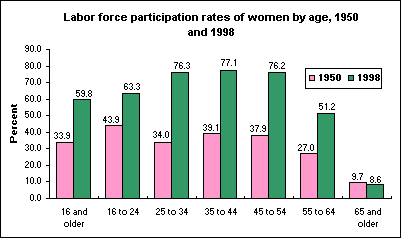
In 1950 about one in three women participated in the labor force. By 1998, nearly three of every five women of working age were in the labor force. Among women age 16 and over, the labor force participation rate was 33.9 percent in 1950, compared with 59.8 percent in 1998.

[Chart data—TXT]
Changes in labor force participation varied by age group. The biggest increase in labor force participation was among those age 25 to 34—their rate more than doubled, from a level of 34.0 percent in 1950 to 76.3 percent in 1998. Also, in 1950 women age 16 to 24 had the highest labor force participation rate (43.9 percent); in 1998 women age 35 to 44 had the highest rate (77.1 percent), followed closely by those age 25 to 34 (76.3 percent) and those age 45 to 54 (76.2 percent).
The only age group to experience a decline in labor force participation between 1950 and 1998 was those age 65 and over. The rate for women in this age group dropped from 9.7 percent to 8.6 percent.
Data on labor force participation are from the Current Population Survey. Find out more in "Labor force participation: 75 years of change, 1950-98 and 1998-2025," by Howard N Fullerton, Jr., Monthly Labor Review, December 1999.
Bureau of Labor Statistics, U.S. Department of Labor, The Economics Daily, Changes in women’s labor force participation in the 20th century at https://www.bls.gov/opub/ted/2000/feb/wk3/art03.htm (visited February 17, 2026).

