An official website of the United States government
An official website of the United States government
The .gov means it's official.
Federal government websites often end in .gov or .mil. Before sharing sensitive information,
make sure you're on a federal government site.
The site is secure.
The
https:// ensures that you are connecting to the official website and that any
information you provide is encrypted and transmitted securely.
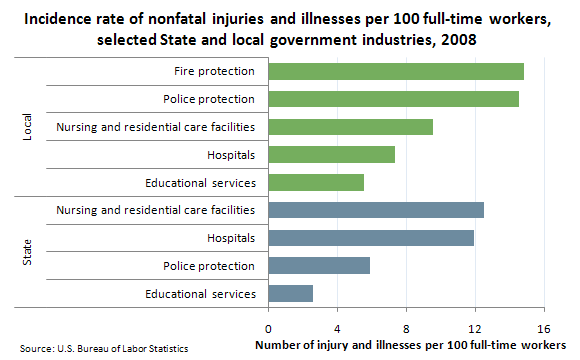
Local government workers as a whole experienced injuries and illnesses at a much higher rate than their State government counterparts—7.0 cases per 100 full-time workers compared with 4.7 cases.
Workers in local government fire protection and police protection experienced nonfatal injuries and illnesses at some of the highest rates among all workers—14.8 and 14.5 cases per 100 full-time workers, respectively.
Local police protection experienced a rate of injuries and illnesses more than double that of their State police protection counterparts, whose rate was 5.9 cases per 100 workers.
The incidence rate of injuries and illnesses among hospital workers was highest in State government at 11.9 cases per 100 full-time workers—more than one and a half times that experienced by hospital workers in local government (7.3 cases).
State government nursing and residential care facilities reported 12.5 cases of injuries and illnesses per 100 full-time workers, compared with 9.5 cases for local government.
Local government establishments in educational services reported an injury and illness incidence rate of 5.5 cases per 100 full-time workers; this was more than twice the rate reported for educational services workers in State government (2.6 cases). Reasons for the variation in rates may include differences in industry mix and different distributions of large populations of employees in higher risk industries within these groups, as well as other factors.
These data are from the Survey of Occupational Injuries and Illnesses, which is part of the BLS Injuries, Illnesses, and Fatalities program. National data was collected on State and local government workers for the first time in 2008. To learn more, see "Nonfatal injuries and illnesses in State and local government workplaces in 2008" (PDF) in the February 2011 issue of the Monthly Labor Review.
Bureau of Labor Statistics, U.S. Department of Labor, The Economics Daily, Nonfatal injuries and illnesses in State and local government industries, 2008 at https://www.bls.gov/opub/ted/2011/ted_20110303.htm (visited July 07, 2026).