An official website of the United States government
An official website of the United States government
The .gov means it's official.
Federal government websites often end in .gov or .mil. Before sharing sensitive information,
make sure you're on a federal government site.
The site is secure.
The
https:// ensures that you are connecting to the official website and that any
information you provide is encrypted and transmitted securely.
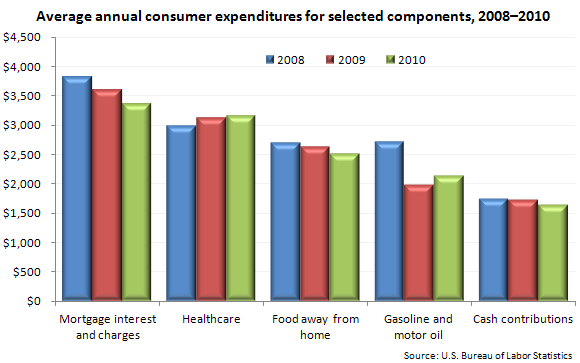
Amounts spent for selected expenditure components varied over the 3-year period from 2008 to 2010.
Spending changes included:
These data come from the Consumer Expenditure Survey. To learn more, see "Consumer Expenditures — 2010" (HTML) (PDF), news release USDL-11-1395. Consumer units include families, single persons living alone or sharing a household with others but who are financially independent, or two or more persons living together who share expenses.
Bureau of Labor Statistics, U.S. Department of Labor, The Economics Daily, Consumer spending patterns, 2008–2010 at https://www.bls.gov/opub/ted/2011/ted_20111006.htm (visited July 16, 2026).