Employment status of parents, 2011
April 27, 2012
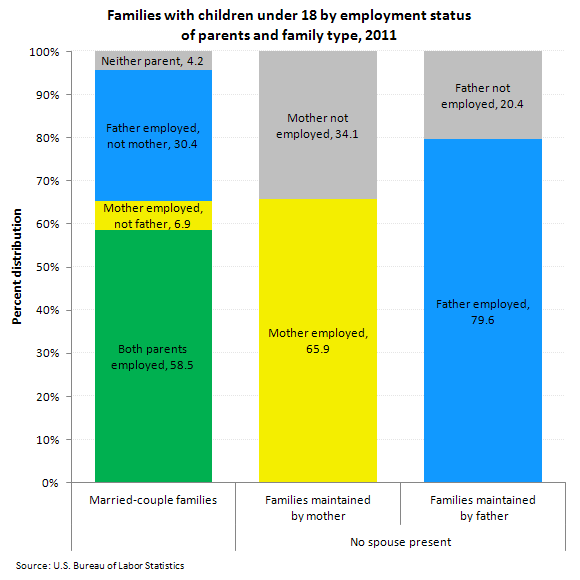
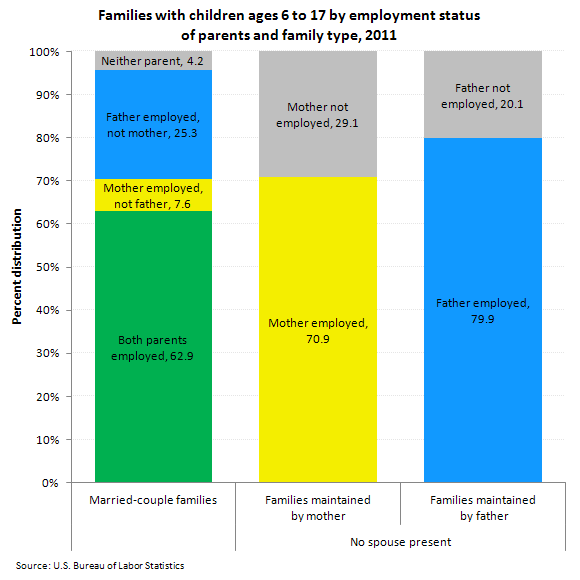
Among married-couple families with children, 95.8 percent had an employed parent in 2011, little changed from the prior year. The share of married-couple families where both parents worked edged up to 58.5 percent in 2011. The share of married-couple families where the father was employed (and the mother was not) was 30.4 percent; the share where the mother was employed (and the father was not) was 6.9 percent.

Families with children by employment status of parents, age of youngest child, and family type, 2011| Family type | Families with own children under 18 years | Families with own children 6 to 17 years, none younger | Families with own children under 6 years |
|---|
Married-couple families | | | |
|---|
Total | 100.0 | 100.0 | 100.0 |
|---|
Both parents employed | 58.5 | 62.9 | 53.0 |
|---|
Mother employed, not father | 6.9 | 7.6 | 6.1 |
|---|
Father employed, not mother | 30.4 | 25.3 | 36.7 |
|---|
Neither parent employed | 4.2 | 4.2 | 4.2 |
|---|
Families maintained by mother | | | |
|---|
Total | 100.0 | 100.0 | 100.0 |
|---|
Mother employed | 65.9 | 70.9 | 58.6 |
|---|
Mother not employed | 34.1 | 29.1 | 41.4 |
|---|
Families maintained by father | | | |
|---|
Total | 100.0 | 100.0 | 100.0 |
|---|
Father employed | 79.6 | 79.9 | 79.2 |
|---|
Father not employed | 20.4 | 20.1 | 20.8 |
|---|
These data are featured in the TED article, Employment status of parents, 2011.
The mother was employed in 65.9 percent of families with children maintained by women with no spouse present in 2011. The father was employed in 79.6 percent of families maintained by men with no spouse present.
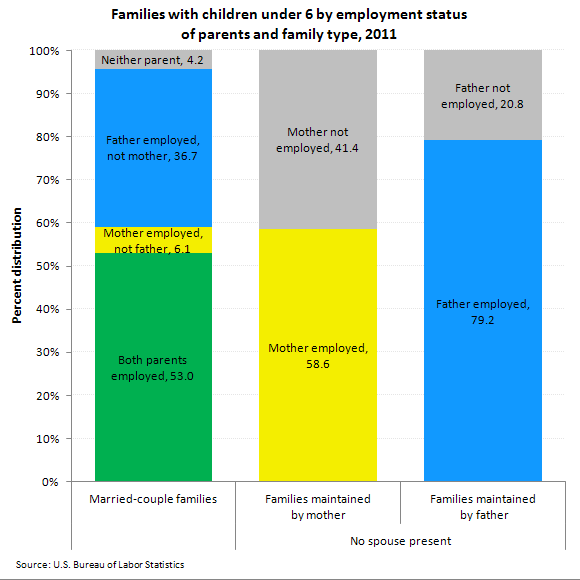
Mothers with younger children are less likely to be employed than mothers with older children. The mother was employed in 58.6 percent of families with children under 6 years old maintained by women with no spouse present in 2011.
These data are from the Current Population Survey. For more information, see "Employment Characteristics of Families — 2011" (HTML) (PDF), news release USDL-12-0771. Own children include sons, daughters, step-children, and adopted children. Not included are nieces, nephews, grandchildren, and other related and unrelated children.
OF INTEREST
Recent editions of Spotlight on Statistics
 United States Department of Labor

