An official website of the United States government
 United States Department of Labor
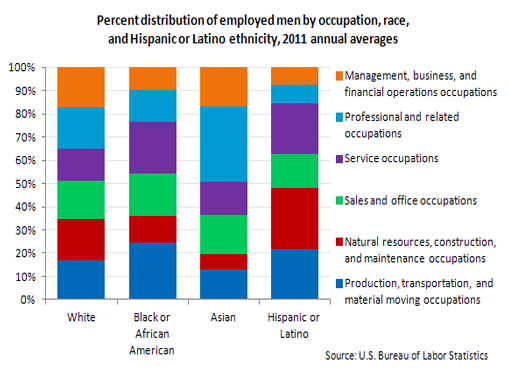
Among employed men, 17 percent of Asians and Whites worked in management, business, and financial operations occupations in 2011, compared with 10 percent of Blacks or African Americans, and 8 percent of Hispanics or Latinos.

| Occupation and sex | White | Black or African American | Asian | Hispanic or Latino |
|---|---|---|---|---|
Men, 16 years and older | 100.0 | 100.0 | 100.0 | 100.0 |
Management, business, and financial operations occupations | 17.4 | 9.7 | 16.9 | 7.7 |
Professional and related occupations | 17.6 | 13.8 | 32.3 | 7.9 |
Service occupations | 13.8 | 22.3 | 14.2 | 21.9 |
Sales and office occupations | 16.6 | 18.0 | 17.1 | 14.6 |
Natural resources, construction, and maintenance occupations | 17.9 | 11.6 | 6.5 | 26.1 |
Production, transportation, and material moving occupations | 16.8 | 24.6 | 13.0 | 21.8 |
Women, 16 years and older | 100.0 | 100.0 | 100.0 | 100.0 |
Management, business, and financial operations occupations | 14.7 | 11.2 | 15.4 | 8.9 |
Professional and related occupations | 27.6 | 22.9 | 29.0 | 16.3 |
Service occupations | 19.9 | 28.0 | 21.8 | 31.2 |
Sales and office occupations | 31.8 | 30.8 | 26.3 | 31.8 |
Natural resources, construction, and maintenance occupations | 0.9 | 0.5 | 0.6 | 1.8 |
Production, transportation, and material moving occupations | 5.1 | 6.7 | 6.9 | 10.1 |
These data are featured in the TED article, Occupational employment by race and ethnicity, 2011.
Nearly a third of employed Asian men worked in professional and related occupations in 2011; that compares with 18 percent of white men, 14 percent of black men, and 8 percent of Hispanic or Latino men.
About 22 percent of employed black men and Hispanic or Latino men were employed in service occupations in 2011, whereas 14 percent of employed Asian men and white men worked in these occupations. Employed black and Hispanic or Latino men also were more likely than white or Asian men to work in production, transportation, and material moving occupations. About one-quarter of employed Hispanic or Latino men worked in natural resources, construction, and maintenance occupations, a higher share than for white men (18 percent), black men (12 percent), or Asian men (7 percent).
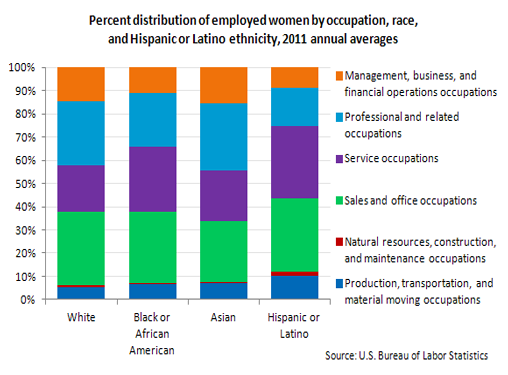
In 2011, employed Asian and white women were more likely than black or Hispanic or Latino women to work in management, business, and financial operations occupations or in professional and related occupations. These two occupational groups comprised 44 percent of employed Asian women and 42 percent of employed white women. By contrast, 34 percent of employed black women and 25 percent of employed Hispanic or Latino women worked in these occupations.

| Occupation and sex | White | Black or African American | Asian | Hispanic or Latino |
|---|---|---|---|---|
Men, 16 years and older | 100.0 | 100.0 | 100.0 | 100.0 |
Management, business, and financial operations occupations | 17.4 | 9.7 | 16.9 | 7.7 |
Professional and related occupations | 17.6 | 13.8 | 32.3 | 7.9 |
Service occupations | 13.8 | 22.3 | 14.2 | 21.9 |
Sales and office occupations | 16.6 | 18.0 | 17.1 | 14.6 |
Natural resources, construction, and maintenance occupations | 17.9 | 11.6 | 6.5 | 26.1 |
Production, transportation, and material moving occupations | 16.8 | 24.6 | 13.0 | 21.8 |
Women, 16 years and older | 100.0 | 100.0 | 100.0 | 100.0 |
Management, business, and financial operations occupations | 14.7 | 11.2 | 15.4 | 8.9 |
Professional and related occupations | 27.6 | 22.9 | 29.0 | 16.3 |
Service occupations | 19.9 | 28.0 | 21.8 | 31.2 |
Sales and office occupations | 31.8 | 30.8 | 26.3 | 31.8 |
Natural resources, construction, and maintenance occupations | 0.9 | 0.5 | 0.6 | 1.8 |
Production, transportation, and material moving occupations | 5.1 | 6.7 | 6.9 | 10.1 |
These data are featured in the TED article, Occupational employment by race and ethnicity, 2011.
Among employed women, 31 percent of Hispanics or Latinos and 28 percent of Blacks worked in service occupations; 20 percent of employed white women and 22 percent of employed Asian women worked in these occupations. Sales and office occupations accounted for slightly less than a third of employment among black, white, and Hispanic or Latino women; Asian women were slightly less likely (26 percent) than other women to work in sales and office occupations.
These data are from the Current Population Survey. For more information, see "Labor Force Characteristics by Race and Ethnicity, 2011" (PDF), Report 1036, August 2012. People of Hispanic or Latino ethnicity may be of any race. In 2011, the majority of Hispanics (93 percent) were White, 3 percent were Black, and 1 percent were Asian.
Bureau of Labor Statistics, U.S. Department of Labor, The Economics Daily, Occupational employment by race and ethnicity, 2011 at https://www.bls.gov/opub/ted/2012/ted_20121026.htm (visited February 12, 2026).

