
An official website of the United States government
An official website of the United States government
The .gov means it's official.
Federal government websites often end in .gov or .mil. Before sharing sensitive information,
make sure you're on a federal government site.
The site is secure.
The
https:// ensures that you are connecting to the official website and that any
information you provide is encrypted and transmitted securely.
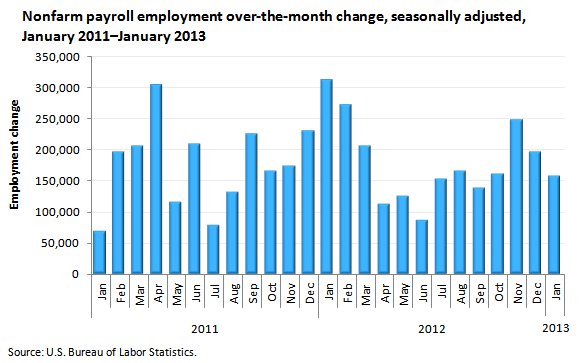
Total nonfarm payroll employment increased by 157,000 in January. In 2012, employment growth averaged 181,000 per month.
| Month | Employment change |
|---|---|
Jan 2011 | 69,000 |
Feb 2011 | 196,000 |
Mar 2011 | 205,000 |
Apr 2011 | 304,000 |
May 2011 | 115,000 |
Jun 2011 | 209,000 |
Jul 2011 | 78,000 |
Aug 2011 | 132,000 |
Sep 2011 | 225,000 |
Oct 2011 | 166,000 |
Nov 2011 | 174,000 |
Dec 2011 | 230,000 |
Jan 2012 | 311,000 |
Feb 2012 | 271,000 |
Mar 2012 | 205,000 |
Apr 2012 | 112,000 |
May 2012 | 125,000 |
Jun 2012 | 87,000 |
Jul 2012 | 153,000 |
Aug 2012 | 165,000 |
Sep 2012 | 138,000 |
Oct 2012 | 160,000 |
Nov 2012 | 247,000 |
Dec 2012 | 196,000(p) |
Jan 2013 | 157,000(p) |
Footnotes: | |
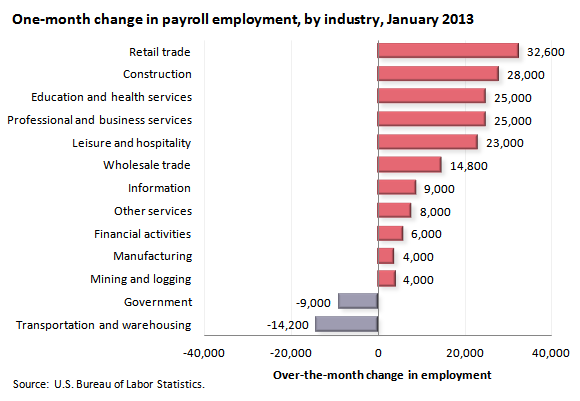
Employment in retail trade rose by 32,600 in January, compared with an average monthly gain of 20,000 in 2012. Within the industry, job growth continued in motor vehicle and parts dealers (+6,600), electronics and appliance stores (+5,100), and clothing stores (+10,000).
In January, employment in construction increased by 28,000. Nearly all of the job growth occurred in specialty trade contractors (+26,200), with the gain about equally split between residential and nonresidential specialty trade contractors.
Health care (part of education and health services) continued to add jobs in January (+22,800). Within health care, job growth occurred in ambulatory health care services (+27,600), which includes doctors’ offices and outpatient care centers. This gain was partially offset by a loss of 8,400 jobs in nursing and residential care facilities.
| Industry | Change in payroll employment (p) |
|---|---|
Retail trade | 32,600 |
Construction | 28,000 |
Professional and business services | 25,000 |
Education and health services | 25,000 |
Leisure and hospitality | 23,000 |
Wholesale trade | 14,800 |
Information | 9,000 |
Other services | 8,000 |
Financial activities | 6,000 |
Mining and logging | 4,000 |
Manufacturing | 4,000 |
Government | -9,000 |
Transportation and warehousing | -14,200 |
Footnotes: | |
Employment edged down in transportation and warehousing in January (−14,200). Couriers and messengers lost 18,500 jobs over the month, following strong seasonal hiring in November and December. Air transportation employment decreased by 4,900 in January.
Manufacturing employment was essentially unchanged in January and has changed little, on net, since July 2012.
These data are from the Current Employment Statistics (CES) program and are seasonally adjusted. Data for the most recent two months are preliminary. To learn more, see "The Employment Situation — January 2013," (HTML) (PDF) news release USDL-13-0144. More charts featuring CES employment data can be found in Current Employment Statistics Highlights: January 2013 (PDF).
Bureau of Labor Statistics, U.S. Department of Labor, The Economics Daily, Payroll employment in January 2013 at https://www.bls.gov/opub/ted/2013/ted_20130204.htm (visited July 14, 2026).
