An official website of the United States government
 United States Department of Labor
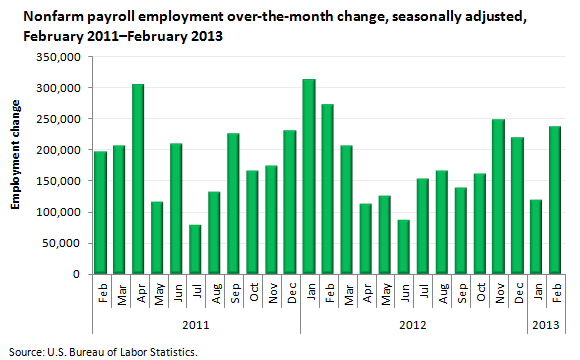
Total nonfarm payroll employment increased by 236,000 in February, with job gains in professional and business services, construction, and health care. In the prior 3 months, employment had risen by an average of 195,000 per month.

| Month | Employment change |
|---|---|
Feb 2011 | 196,000 |
Mar 2011 | 205,000 |
Apr 2011 | 304,000 |
May 2011 | 115,000 |
Jun 2011 | 209,000 |
Jul 2011 | 78,000 |
Aug 2011 | 132,000 |
Sep 2011 | 225,000 |
Oct 2011 | 166,000 |
Nov 2011 | 174,000 |
Dec 2011 | 230,000 |
Jan 2012 | 311,000 |
Feb 2012 | 271,000 |
Mar 2012 | 205,000 |
Apr 2012 | 112,000 |
May 2012 | 125,000 |
Jun 2012 | 87,000 |
Jul 2012 | 153,000 |
Aug 2012 | 165,000 |
Sep 2012 | 138,000 |
Oct 2012 | 160,000 |
Nov 2012 | 247,000 |
Dec 2012 | 219,000 |
Jan 2013 | (p)119,000 |
Feb 2013 | (p)236,000 |
Footnotes: | |
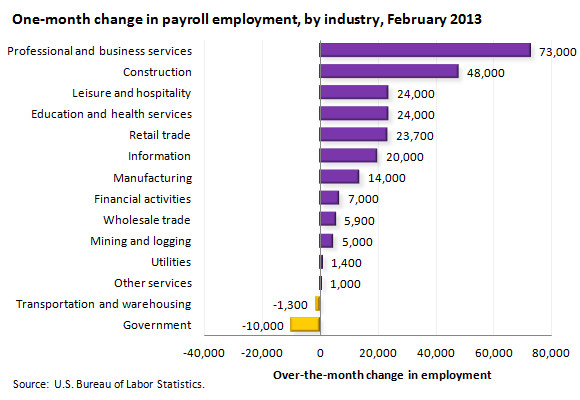
Professional and business services added 73,000 jobs in February; employment in the industry had changed little (+16,000) in January. Employment in administrative and support services, which includes employment services and services to buildings, rose by 44,000 in February. Accounting and bookkeeping services added 11,000 jobs, and growth continued in computer systems design and in management and technical consulting services.
In February, employment in construction increased by 48,000; since September, construction employment has risen by 151,000. Job growth occurred in specialty trade contractors, with this gain about equally split between residential (+17,000) and nonresidential specialty contractors (+15,000). Nonresidential building construction also added jobs (+6,000).
The health care industry (part of education and health services) continued to add jobs in February (+32,000). Within health care, there was a job gain of 14,000 in ambulatory health care services, which includes doctors’ offices and outpatient care centers. Employment also increased over the month in nursing and residential care facilities (+9,000) and hospitals (+9,000).

| Industry | Change in payroll employment (p) |
|---|---|
Professional and business services | 73,000 |
Construction | 48,000 |
Education and health services | 24,000 |
Leisure and hospitality | 24,000 |
Retail trade | 23,700 |
Information | 20,000 |
Manufacturing | 14,000 |
Financial activities | 7,000 |
Wholesale trade | 5,900 |
Mining and logging | 5,000 |
Utilities | 1,400 |
Other services | 1,000 |
Transportation and warehousing | -1,300 |
Government | -10,000 |
Footnotes: | |
Employment in the information industry increased over the month (+20,000), lifted by a large job gain in the motion picture and sound recording industry.
Employment continued to trend up in retail trade in February (+23,700); retail trade has added 252,000 jobs over the past 12 months. Employment also continued to trend up over the month in food services and drinking places and in wholesale trade. Employment in other major industries showed little change over the month.
These data are from the Current Employment Statistics (CES) program and are seasonally adjusted. To learn more, see “The Employment Situation — February 2013” (HTML) (PDF), news release USDL-13-0389. More charts featuring CES employment data can be found in Current Employment Statistics Highlights: February 2013 (PDF).
Bureau of Labor Statistics, U.S. Department of Labor, The Economics Daily, Payroll employment up in February 2013 at https://www.bls.gov/opub/ted/2013/ted_20130311.htm (visited February 07, 2026).

