An official website of the United States government
 United States Department of Labor
In 2011, the percentage of total employment associated with the production of Green Goods and Services (GGS) increased by 0.1 percentage point to 2.6 percent. The number of GGS jobs increased by 157,746 to 3,401,279. GGS employment accounted for 2.3 percent of private sector jobs and 4.2 percent of public sector jobs in 2011. The private sector had 2,515,200 GGS jobs, while the public sector had 886,080 GGS jobs.
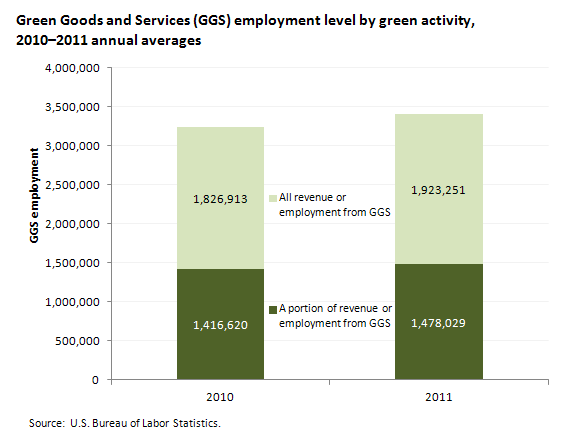
In 2011, the majority (56.5 percent) of GGS employment was found in establishments that exclusively produced green goods and services; these establishments had 1,923,251 GGS jobs. Establishments that produced a mix of green and non-green goods and services (a portion of revenue or employment was associated with green goods and services) had 1,478,029 GGS jobs in the same time period. Establishments that produced no green goods or services accounted for 67.1 percent of employment within the GGS scope.

| Revenue or employment from GGS | 2010 | 2011 |
|---|---|---|
A portion of revenue or employment from GGS | 1,416,620 | 1,478,029 |
All revenue or employment from GGS | 1,826,913 | 1,923,251 |
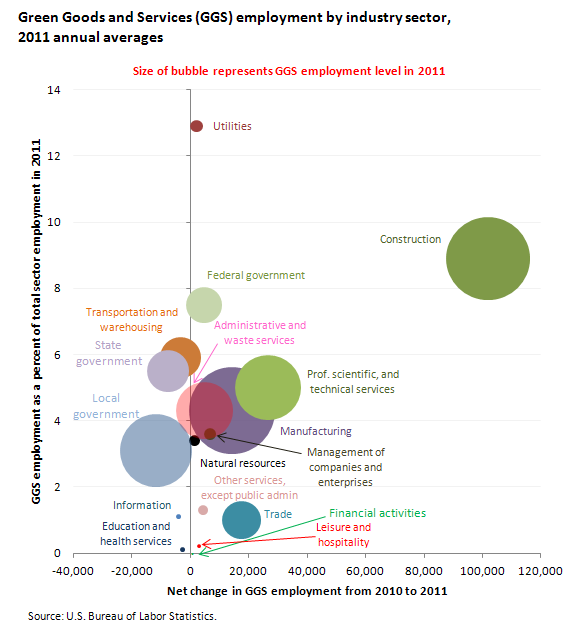
Among private sector industries in 2011, manufacturing had the largest number of GGS jobs (507,168). These GGS jobs accounted for 4.3 percent of manufacturing employment. Examples of green goods and services produced by manufacturing industries include iron and steel from recycled inputs, air conditioning and refrigeration equipment meeting selected standards, hybrid cars and parts, and pollution mitigation equipment.

| Industry | GGS employment level in 2011 | GGS employment as a percent of total sector employment in 2011 | Net change in GGS employment from 2010 to 2011 |
|---|---|---|---|
Total private | 2,515,200 | 2.3 | 172,638 |
Natural resources | 64,689 | 3.4 | 1,345 |
Utilities | 71,129 | 12.9 | 2,098 |
Construction | 487,709 | 8.9 | 101,932 |
Manufacturing | 507,168 | 4.3 | 14,183 |
Trade | 223,079 | 1.0 | 17,512 |
Transportation and warehousing | 238,755 | 5.9 | -3,382 |
Information | 29,412 | 1.1 | -3,909 |
Financial activities | 475 | 0.0 | 13 |
Professional scientific, and technical services | 381,981 | 5.0 | 26,595 |
Management of companies and enterprises | 69,310 | 3.6 | 6,680 |
Administrative and waste services | 335,417 | 4.3 | 4,767 |
Education and health services | 26,123 | 0.1 | -2,666 |
Leisure and hospitality | 23,696 | 0.2 | 3,054 |
Other services, except public administration | 56,257 | 1.3 | 4,416 |
Total government | 886,080 | 4.2 | -14,890 |
Federal government | 213,340 | 7.5 | 4,596 |
State government | 248,539 | 5.5 | -7,685 |
Local government | 424,201 | 3.1 | -11,801 |
Construction had 487,709 GGS jobs in 2011, comprising 8.9 percent of the sector's employment. The sector had the largest increase in GGS employment from 2010 to 2011, up 101,932, or 26.4 percent. Among the GGS activities performed within the sector are the construction of plants that produce energy from renewable sources and weatherizing and retrofitting projects that reduce household energy consumption.
Utilities had 71,129 GGS jobs in 2011, or 12.9 percent of total private utilities employment. The private utilities sector added 2,098 GGS jobs in 2011, a 3.0 percent increase. Among the industries involved in private sector electric power generation, nuclear electric power generation had the highest GGS employment, followed by hydroelectric power generation.
The public sector had 886,080 GGS jobs in 2011, accounting for 4.2 percent of employment in the sector. Over the year, government GGS employment decreased by 14,890 (-1.7 percent). Local government had 424,201 GGS jobs in 2011, the most in the public sector, representing 3.1 percent of local government employment.
The GGS employment data are compiled through the Green Goods and Services survey under the Quarterly Census of Employment and Wages program. The GGS survey includes approximately 120,000 business and government establishments within 325 industries that are identified as potentially producing or providing green goods or services. Establishments in the sample report whether they produced green goods and services and the percentage of their revenue or employment associated with that output. Those percentages are multiplied by their employment to derive the number of GGS jobs for the establishment. To learn more, see "Employment in Green Goods and Services — 2011" (HTML) (PDF), news release USDL-13-0476.
Bureau of Labor Statistics, U.S. Department of Labor, The Economics Daily, Employment in green good and services, 2011 at https://www.bls.gov/opub/ted/2013/ted_20130401.htm (visited February 22, 2026).

