An official website of the United States government
 United States Department of Labor
In February 2013, 303 metropolitan areas had over-the-year increases in nonfarm payroll employment, 58 had decreases, and 11 had no change. Unemployment rates were lower than a year earlier in 287 of the 372 metropolitan areas, higher in 69 areas, and unchanged in 16 areas.
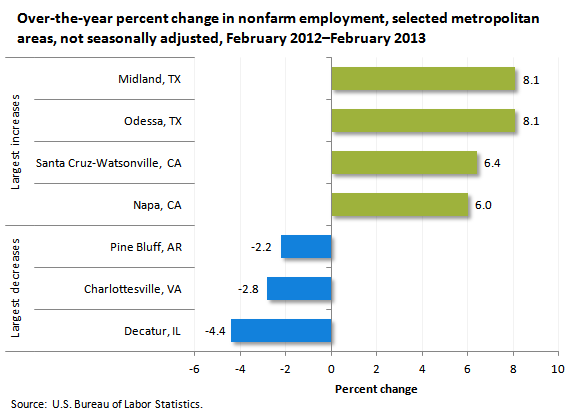
From February 2012 to February 2013, the largest over-the-year percentage gains in employment were in Midland, Texas, and Odessa, Texas (+8.1 percent each), followed by Santa Cruz-Watsonville, California (+6.4 percent), and Napa, California (+6.0 percent).

| Metropolitan area | Percent change(p) |
|---|---|
Largest increases | |
Midland, TX | 8.1 |
Odessa, TX | 8.1 |
Santa Cruz-Watsonville, CA | 6.4 |
Napa, CA | 6.0 |
Largest decreases | |
Pine Bluff, AR | -2.2 |
Charlottesville, VA | -2.8 |
Decatur, IL | -4.4 |
(p)=preliminary. |
The largest over-the-year percentage decrease in employment occurred in Decatur, Illinois (−4.4 percent), followed by Charlottesville, Virginia (−2.8 percent), and Pine Bluff, Arkansas (−2.2 percent).
Yuba City, California, had the largest over-the-year unemployment rate decrease in February (−2.5 percentage points), followed by Ocala, Florida, and Salinas, California (−2.4 points each). Eighty-nine other areas had rate declines of at least 1.0 percentage point. Yuma, Arizona, had the largest over-the-year jobless rate increase (+3.1 percentage points), followed by Decatur, Illinois (+2.8 points).
In February, 61 metropolitan areas had jobless rates of at least 10.0 percent, down from 81 areas a year earlier, while 120 areas had rates below 7.0 percent, up from 87 areas in February 2012.
These metropolitan area data are from the Current Employment Statistics (State and Area) and Local Area Unemployment Statistics programs; these data are not seasonally adjusted. Data for the most recent month are preliminary and subject to revision. To learn more, see "Metropolitan Area Employment and Unemployment — February 2013" (HTML) (PDF), news release USDL‑13‑0627.
Bureau of Labor Statistics, U.S. Department of Labor, The Economics Daily, Metropolitan area employment and unemployment, February 2013 at https://www.bls.gov/opub/ted/2013/ted_20130411.htm (visited February 08, 2026).

